 In this post I will list out the All-Time Detroit Tigers lineup, according to Player Value. I will follow along the same format as MLB uses with its new "All-MLB" teams, which you can view here. That format is 1 player for each defensive position, 5 starters, and 2 relievers. I will only use DHs for AL teams, since most NL teams don't have enough seasons with the DH to really have a deserving player. Importantly, and as the graphic above suggests, these are based on individual seasons according to Player Value. The question we want to ask here is which version of a player would we want on our team? I want to give guys that only played a few seasons with a team an equal chance at making the lineup as the guys that spent their entire careers with one team. I will remind everyone that I currently only have Player Value since 1912. Ty Cobb still makes the all-time Tigers lineup with his 1917 season, but he also played 7 years prior to 1912, leading the league in OPS in 5 of them. By WAR, 1917 is his best season at 11.3, but his 1909-1911 seasons are all around 10+ WAR, so it's possible that his best season by Player Value would be before 1912, and I just don't have that captured yet. Note that Hank Greenberg in 1940 actually had the best Tiger season by a LF, but I didn't want to have any duplicate players on the all-time team. Greenberg as a 1B in 1937 added more value than Norm Cash as a 1B in 1961 did than Greenberg as a LF in 1940 added over Rocky Colavito as a LF in 1961; thus, Greenberg was kept at 1B and Colavito was inserted in at LF. All-Time Team Total Player Value: 869.5564 (4th in AL, 6th in MLB)
All-Time Team Pitching Value: 189.8862 (12th in AL, 22nd in MLB) All-Time Team Fielding Value: 214.8161 (6th in AL, 8th in MLB) All-Time Team Baserunning Value: -11.5429 (15th in AL, 30th in MLB) The All-Time Tigers are one of the better teams in history, and really lack any weak areas. Their worst piece is their baserunning, but that's the smallest portion of Player Value and almost all of that comes from Donie Bush's -9 Player Value in 1914. He stole 35 bases but was caught 26 times and in case you haven't heard, getting caught stealing is far worse than the gain of stealing a base. Besides that, basically all of the Tigers areas are in the top 10. They rank 22nd in pitching but their pitchers overall rank 9th, meaning their pitchers were good at fielding and batting. Their outfield consists of 2 Hall of Famers, their infield consists of 1 Hall of Famer and a future Hall of Famer in Miggy, and their C/1B/DH consists of a Hall of Famer, someone who should be in the Hall of Fame in Freehan, and another potential (albeit much less likely) future Hall of Famer in Martinez. Here is how the players on the all-time team compare in terms of their Player Value components:  The team is led by Gehringer and Cobb with 94 and 81 Player Value seasons, respectively. View the file below to see the numerical values of the Player Value components for each player on the all-time team:
View the files below to see the Player Value components, hypothetical awards based on Player Value, and general statistics for each player season and position (if you're wondering how another player that isn't on the all-time team fares, this is the place to look):
And that's it! I'm trying to make these posts shorter and just focus on sharing the all-time teams themselves and necessary data files. If you want to investigate an individual season for a player on the all-time team, I encourage you to check out their page on Baseball Reference.
0 Comments
 In this post I will list out the All-Time Kansas City Royals lineup, according to Player Value. I will follow along the same format as MLB uses with its new "All-MLB" teams, which you can view here. That format is 1 player for each defensive position, 5 starters, and 2 relievers. I will only use DHs for AL teams, since most NL teams don't have enough seasons with the DH to really have a deserving player. If you're a Kansas City baseball fan and feel any allegiance to the Kansas City Athletics for some reason, you can check out their all-time team here. Their last season in Kansas City was 1967, just before the Royals began play. Importantly, and as the graphic above suggests, these are based on individual seasons according to Player Value. The question we want to ask here is which version of a player would we want on our team? I want to give guys that only played a few seasons with a team an equal chance at making the lineup as the guys that spent their entire careers with one team. Ok, maybe you're wondering why Frank White isn't at 2B. He had the 3rd, 5th-8th, and 10th-12th best Player Value seasons at 2B in Royals history. His best year was 1984, when he put up 41 Player Value. WAR agrees that 1984 was his best season and has him at 4.1 WAR. WAR also gives Whit Merrifield in 2018 the edge, rating him at 4.5. Across their entire Royals careers, nobody has more Player Value at 2B than White does; Merrifield just happens to have had a better single season. All-Time Team Total Player Value: 703.6933 (11th in AL, 20th in MLB)
All-Time Team Pitching Value: 238.6621 (6th in AL, 7th in MLB) All-Time Team Fielding Value: 231.3285 (2nd in AL, 6th in MLB) All-Time Team Baserunning Value: 16.7935 (1st in AL, 1st in MLB) The All-Time Royals are towards the bottom of the all-time teams across all MLB franchises. They are uniquely specialized, ranking as the best baserunning team and one of the best pitching and fielding teams, but also as one of the worst batting teams. Willie Wilson and Carlos Beltran lead the charge for baserunning - Wilson ranks 4th in Baserunning Value among LF in history, while Beltran ranks 6th in Baserunning Value among CF in history. Wilson stole 79 bases in 1980 and was caught 10 times, while Beltran stole 41 bases in 2003 and was caught 4 times. Those are 89% and 91% clips. Freddie Patek and Wilson lead the charge for fielding. Wilson ranks 2nd in Fielding Value among LF in history, and posted 24 Rfield in 1980 along with an above average fielding percentage (.983 vs .980) and range factor (3.04 vs 2.35) for his position. Patek is not an all-time great SS, but he does rank 8th in Baserunning Value among SS in history. The same defensive metrics I used for Wilson also show that Patek was a good fielder in 1973. The Royals just lack solid hitting, outside of Brett. Mayberry, Beltran, McRae, and Perez have decent Batting Values, but everyone else is fairly lackluster. For corner outfielders, Wilson's and Dye's Batting Values are particularly unimpressive. Here is how the players on the all-time team compare in terms of their Player Value components:  The team is led primarily by George Brett's stellar 79 Player Value season in 1980, when he won the AL MVP and led the league in every triple-slash-line category, and thus OPS as well. View the file below to see the numerical values of the Player Value components for each player on the all-time team:
View the files below to see the Player Value components, hypothetical awards based on Player Value, and general statistics for each player season and position (if you're wondering how another player that isn't on the all-time team fares, this is the place to look):
And that's it! I'm trying to make these posts shorter and just focus on sharing the all-time teams themselves and necessary data files. If you want to investigate an individual season for a player on the all-time team, I encourage you to check out their page on Baseball Reference.
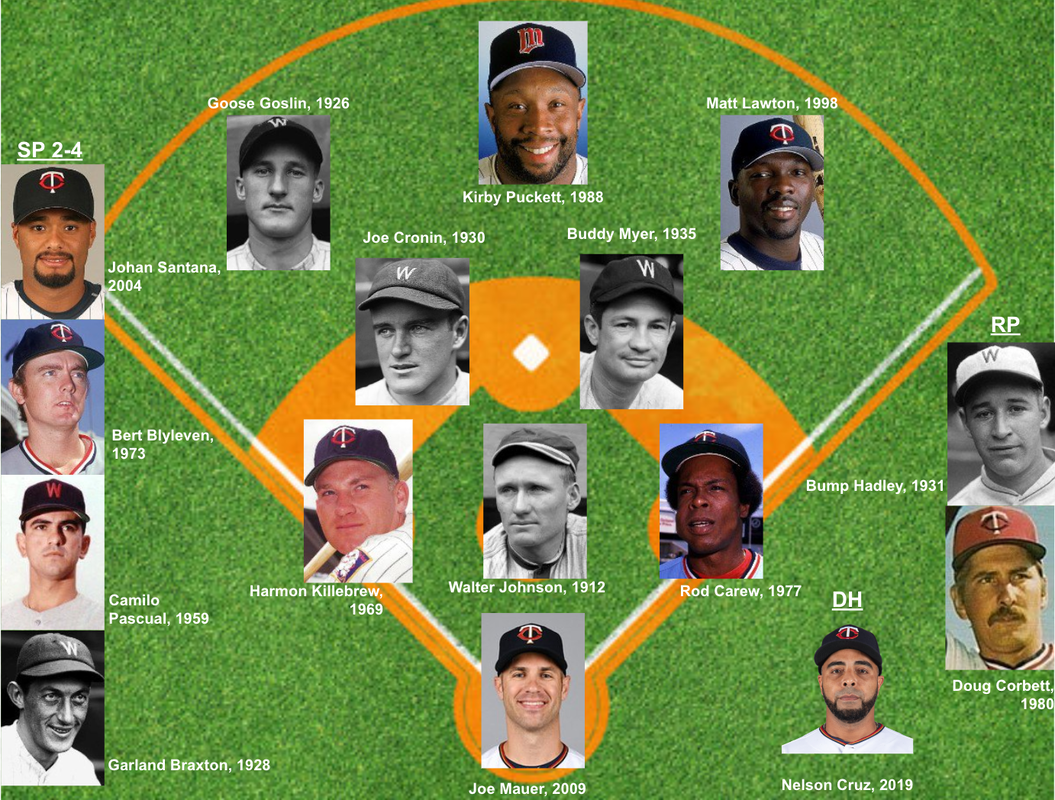
 In this post I will list out the All-Time Washington Senators lineup, according to Player Value. I will follow along the same format as MLB uses with its new "All-MLB" teams, which you can view here. That format is 1 player for each defensive position, 5 starters, and 2 relievers. I will only use DHs for AL teams, since most NL teams don't have enough seasons with the DH to really have a deserving player. Note that this includes all seasons that the Senators played in Washington that I have Player Value for, meaning as part of the Twins franchise from 1912-1960 and as part of the Rangers franchise from 1961-1971. Interestingly enough, no Senator players from the Rangers portion actually made the all-time team. The best Senators position player not on the all-time from the Rangers portion is 3B Ken McMullen in 1969, with 46.76 Player Value. Other position players toward the top are Chuck Cottier at 2B in 1962, Mike Epstein at 1B in 1969, Ed Brinkman at SS in 1970, and Frank Howard at LF in 1970. The best Senators pitchers not on the all-time team from the Rangers portion are a bunch of dicks. Starters Dick Bosman in 1969 and Dick Donovan in in 1961, as well as reliever Dick Lines in 1966. Note that technically they were called the Nationals from 1905-1955, but I only have Player Value going back to 1912 and the team was commonly referred to (including by the fans and by Baseball Reference) as the Senators during that timeframe. They were officially the Washington Senators from 1901-1904 and from 1956-1960. I didn't think it made sense to have a Twins-specific Senators team and a Rangers-specific Senators team, since the city of Washington had a singular Senators team consistently from 1912-1971. Importantly, and as the graphic above suggests, these are based on individual seasons according to Player Value. The question we want to ask here is which version of a player would we want on our team? I want to give guys that only played a few seasons with a team an equal chance at making the lineup as the guys that spent their entire careers with one team. Note that Bump Hadley in 1930 actually had the 5th best SP season by a unique pitcher, but I didn't want to have any duplicate players on the all-time team. Hadley as a RP in 1931 added more value over Ad Liska as a RP in 1930 than Hadley as a SP in 1930 did over Dutch Leonard as a SP in 1938; thus, Hadley stayed as a RP and Leonard was slotted in as the 5th SP. Here is how the players on the all-time team compare in terms of their Player Value components:  The team is led primarily by Walter Johnson's and Buddy Myer's incredible 90+ Player Value seasons. Joe Cronin is also towards the top with an 80+ Player value season. View the file below to see the numerical values of the Player Value components for each player on the all-time team:
View the files below to see the Player Value components, hypothetical awards based on Player Value, and general statistics for each player season and position (if you're wondering how another player that isn't on the all-time team fares, this is the place to look):
And that's it! I'm trying to make these posts shorter and just focus on sharing the all-time teams themselves and necessary data files. If you want to investigate an individual season for a player on the all-time team, I encourage you to check out their page on Baseball Reference.
 In this post I will list out the All-Time Minnesota Twins lineup, according to Player Value. I will follow along the same format as MLB uses with its new "All-MLB" teams, which you can view here. That format is 1 player for each defensive position, 5 starters, and 2 relievers. I will only use DHs for AL teams, since most NL teams don't have enough seasons with the DH to really have a deserving player. Importantly, and as the graphic above suggests, these are based on individual seasons according to Player Value. The question we want to ask here is which version of a player would we want on our team? I want to give guys that only played a few seasons with a team an equal chance at making the lineup as the guys that spent their entire careers with one team. Note that Rod Carew in 1973, 1975, and 1974 actually had the top three 2B seasons, but I didn't want to have any duplicate players on the all-time team. Carew at 1B in 1977 added more value over Bob Allison at 1B in 1964 than Carew at 2B in 1973 did over Chuck Knoblauch at 2B in 1996; thus, Carew stayed at 1B and Knoblauch was slotted in at 2B. Here is how the players on the all-time team compare in terms of their Player Value components:  The team is led primarily by Rod Carew's stellar 85 Player Value season in 1977 when he won the MVP, as well as by Roy Smalley in 1979, when he produced 73 Player Value. View the file below to see the numerical values of the Player Value components for each player on the all-time team:
View the files below to see the Player Value components, hypothetical awards based on Player Value, and general statistics for each player season and position (if you're wondering how another player that isn't on the all-time team fares, this is the place to look):
And that's it! I'm trying to make these posts shorter and just focus on sharing the all-time teams themselves and necessary data files. If you want to investigate an individual season for a player on the all-time team, I encourage you to check out their page on Baseball Reference.
 In this post I will list out the All-Time Twins franchise lineup, according to Player Value. I will follow along the same format as MLB uses with its new "All-MLB" teams, which you can view here. That format is 1 player for each defensive position, 5 starters, and 2 relievers. I will only use DHs for AL teams, since most NL teams don't have enough seasons with the DH to really have a deserving player. Note that this includes all seasons of the Twins franchise, meaning as the Washington Senators from 1912-1960 and as the Minnesota Twins from 1961 to present. You can view the all-time Minnesota Twins team here. You can view the all-time Washington Senators here. Note that this post includes all years that the Senators were in Washington. That means as a part of the Twins franchise from 1912-1960, and as part Rangers franchise from 1961-1971. They technically were called the Nationals from 1905-1955, but I only have Player Value going back to 1912 and the team was commonly referred to (including by the fans and by Baseball Reference) as the Senators during that timeframe. They were officially the Washington Senators from 1901-1904 and from 1956-1960. I didn't think it made sense to have a Twins-specific Senators team and a Rangers-specific Senators team, since the city of Washington had a singular Senators team consistently from 1912-1971. Importantly, and as the graphic above suggests, these are based on individual seasons according to Player Value. The question we want to ask here is which version of a player would we want on our team? I want to give guys that only played a few seasons with a team an equal chance at making the lineup as the guys that spent their entire careers with one team. All-Time Team Total Player Value: 889.1084 (3rd in AL, 5th in MLB)
All-Time Team Pitching Value: 286.1861 (2nd in AL, 2nd in MLB) All-Time Team Fielding Value: 222.9137 (4th in AL, 7th in MLB) All-Time Team Baserunning Value: -7.3187 (12th in AL, 27th in MLB) The All-Time Twins are one of the best teams in history. Unlike most of the other teams towards the top, that hasn't contributed as much success. The Twins have won 3 World Series and 6 pennants. By comparison, the Giants all-time team ranks 3rd and they've won 8 World Series and 23 pennants. They Dodgers all-time team ranks 4th and they've won 7 World Series and 24 pennants. The Athletics all-time team ranks 7th and they've won 9 World Series and 15 pennants. You get the idea - the Twins franchise has racked up some solid players but haven't had enough of them at the same time. Their worst area is their baserunning, which is the smallest piece of Player Value so not as big of a deal. Their next worst area is their outfield, which still only ranks slightly below average. Their pitching and infield all rank extremely well. Their starting rotation consists of the 1st, 29th, and 31st best pitchers since 1912 in Johnson, Santana, and Blyleven. Here is how the players on the all-time team compare in terms of their Player Value components: 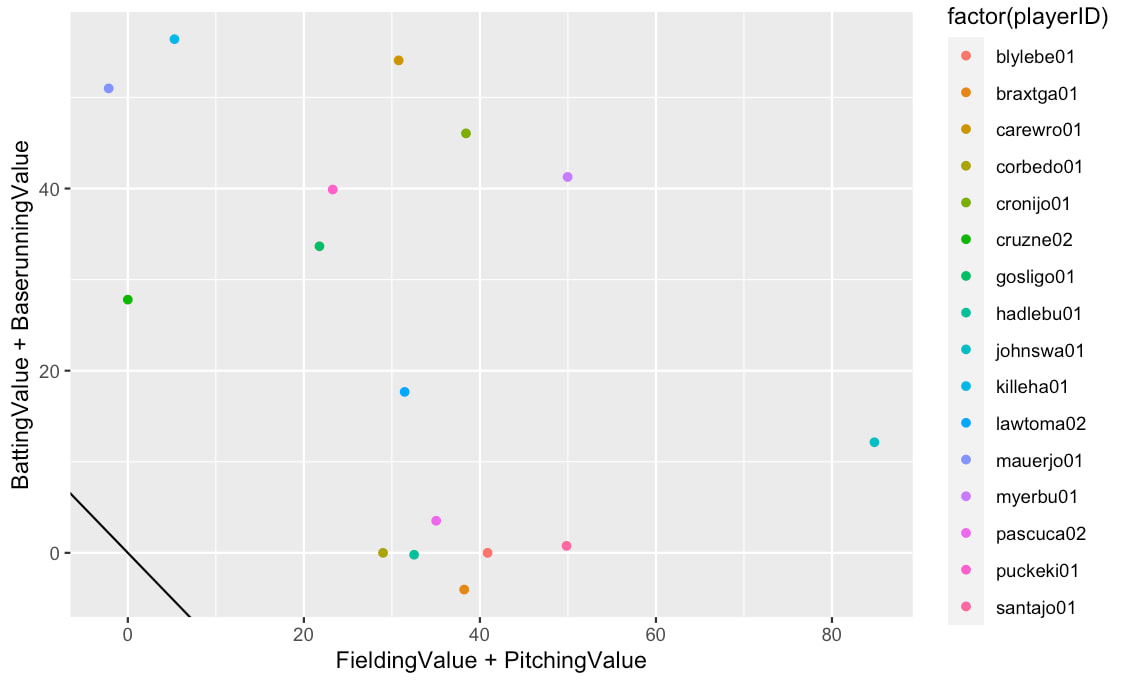 The team is led primarily by Walter Johnson's and Buddy Myer's incredible 90+ Player Value seasons. Rod Carew and Joe Cronin are also towards the top with 80+ Player value seasons. Johnson's season is probably the most impressive, as it is extremely rare for a pitcher to accrue that Player Value. In fact, Johnson's 1912 season ranks as the highest Player Value for a pitcher in the entire span from 1912-2021. His 1913 season ranks 2nd, then Smoky Joe Wood's 1912, Ed Walsh's 1912, Pete Alexander's 1915, Walter Johnson's 1914, Pedro Martinez in 2000, Sandy Koufax in 1965, Babe Ruth in 1916, and Greg Maddux in 1998. If you rely instead on Pitching Value rather than total Player Value by pitchers, Pedro Martinez in 1999, Roger Clemens in 1997, Walter Johnson in 1919, and Greg Maddux in 1995 rank towards the top. WAR agrees with the dominance of these pitchers too. Maddux had 9.7 WAR in 1995, Clemens had 11.9 in 1997, Pedro had 9.8 in 1999 and 11.7 in 2000, Koufax had 8.1 in 1965, Walsh had 11.4 in 1912, Wood had 10.1 in 1912. Walter Johnson had 10.6 WAR in 1919, 11.7 in 1914, 15.1 in 1913, and 13.2 in 1912. It is clear that the early 1900s and the late 1900s were the zenith of pitching dominance, and Walter Johnson is the king of that hill. There's a reason he is the greatest pitcher of all-time according to Player Value, so the Twins all-time team are fortunate to have him on their squad. On another note, Johan Santana's 2004 season also ranks as the 15th best season by Pitching Value. View the file below to see the numerical values of the Player Value components for each player on the all-time team:
View the files below to see the Player Value components, hypothetical awards based on Player Value, and general statistics for each player season and position (if you're wondering how another player that isn't on the all-time team fares, this is the place to look):
And that's it! I'm trying to make these posts shorter and just focus on sharing the all-time teams themselves and necessary data files. If you want to investigate an individual season for a player on the all-time team, I encourage you to check out their page on Baseball Reference.
 In this post I will list out the All-Time Texas Rangers lineup, according to Player Value. I will follow along the same format as MLB uses with its new "All-MLB" teams, which you can view here. That format is 1 player for each defensive position, 5 starters, and 2 relievers. I will only use DHs for AL teams, since most NL teams don't have enough seasons with the DH to really have a deserving player. Importantly, and as the graphic above suggests, these are based on individual seasons according to Player Value. The question we want to ask here is which version of a player would we want on our team? I want to give guys that only played a few seasons with a team an equal chance at making the lineup as the guys that spent their entire careers with one team. Note that Josh Hamilton in 2008 actually had the top CF season, but I didn't want to have any duplicate players on the all-time team. Hamilton in LF in 2010 added more value over Juan Gonzalez in LF in 1993 than Hamilton in CF in 2008 did over Gary Matthews in CF in 2006; thus, Hamilton stayed in LF and Matthews was slotted in at CF. Similarly, Rafael Palmeiro in 1993 also had the actual top 1B season. However, Palmeiro at DH in 1999 added more value over Milton Bradley at DH in 2008 than Palmeiro at 1B in 1993 did over Mark Teixeira at 1B in 2005; thus, Palmeiro stayed at DH and Teixeira was inserted at 1B. You are probably wondering, where is Pudge?! Ivan Rodriguez has the 2nd, 3rd, 4th, 5th, 7th, 9th, 11th, 14th, and 15th best individual Player Value seasons among catchers in Rangers history. Jim Sundberg has the 6th, 8th, and 10th best Player Value seasons among Rangers catchers. Darrel Porter and Geno Petralli sit at 12th and 13th. Mike Napoli just happens to have the best individual season by a catcher. Pudge's best season by Player Value was 1999, with 33.71 Player Value. Napoli's 2011 is slightly higher at 37.93 Player Value. WAR does not quite agree; it has Napoli's 2011 at 5.5 WAR and Pudge's 1999 at 6.4 WAR, but that difference is not substantial. WAR does agree that Napoli had the better offensive season than Pudge. I imagine Player Value is probably underselling Pudge's defensive value, and hopefully the next iteration will give us more clarity. Across their careers as Rangers, Ivan Rodriguez is clearly the best catcher, with 215.32 Player Value. Sundberg is 2nd with 46.85 Player Value, and Napoli is 3rd with 36.27 Player Value. Here is how the players on the all-time team compare in terms of their Player Value components:  The team is led primarily by A-Rod's incredible 95 Player Value season. The next group of players toward the top are Bell, Kinsler, and Hamilton, each with a 60+ Player Value season. View the file below to see the numerical values of the Player Value components for each player on the all-time team:
View the files below to see the Player Value components, hypothetical awards based on Player Value, and general statistics for each player season and position (if you're wondering how another player that isn't on the all-time team fares, this is the place to look):
And that's it! I'm trying to make these posts shorter and just focus on sharing the all-time teams themselves and necessary data files. If you want to investigate an individual season for a player on the all-time team, I encourage you to check out their page on Baseball Reference.
 In this post I will list out the All-Time Rangers franchise lineup, according to Player Value. I will follow along the same format as MLB uses with its new "All-MLB" teams, which you can view here. That format is 1 player for each defensive position, 5 starters, and 2 relievers. I will only use DHs for AL teams, since most NL teams don't have enough seasons with the DH to really have a deserving player. Note that this includes all seasons of the Rangers franchise, meaning as the Washington Senators from 1961-1971 and as the Texas Rangers from 1972 to present. However, as the above image shows, no Washington Senators players actually made the all-time team. The best Senators position player not on the all-time is 3B Ken McMullen in 1969, with 46.76 Player Value. Other position players toward the top are Chuck Cottier at 2B in 1962, Mike Epstein at 1B in 1969, Ed Brinkman at SS in 1970, and Frank Howard at LF in 1970. The best Senators pitchers not on the all-time team are a bunch of dicks. Starters Dick Bosman in 1969 and Dick Donovan in in 1961, as well as reliever Dick Lines in 1966. You can view the all-time Texas Rangers team here. It is the exact same as that shown above, but the attached files in this post do a better job at showing how the players compare solely among their Texas Ranger counterparts. You can view the all-time Washington Senators here. Note that this post includes all years that the Senators were in Washington. That means as a part of the Rangers franchise from 1961-1971, and as part of the Twins franchise from 1912-1960. They technically were called the Nationals from 1905-1955, but I only have Player Value going back to 1912 and the team was commonly referred to (including by the fans and by Baseball Reference) as the Senators during that timeframe. They were officially the Washington Senators from 1901-1904 and from 1956-1960. I didn't think it made sense to have a Twins-specific Senators team and a Rangers-specific Senators team, since the city of Washington had a singular Senators team consistently from 1912-1971. Importantly, and as the graphic above suggests, these are based on individual seasons according to Player Value. The question we want to ask here is which version of a player would we want on our team? I want to give guys that only played a few seasons with a team an equal chance at making the lineup as the guys that spent their entire careers with one team. Note that Josh Hamilton in 2008 actually had the top CF season, but I didn't want to have any duplicate players on the all-time team. Hamilton in LF in 2010 added more value over Juan Gonzalez in LF in 1993 than Hamilton in CF in 2008 did over Gary Matthews in CF in 2006; thus, Hamilton stayed in LF and Matthews was slotted in at CF. Similarly, Rafael Palmeiro in 1993 also had the actual top 1B season. However, Palmeiro at DH in 1999 added more value over Milton Bradley at DH in 2008 than Palmeiro at 1B in 1993 did over Mark Teixeira at 1B in 2005; thus, Palmeiro stayed at DH and Teixeira was inserted at 1B. You are probably wondering, where is Pudge?! Ivan Rodriguez has the 2nd, 3rd, 4th, 5th, 7th, 9th, 11th, 14th, and 15th best individual Player Value seasons among catchers in Rangers history. Jim Sundberg has the 6th, 8th, and 10th best Player Value seasons among Rangers catchers. Darrel Porter and Geno Petralli sit at 12th and 13th. Mike Napoli just happens to have the best individual season by a catcher. Pudge's best season by Player Value was 1999, with 33.71 Player Value. Napoli's 2011 is slightly higher at 37.93 Player Value. WAR does not quite agree; it has Napoli's 2011 at 5.5 WAR and Pudge's 1999 at 6.4 WAR, but that difference is not substantial. WAR does agree that Napoli had the better offensive season than Pudge. I imagine Player Value is probably underselling Pudge's defensive value, and hopefully the next iteration will give us more clarity. Across their careers as Rangers, Ivan Rodriguez is clearly the best catcher, with 215.32 Player Value. Sundberg is 2nd with 46.85 Player Value, and Napoli is 3rd with 36.27 Player Value. All-Time Team Total Player Value: 671.7897 (14th in AL, 24th in MLB)
All-Time Team Pitching Value: 189.0351 (13th in AL, 23rd in MLB) All-Time Team Fielding Value: 170.3145 (12th in AL, 22nd in MLB) All-Time Team Baserunning Value: 3.0243 (7th in AL, 14th in MLB) The All-Time Rangers fall towards the bottom of the other all-time teams. Their best areas are their relievers, infield, and baserunning. All 3 of their infielders (not including first base) have 60+ Player Value seasons. Their worst areas are their outfield and starters. Here is how the players on the all-time team compare in terms of their Player Value components:  The team is led primarily by A-Rod's incredible 95 Player Value season. The next group of players toward the top are Bell, Kinsler, and Hamilton, each with a 60+ Player Value season. View the file below to see the numerical values of the Player Value components for each player on the all-time team:
View the files below to see the Player Value components, hypothetical awards based on Player Value, and general statistics for each player season and position (if you're wondering how another player that isn't on the all-time team fares, this is the place to look):
And that's it! I'm trying to make these posts shorter and just focus on sharing the all-time teams themselves and necessary data files. If you want to investigate an individual season for a player on the all-time team, I encourage you to check out their page on Baseball Reference.
 In this post I will list out the All-Time Angels lineup, according to Player Value. I will follow along the same format as MLB uses with its new "All-MLB" teams, which you can view here. That format is 1 player for each defensive position, 5 starters, and 2 relievers. I will only use DHs for AL teams, since most NL teams don't have enough seasons with the DH to really have a deserving player. Note that this includes all seasons of the Angels franchise while located in the greater Los Angeles area. They were the Los Angeles Angels from 1961-1965 and have resumed using that name since 2016. They changed their name to the California Angels in the middle of the 1965 season and went by that name until 1996. They were the Anaheim Angels from 1997 to 2004 and then the Los Angeles Angel of Anaheim from 2005 to 2015. Importantly, and as the graphic above suggests, these are based on individual seasons according to Player Value. The question we want to ask here is which version of a player would we want on our team? I want to give guys that only played a few seasons with a team an equal chance at making the lineup as the guys that spent their entire careers with one team. All-Time Team Total Player Value: 702.9314 (12th in AL, 18th in MLB)
All-Time Team Pitching Value: 238.8077 (5th in AL, 6th in MLB) All-Time Team Fielding Value: 158.1529 (13th in AL, 23rd in MLB) All-Time Team Baserunning Value: -0.6772 (9th in AL, 24th in MLB) The All-Time Angels are pretty middle of the pack. Their worst area is their C/1B/DH unit. Despite many people regarding Pujols' stint with the Angels as a disappointment, he still put up the best season at 1B in their history. Their strong areas are their pitching and their outfield. Unfortunately, my favorite player Vladimir Guerrero did not get to be among the Angels in the outfield, as Tim Salmon rated higher. As indicated by the Angels being 5th in Pitching Value but just 11th in terms of pitchers overall, their pitchers weren't stellar batter or fielders. Here is how the players on the all-time team compare in terms of their Player Value components:  The team is led mainly by Trout's 76 Player Value season, as well as by 60+ Player Value seasons from DeCinces and Salmon. View the file below to see the numerical values of the Player Value components for each player on the all-time team:
View the files below to see the Player Value components, hypothetical awards based on Player Value, and general statistics for each player season and position (if you're wondering how another player that isn't on the all-time team fares, this is the place to look):
And that's it! I'm trying to make these posts shorter and just focus on sharing the all-time teams themselves and necessary data files. If you want to investigate an individual season for a player on the all-time team, I encourage you to check out their page on Baseball Reference.
 In this post I will list out the All-Time Houston Astros lineup, according to Player Value. I will follow along the same format as MLB uses with its new "All-MLB" teams, which you can view here. That format is 1 player for each defensive position, 5 starters, and 2 relievers. I will only use DHs for AL teams, since most NL teams don't have enough seasons with the DH to really have a deserving player. Note that this includes all seasons of the Astros franchise while located in Houston, meaning the Houston Colt .45s from 1962-1964, and the Houston Astros from 1965 to present. However, no players from the Colt .45 years actually made the all-time team. Importantly, and as the graphic above suggests, these are based on individual seasons according to Player Value. The question we want to ask here is which version of a player would we want on our team? I want to give guys that only played a few seasons with a team an equal chance at making the lineup as the guys that spent their entire careers with one team. The list of possible DHs for the Astros is lower, since they did not begin play in the AL until 2013. The DH was first used by the AL in 1973, so the Astros are at a 40 year disadvantage. Alvarez was great in 2019 though, and arguably his 2022 season was even better, so the Astros still don't even have the worst DH among the AL all-time teams. All-Time Team Total Player Value: 766.2128 (9th in AL, 16th in MLB)
All-Time Team Pitching Value: 256.8277 (3rd in AL, 3rd in MLB) All-Time Team Fielding Value: 153.4463 (14th in AL, 24th in MLB) All-Time Team Baserunning Value: 6.1374 (3rd in AL, 9th in MLB) The All-Time Astros are pretty middle of the pack. Their worst area is their fielding, ranking as the 6th worst. They don't have any players with absurdly negative Fielding Values, but none of their players have excessively high Fielding Values either. Their best area is their pitching, ranking as the 3rd best. All 5 of their starters have at least 40+ Player Value, a pretty rare feat. Mike Scott is one of just 5 pitchers to deserve to win the MVP according to Player Value, along with Walter Johnson, Pete Alexander, Sandy Koufax, and Greg Maddux. He came 10th in reality in 1986, but did win the Cy Young and led the league with 8.4 WAR. Keuchal and Cole had about 6.5 WAR in their seasons, while Clemens and Verlander had about 7.5 WAR. Here is how the players on the all-time team compare in terms of their Player Value components:  The team is led primarily by Craig Biggio's incredible 98 Player Value season, but Hidalgo and Bagwell also lead the way with 73 and 68 Player Value seasons, respectively. View the file below to see the numerical values of the Player Value components for each player on the all-time team:
View the files below to see the Player Value components, hypothetical awards based on Player Value, and general statistics for each player season and position (if you're wondering how another player that isn't on the all-time team fares, this is the place to look):
And that's it! I'm trying to make these posts shorter and just focus on sharing the all-time teams themselves and necessary data files. If you want to investigate an individual season for a player on the all-time team, I encourage you to check out their page on Baseball Reference.
 In this post I will list out the All-Time Seattle Mariners lineup, according to Player Value. I will follow along the same format as MLB uses with its new "All-MLB" teams, which you can view here. That format is 1 player for each defensive position, 5 starters, and 2 relievers. I will only use DHs for AL teams, since most NL teams don't have enough seasons with the DH to really have a deserving player. Importantly, and as the graphic above suggests, these are based on individual seasons according to Player Value. The question we want to ask here is which version of a player would we want on our team? I want to give guys that only played a few seasons with a team an equal chance at making the lineup as the guys that spent their entire careers with one team. All-Time Team Total Player Value: 673.109 (13th in AL, 23rd in MLB)
All-Time Team Pitching Value: 194.302 (11th in AL, 21st in MLB) All-Time Team Fielding Value: 175.3606 (11th in AL, 29th in MLB) All-Time Team Baserunning Value: 4.5582 (4th in AL, 12th in MLB) The All-Time Mariners are towards the bottom of the all-time teams in history. They are one of the newer franchises, however, as only 4 teams are younger and the Blue Jays also began playing in 1977. Their worst area are their fielding, their bullpen, and their C/1B/DH unit. Edgar Martinez ranks as the best primarily DH in history via Player Value, but he's at 3B for our all-time team. Their best area is their baserunning, but that's the smallest component of Player Value. I'll make an aside that the late 1990s and early 2000s Mariners awe me. In 1997 they had Randy Johnson, Alex Rodriguez, Edgar Martinez, and Ken Griffey Jr. all on the same team. That's 3 Hall of Famers and another guy that would be in if not for steroids, though he's still on the ballot so his case is technically TBD. Each of those guys had an incredible seasons of 5+ WAR, and while the team was good - they went 90-72 and won the AL West - they still lost pretty handedly in the ALDS to Orioles. Not what you would expect from such a loaded lineup. It's not like the rest of the team was garbage either; Jeff Fassero and Jamie Moyer also had basically 4 WAR seasons, and Jay Buhner had 3.3 WAR and hit 40 HR. Then later they lose Johnson, but still in 1999 have Junior, A-Rod, and Edgar, each with about 5 WAR. They go 79-83 and finish 3rd in the AL West. Then they lose Junior, but still have A-Rod and Edgar in 2000, who put up basically 10 WAR and 6 WAR. Team does well in regular season - going 91-71 and finishing 2nd in the AL West - and stellar in the postseason, advancing to the ALCS. But then they lose A-Rod, and Edgar is now 38, but somehow they go a whopping 116-46 and again go to the ALCS. Because now they have the MVP and RoY Ichiro and a stellar (but juiced) season from Bret Boone. It's amazing how what seemed like such a dynasty never actually won a title, and I wonder what a team with Johnson, Rodriguez, Griffey, Martinez, and Suzuki would have looked like. Here is how the players on the all-time team compare in terms of their Player Value components:  The team is led primarily by A-Rod, with an incredible 91 Player Value season, as well as by The Kid, with an impressive 75 Player Value season. View the file below to see the numerical values of the Player Value components for each player on the all-time team:
View the files below to see the Player Value components, hypothetical awards based on Player Value, and general statistics for each player season and position (if you're wondering how another player that isn't on the all-time team fares, this is the place to look):
And that's it! I'm trying to make these posts shorter and just focus on sharing the all-time teams themselves and necessary data files. If you want to investigate an individual season for a player on the all-time team, I encourage you to check out their page on Baseball Reference.
|
|||||||||||||||||||||||||||||||||||||||||||||||||||||||||||||||||||||||||||||||||||||||||||||||||||||||||||||||||||||||||||||||||||||||||||||||||||||||||||||||||||||||||||||||||||||||||||||||||||||||||||||||||||||||||||||||||||||||||||||||||
