|
Well, by "all-time", I really mean from 1912-2021, as that is currently the span of years that I have the data for. As the headline suggests, these rankings are according to my Player Value metric as of the date listed above. You can read my initial Player Value post here and its addendum here. Since then I have used Retrosheet play by play data to better fine tune the run value weights of the various events, but haven't been able to write up a post detailing them yet. Rather than listing them out again in this post, you can view them towards the top of my latest Hall of Fame post here. When we're discussing positional rankings, there's a couple of ways we can decide what a player's primary position was. One approach is to do it based on games played, which is the easiest but results in guys like Pete Rose and Ernie Banks being first basemen. I instead elected to take the approach of using the position that a player accumulated the most Player Value at. This way, Rose is a left fielder and Banks is a shortstop. I still list out their main position by games played in the data files below, but that's not what I went off of. There's also the matter of if we should take a player's total Player Value for their career and then just group them by their main position, or should we only use the Player Value that a player accumulated at this specific position. This choice is a little trickier, so I've gone ahead and listed out the top rankings for each option. I've already detailed the more specific leftfield, centerfield, and rightfield rankings. You may be wondering how guys across the outfield positions stack up, so this post serves that purpose. I'll also include guys that provided a lot of value at different OF positions, but that primarily may not have been a specific OF position, like Stan Musial. He was more of 1B than a LF or RF, but if we combine his LF and RF value and games we see that he was more of an OF than a 1B. Given that I've already explained the LF, CF, and RF rankings, this post will almost solely by lists and graphs - no explanations. Since there are more OF guys than specific LF/CF/RF guys, I will do top 50 lists instead. So, without further adieu: Top 50 Outfielders From 1912-2021, Based On Total Player Value At All Positions
Top 50 Outfielders From 1912-2021, Based On Total Player Value As An Outfielder
Top 50 Outfielders From 1912-2021, Based On Batting Value At All Positions
Top 50 Outfielders From 1912-2021, Based On Fielding Value At All Positions
Top 25 Outfielders From 1912-2021, Based On Baserunning Value At All Positions
From the span of 1912-2021, I have just 1,798 players that contributed most of their value as outfielders. There are 8,646 total position players in this span. If you go based off of games played, however, there are 3,163 outfielders in this span. This makes sense, as any outfielders that were negative for their careers would have been assigned to a different position, based on value. So to be in the top 1%, a player would have to be among the top 31-32 outfielders during this span. To be in the top 1.18% (the general Hall of Fame mark), a player would have to be among the top 37-38 outfielders during this span. If we look at the top 37 outfielders according to Player Value, 25 of them are in Cooperstown. Of the 3,163 outfielders in my dataset based off of games played, 61 are in the Hall of Fame. That's 1.93%, larger than the "top 1%" idea that many people think of the Hall of Fame as, as well as the top 1.18% that the Hall actually operates at. That 61 does include guys that may have been mainly outfielders during their player careers, but were inducted for other reasons, such as Dick Williams, Whitey Herzog, and Billy Southworth as managers, Clark Griffith as a pioneer, or Jocko Conlan as an umpire. Below you can graphically see how all of our outfielders compare in terms of Player Value, along with the black line denoting which players provided positive value, the gold line denoting the Hall of Fame mark, and the blue dots denoting the actual Hall of Fame members:  Below you can graphically see how the top 25 outfielders compare in terms of Player Value: 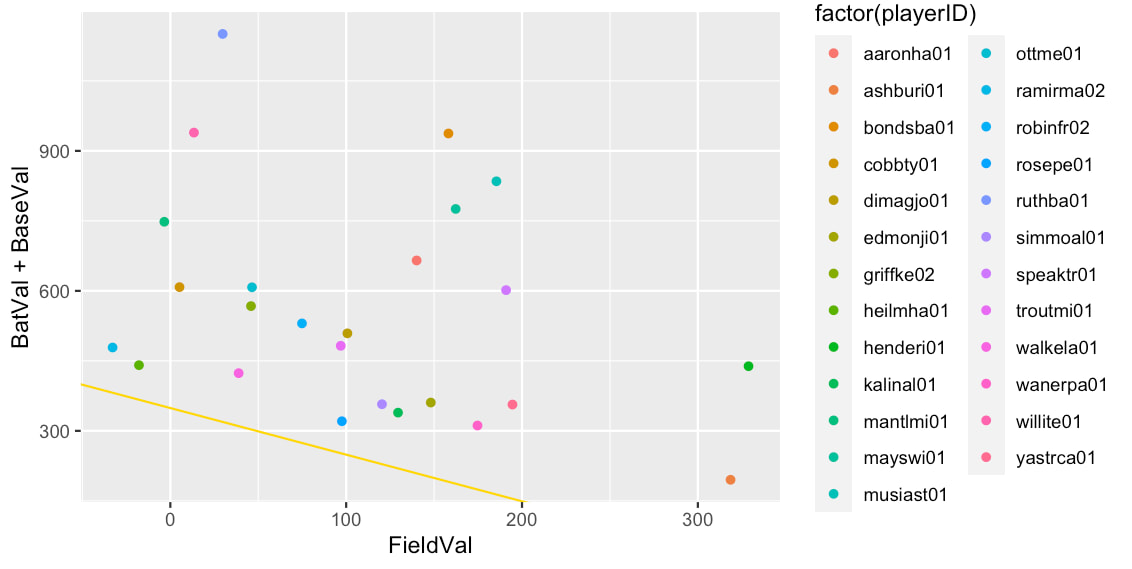 Below you can graphically see how the top 26-50 outfielders compare in terms of Player Value:  Below is the dataset of primarily outfielders from 1912-2021, as determined by which position the player provided the most Player Value at. There are 1,798 players in this dataset.
Below is the dataset of primarily outfielders from 1912-2021, as determined by which position the player played the most games at. There are 3,163 players in this dataset.
Thanks for checking out this outfield rankings post. I plan to update it whenever I develop new Player Value iterations, and hopefully we'll get closer and closer to some rankings that we can more firmly support.
Statting Lineup Newsletter Signup Form: If you'd like to receive email updates for each new post that I make, sign up for the Statting Lineup newsletter using the link below: https://weebly.us18.list-manage.com/subscribe?u=ab653f474b2ced9091eb248b1&id=3a60f3b85f The information used here was obtained free of charge from and is copyrighted by Retrosheet. Interested parties may contact Retrosheet at 20 Sunset Rd., Newark, DE 19711.
0 Comments
Well, by "all-time", I really mean from 1912-2021, as that is currently the span of years that I have the data for. As the headline suggests, these rankings are according to my Player Value metric as of the date listed above. You can read my initial Player Value post here and its addendum here. Since then I have used Retrosheet play by play data to better fine tune the run value weights of the various events, but haven't been able to write up a post detailing them yet. Rather than listing them out again in this post, you can view them towards the top of my latest Hall of Fame post here. When we're discussing positional rankings, there's a couple of ways we can decide what a player's primary position was. For pitchers, this is fortunately less complicated than it was for position players. One approach is to do it based on games started: pitchers that started at least 50% of the games they pitched in are considered to be starters, while the rest are considered to be relievers. And that is how the starter/reliever split is determined for each season. The other approach is using the position that a player accumulated the most Player Value at. So if your starter seasons were more valuable than your reliever seasons, you'd be considered a starter, even if your career games started proportion leans toward you being a reliever. An example of this is Firpo Marberry, who started just about 34% of his games, but provided more value as a starter than a reliever. There's also the matter of if we should take a player's total Player Value for their career and then just group them by their main position, or should we only use the Player Value that a player accumulated at this specific position. This choice is a little trickier, so I've gone ahead and listed out the top rankings for each option. For the various defensive positions, I did top 25 lists. For the designated hitters I did top 10 lists due to their smaller quantity. There were only about 150 DHs, and about 1000 players at each defensive position. But we have over 6000 relief pitchers here, so I'm expanding it to a top 50 list. So, without further adieu: Top 50 Relief Pitchers From 1912-2021, Based On Total Player Value At All Positions
Whew?! That was a lot of players. Now to discuss some things before anyone freaks out and trashes the list.
Top 50 Relief Pitchers From 1912-2021, Based On Total Player Value As A RP
Guys like Eck fall here due to also spending some time as a starter. Top 50 Relief Pitchers From 1912-2021, Based On Pitching Value At All Positions
Some of you probably like this ranking better, and that's fine. The main duty of pitchers is pitching, after all (especially with the universal DH now in effect). And I think Pitching Value works pretty well, as does Batting Value. I think pitchers that were better hitters should be justifiably rewarded for that added value. The same should be true for pitchers that were better fielders, though I'm less confident with Fielding Value's current accuracy. I don't think it's blatantly wrong, but I wouldn't say it is as reliable as the batting and pitching components currently are. Top 50 Relief Pitchers From 1912-2021, Based On Fielding Value At All Positions
Since relievers bat considerably less often than starters, I will only list out the top 25 hitting relief pitchers. Top 25 Relief Pitchers From 1912-2021, Based On Batting Value At All Positions
In addition to being a good fielder, we see that Kaat was also one of the better hitting relievers. He hit 16 HRs in his career and had a .227 OBP; the league average OBP across all positions during his career was .330. Dutch Ruether played in earlier years when homers were less common and just hit 7 in his career, but his career OBP of .314 compares more favorably to the league average during his career of .347. Top 10 Relief Pitchers From 1912-2021, Based On Baserunning Value At All Positions
Mitchell stole 9 bases in his career and was caught once. Sutcliffe, Steele, and Valdez all stole 4 bases and were never caught. Marquard stole 6 bases and was caught twice. So that shows the minimal impact that a reliever's baserunning abilities has on their value... From the span of 1912-2021, I have 6,160 players that contributed most of their value as relief pitchers. If you go based off of games played, however, there are 6,098 relief pitchers in this span. There are a total of 8,394 pitchers in this span. Recall that we had 8,646 total position players in this span. Combining this, we have a total of about 17,040 players from 1912-2021. Baseball Reference says there have been 22,860 players in history, so the remaining guys must have been Negro Leagues players or played before 1912. So to be in the top 1%, a pitcher would have to be among the top 60-61 relievers during this span. To be in the top 1.18% (the general Hall of Fame mark), a player would have to be among the top 71-72 relievers during this span. There are currently 14 relief pitchers in the Hall of Fame. Because of the revolution of the reliever role over time, there are actually no pre-1912 relievers or Negro League relievers in Cooperstown. I will again mention that Satchell Paige appears in my dataset since he was mainly a reliever when he played in MLB at the end of his career; he is most famous for his dominance as a starter in the Negro Leagues. Note that this initial 14 includes Jim Kaat, Jim Bunning, Chief Bender, Rube Marquard, Waite Hoyt, and Jesse Haines, all of whom we consider as primarily relievers based on value, despite proportionally playing more games as starters. Tommy Lasorda was primarily a reliever during his playing career, but was inducted as a manager. Clark Griffith was mainly a reliever by value, but was inducted as a pioneer/executive. So we have 14 Hall of Fame relievers to work with. If we look at the top 14 relief pitchers according to Player Value, 6 of them are in Cooperstown. Therefore, we have 8 exceptions of Hall of Famers that aren't in the top 14. Those 8 exceptions are Bruce Sutter (18), Waite Hoyt (28), Lee Smith (42), Chief Bender (91), Jim Bunning (3821), Rube Marquard (5360), Jim Kaat( 5366), and Jesse Haines (6053). At 18th, Sutter falls just outside of the top 14. However, 3 of the top 14 pitchers are still active or retired and still on the ballot (Wagner, Kimbrel, and Jansen). So if we want to exclude those players and instead expand our border to the next 3 relievers (i.e. the top 17), then Sutter is even closer. If we just go off of Pitching Value, Sutter is slightly higher at 16th. He was one of the earlier revolutionary closers when the role began to flourish. He was also one of the rare closers to win the Cy Young award. He went to 6 All-Star games and was named the Reliever of the Year 4 times. Player Value doesn't really agree on these accolades, giving 0 Cy Youngs, 1 Reliever of the Year, and 2 All-Star games. But even given his solid actual accolades, it took him 14 years on the BBWAA ballot to get inducted in 2006. Hoyt at 28th isn't extremely far out either. He was inducted in 1969 by a Veterans Committee. His Pitching Value ranks slightly better at 24th. He played more games as a starter, but added more value as a reliever. He probably had some Yankee bias, and was a part of 3 World Series winning teams. I think his case has somewhat of a pioneering aspect to it, as an early closer. He led the leauge in saves in 1928 with 8. He had just 53 saves in his career, but won 237 games. Smith doesn't rank too well at 42nd, but based on Pitching Value he's a much more favorable 17th. His 478 career saves were the most all-time from 1993 until 2006, when Hoffman broke his record. He was a 7 time All-Star and 3 time Reliever of the Year. Despite all that, it still took a Veterans Committee in 2019 to get him inducted. Interestingly, Player Value doesn't think Smith was ever the best reliever at pitching (i.e. Reliever of the Year), or one of the top two relievers overall in his league (i.e. All-Star). Bender actually played from 1903-1925, so we are missing 9 of his seasons. He had 36.9 WAR from 1903-1911, and 11.1 WAR from 1912-1925. Given his 45.09 in Player Value from 1912-1925, we can use the same Player Value/WAR ratio to estimate that he'd have 149.89 in Player Value from 1903-1911. Combing those pieces puts him at 194.98, which would be 2nd all-time. Now it was really just his post 1912 self that was mainly a reliever, so he'd probably be a starter over his whole career, in which case he would rank 34th. Regardless, once we consider his earlier years we see that Bender was clearly deserving of induction. You probably don't think of Jim Bunning as a relief pitcher, as he proportionally was more of a starter. However, he provided more value as a reliever since he had just -6.05 Player Value as a starter. Bunning struck out 2,855 batters in his career and played in 9 All-Star games, though just 7 All-Star seasons. Even then, it took a Veterans Committee in 1966 to get him inducted. Similar to Robin Roberts and Early Wynn, Player Value actually thinks that Bunning was underrated in his prime. It thinks he should have won 2 Cy Youngs, though just appeared in 6 All-Star seasons. Bunning was stellar his first 4 seasons in Philly and in 1960 and 1961 in Detroit, providing 115.7 in value. However, he wasn't overly impressive for the rest of his career, was uncharacteristically bad in 1963 (-23.1 in value), and lost 69.2 in value in his final 4 seasons when he was 36-39 from 1968-1971. Again, we like to look at awards and good seasons for the Hall of Fame, but fail to consider a player's bad seasons. I don't think Bunning should suffer from his old age seasons, but for the other years I think we should consider the full context of his career. Rube Marquard played from 1908-1925, so we are missing 4 of his seasons here. He was inducted by one of the notorious Veterans Committees in 1971. Though him and Frankie Frisch both played for the New York Giants in their careers, they never were on the same team. Marquard ranks very poorly among pitchers in terms of WAR, posting just 32.4 WAR. Bill James has said that he is probably the worst starting pitcher in the Hall of Fame. Like Bunning, he played more as a starter but provided more value as a reliever since he ranks very negatively as a starter. He was basically a solid pitcher from 1911-1913 and then from 1916-1917, but not really elsewhere. He's a pretty egregious Hall of Famer. Jim Kaat was recently inducted by an Era Committee in 2022. He was one of the few guys from that class that I actually supported; his 16 Gold Gloves are the 2nd most by a pitcher in history and 7 more than the next highest pitcher. He was tied with Brooks Robinson for the most Gold Gloves by any player until Greg Maddux broke their record. His 283 wins were also close to the 300 win mark that was previously considered worthy of automatic Hall of Fame induction. With Player Value, I've seen that Gil Hodges, Tony Oliva, and Minnie Minoso were all more worthy of Cooperstown than Jim Kaat. His Gold Gloves were largely anecdotal, like Derek Jeter's. He was really only the best defensive pitcher for 2 seasons. He went to 3 All-Star games, but Player Value thinks that should have been 4. Kaat was streaky as a pitcher in the 1960s and early 1970s. He was great in '74, '62, and '72; he was solid in '61 and from '64-'66; he wasn't all that in '67-'68 and '71 and '73. He was simply bad in '63 and '69-'70. His worst season was in 1977 when he lost 24.3 in Player Value, and the rest of his career after 1974 was generally around the 25th percentile or worse. Like Harold Baines, I supported Kaat's Cooperstown case from a more traditional perspective, but he is undeserving according to Player Value. Jesse Haines was inducted by a Veterans Committee in 1970, and is a true cronyism example as he played with Frankie Frisch from 1927 until the end of both of their careers in 1937. As such, he's another guy that Bill James doesn't think deserves to be in, and I agree. Haines was proportionally more of a starter but provided more value as a reliever since he was negative as a starter. He wasn't bad in 1927 (17.5 value), but he was terrible in 1924 and 1929 (-30.3 and -31.1 in value). He was just a pretty "meh" player for most of his career. So there's a bit on our Hall of Fame exceptions. Bender is easily in if we consider his pre 1912 self, Sutter and Smith are on the top 14 cusp already and fare better if we only consider their Pitching Value, Bunning had an extraordinary peak but just broke down afterwards or had some uncharacteristically bad seasons. Hoyt benefitted from being on World Series winning teams and from being a sort of closer pioneer. Kaat had somewhat of a traditional case that was boosted by poor awards voting and counting stat accumulation. Marquard and Haines are simply egregious inductees. So of our 14 actual Hall of Famers to work with, we can probably say that 6-10 are deserving. I've already mentioned the 3 active or still-on-the-ballot relievers that rank in the top 14 (Wagner, Kimbrel, Jansen) that ought to be inducted. Others in the top 14 that deserve Cooperstown consideration include Kent Tekulve, Dan Quisenberry, Tom Gordon, Eddie Rommel, and Bobby Shantz. Player Value thinks that a total of 16 different relievers had the best Pitching Value in a season in their league and therefore should have won a Cy Young award. In actuality, only 9 relievers have won the award. Jim Bunning is technically the only "reliever" to win 2, but those would have both been in his peak days as a starter. Some other hypothetical Cy Young winners include Rob Dibble in 1990, Rivera in 1996, and Gossage in 1982. Rivera and Gossage lead the way with 4 Reliever of the Year awards. Wilhelm, Eckersley, Jansen, and Radatz are all tied with 3. Firpo Marberry was designated as a starter because that's where he provided the most value despite proportionally pitching more as a reliever. He too should have won 4 Reliever of the Year awards, in addition to deserving to win a Cy Young in 1929 as a starter. Rivera and Wilhelm lead the way with 10 All-Star seasons. Basically all of the relief pitchers in the Hall of Fame were closers; guys that pitch in the 9th inning. I was hoping to see true relief pitchers, like long bullpen guys that take over after poor starts or setup guys that get teams through the 7th and 8th innings, rank higher in Player Value. Surely there had to be at least one relief pitcher that wasn't a closer that deserves to be in the Hall of Fame? Unfortunately, it appears not. Any of my underrated players not in Cooperstown like Tekulve or Quiz were still mainly closers, and others that rank higher like Gordon, Shantz, or Rommel spent a decent portion of their careers as starters. The best reliever that was not a closer of all-time appears to be Mark Eichhorn, who pitched from 1982-1996 (by when closers were common) and recorded just 32 saves. He ranks 21st in Player Value among relievers at 86.26, unfortunately not really enough to support for Cooperstown. Of the 6,098 relief pitchers in my dataset based off of games played, 11 are in the Hall of Fame. That's 0.18%, significantly less than the "top 1%" idea that many people think of the Hall of Fame as, as well as the top 1.18% that the Hall actually operates at. This is by far a lower induction rate than starting pitchers and any defensive position. If we would technically want that 1% or so to hold water across every position, then we'd need to induct about 50 more relievers. By no means do I think there are 50 relief pitchers that deserve to be inducted, though I do think there are a few more that we could put in. The truth of the matter is that relievers are the most replaceable players (thus why there are so many more) and therefore they generally aren't as valuable. Most of the guys that rank around 25th at their position have a Player Value anywhere from 200 to 350. For relievers that number is 78. You could be extreme and say that no relief pitchers, or maybe only Rivera, deserve to be in the Hall of Fame. But being a relief pitcher is a unique and important role for a team; someone has got to go in and shut guys down and any player that does so, well above their peers, deserves recognition as an all-time great. In the end, we need a balance between inducting like the top 1% or so of players at each position (which would see too many relievers in the Hall) and inducting like the top 1% or so of players across all positions (which would see too few relievers in the Hall). Below you can graphically see how all of our relievers compare in terms of Player Value, along with the black line denoting which players provided positive value, the gold line denoting the Hall of Fame mark, and the blue dots denoting the actual Hall of Fame members:  You can imagine the surplus of relievers we'd have to induct if we put any red dot above the gold line in, but clearly there are some red dots that stand out enough to deserve induction. Our two non-Hall of Famers at the top with little Pitching Value but lots of Batting/Fielding/Baserunning value are Bobby Shantz and Eddie Rommel. The five non-Hall of Famers to the far left with the worst Pitching Value are Jamey Wright, Pedro Ramos, Ron Kline, Johnny Klippstein, and Terry Mulholland. We see how clearly Mariano Rivera sticks out compared to the rest of the relievers, as the blue dot on the far right. Below you can graphically see how the top 25 relievers compare in terms of Player Value:  And since we have so much more relievers than any other position, I'll also graphically show the top 26-50 relievers in terms of Player Value:  Below is the dataset of primarily relief pitchers from 1912-2021, as determined by which position the player provided the most Player Value at. There are 6,160 players in this dataset.
Below is the dataset of primarily relief pitchers from 1912-2021, as determined by which position the player played the most games at. There are 6,098 players in this dataset.
Thanks for checking out this reliever rankings post. I plan to update it whenever I develop new Player Value iterations, and hopefully we'll get closer and closer to some rankings that we can more firmly support. I'd say the main takeaways for now should be:
If you'd like to receive email updates for each new post that I make, sign up for the Statting Lineup newsletter using the link below: https://weebly.us18.list-manage.com/subscribe?u=ab653f474b2ced9091eb248b1&id=3a60f3b85f The information used here was obtained free of charge from and is copyrighted by Retrosheet. Interested parties may contact Retrosheet at 20 Sunset Rd., Newark, DE 19711 Well, by "all-time", I really mean from 1912-2021, as that is currently the span of years that I have the data for. As the headline suggests, these rankings are according to my Player Value metric as of the date listed above. You can read my initial Player Value post here and its addendum here. Since then I have used Retrosheet play by play data to better fine tune the run value weights of the various events, but haven't been able to write up a post detailing them yet. Rather than listing them out again in this post, you can view them towards the top of my latest Hall of Fame post here. When we're discussing positional rankings, there's a couple of ways we can decide what a player's primary position was. For pitchers, this is fortunately less complicated than it was for position players. One approach is to do it based on games started: pitchers that started at least 50% of the games they pitched in are considered to be starters, while the rest are considered to be relievers. And that is how the starter/reliever split is determined for each season. The other approach is using the position that a player accumulated the most Player Value at. So if your starter seasons were more valuable than your reliever seasons, you'd be considered a starter, even if your career games started proportion leans toward you being a reliever. An example of this is Firpo Marberry, who started just about 34% of his games, but provided more value as a starter than a reliever. There's also the matter of if we should take a player's total Player Value for their career and then just group them by their main position, or should we only use the Player Value that a player accumulated at this specific position. This choice is a little trickier, so I've gone ahead and listed out the top rankings for each option. For the various defensive positions, I did top 25 lists. For the designated hitters I did top 10 lists due to their smaller quantity. There were only about 150 DHs, and about 1000 players at each defensive position. But we have over 2000 starting pitchers here, so I'm expanding it to a top 50 list. So, without further adieu: Top 50 Starting Pitchers From 1912-2021, Based On Total Player Value At All Positions
Whew?! That was a lot of players. Now to discuss some things before anyone freaks out and trashes the list.
Top 50 Starting Pitchers From 1912-2021, Based On Total Player Value As A SP
Pedro gets passed by Ryan as he was actually mainly a reliever in his rookie season of 1993, though a good one at that; he put 9.4 Player Value and finished 9th in Rookie of the Year voting. Smoltz drops due to his switch to the closer role from 2001-2004, famously leading the league in saves, wining the Rolaids Relief Man Award, and finishing 3rd in Cy Young voting in 2002. Like Pedro, Orel Hersisher also started his career as a Dodger reliever and finished 3rd in Rookie of the Year voting in 1984. Other players that we see drop somewhat due to time as relievers include Carl Mays, Bob Lemon, Bret Saberhagen, Chris Sale, and Derek Lowe. Top 50 Starting Pitchers From 1912-2021, Based On Pitching Value At All Positions
Some of you probably like this ranking better, and that's fine. The main duty of pitchers is pitching, after all (especially with the universal DH now in effect). And I think Pitching Value works pretty well, as does Batting Value. I think pitchers that were better hitters should be justifiably rewarded for that added value. The same should be true for pitchers that were better fielders, though I'm less confident with Fielding Value's current accuracy. I don't think it's blatantly wrong; hell, Maddux has 18 Gold Gloves and rank first. But I wouldn't say it is as reliable as the batting and pitching components currently are. Top 50 Starting Pitchers From 1912-2021, Based On Fielding Value At All Positions
Top 10 Starting Pitchers From 1912-2021, Based On Baserunning Value At All Positions
Burleigh Grimes wasn't much of a pitcher, but he sure could hit, field, and run well for one! Greinke, however, is an all-around ballplayer. He's in the top lists for pitching, fielding, batting, and baserunning. From the span of 1912-2021, I have 2,234 players that contributed most of their value as starting pitchers. If you go based off of games played, however, there are 2,296 starting pitchers in this span. There are a total of 8,394 pitchers in this span. Recall that we had 8,646 total position players in this span. Combining this, we have a total of about 17,040 players from 1912-2021. Baseball Reference says there have been 22,860 players in history, so the remaining guys must have been Negro Leagues players or played before 1912. So to be in the top 1%, a pitcher would have to be among the top 22-23 starters during this span. To be in the top 1.18% (the general Hall of Fame mark), a player would have to be among the top 27-28 starters during this span. There are currently 67 starting pitchers in the Hall of Fame. This includes 15 pre-1912 pitchers and 6 Negro League pitchers, all of whom I listed out earlier. Note that this initial 67 does not include Jim Kaat, Jim Bunning, Chief Bender, Rube Marquard, Waite Hoyt, or Jesse Haines, all of whom we consider as primarily relievers based on value. Tommy Lasorda was primarily a starter during his playing career, but was inducted as a manager. Candy Cummings and Al Spalding were also mainly starters, but were inducted as a pioneer/executive. So after accounting for the Negro League and pre-1912 pitchers, we have 46 Hall of Fame starters to work with. If we look at the top 46 starting pitchers according to Player Value, 26 of them are in Cooperstown. Therefore, we have 20 exceptions of Hall of Famers that aren't in the top 46. However, 8 of the top 46 pitchers are still active or retired and have yet to appear on a ballot (Kershaw, Greinke, Verlander, Wainwright, Herndandez, deGrom, Sale, and Scherzer). So if we want to exclude those players and instead expand our border to the next 8 starters (i.e. the top 54), 3 more Hall of Famers make the cut in Jenkins (48), Ford (49), and Feller (54). Additionally, there are at least 2 starters in the top 54 that are known to have used PEDs in Roger Clemens and Kevin Brown, so we could exclude them and expand to the top 56. That results in Hall of Famer Koufax (55) also making the cut. I will note that Feller and Koufax easily qualify on the basis of Pitching Value alone; Feller has a Ted Williams like case in that he would have been able to provide much more value had he not lost 3 seasons in his prime due to WWII. Koufax also lost time in being able to provide value by retiring at age 30 due to arthritis. With those adjustments aside, we now have 16 exceptions of Hall of Famers that aren't in the top 56. Those exceptions are:
So there's a bit on our Hall of Fame exceptions. 3 guys are easily in if we consider their pre 1912 selves, some guys are on the top 56 cusp already, some guys are on the cusp if we just consider their Pitching Value, and some guys had extraordinary peaks but just broke down afterwards or benefitted from being on World Series winning teams. Of our 46 actual Hall of Famers to work with, we can pretty reasonably say that 26-33 are deserving and maybe even a couple more than that. I've already mentioned the 8 active or yet-to-appear-on-the-ballot starters that rank in the top 46, as well as the 2 steroid users. In terms of Player Value alone, those 10 would be some non-Hall of Famers that should be inducted. Others include Carl Mays, Tim Hudson, Orel Hershiser, Dave Stieb, Johan Santana, Bret Saberhagen, Curt Schilling, Red Lucas, Carlos Zambrano, and Dolf Luque. We've talked about actual Hall of Famers that Player Value thinks should have won some Cy Youngs but that ranked pretty low over their careers, but I wanted to bring up a non-Hall of Famer that fit that role as well. Player Value rates Gary Peters at just 29.83 but thinks he should have won 3 Cy Young Awards in 1963, 1966, and 1967. A few weeks back I had brought up to my wife and 2 of my brothers that Peters appeared to be one of the more underrated pitchers in history by Player Value, and he unfortunately yet eerily died just a couple of days later. Koufax unanimously won the Cy Young in 1963 when it was still a single award for all of MLB. If there was an award for both the AL and NL that season, Peters could have won it, as he had the 2nd highest WAR among AL pitchers that year. Koufax again unanimously won the lone MLB Cy Young in 1966, and again Peters finished with the 2nd highest WAR among AL pitchers that year. Finally in 1967 there were 2 Cy Young awards, but Peters did not receive any votes in the AL. He did finish 9th in the AL MVP voting, with more WAR than the actual AL Cy Young winner Jim Lonborg. So if I had to advocate for someone to get in based off of the findings of Player Value, but not based on their actual Player Value rating, it would be Gary Peters. No pitcher that didn't use steroids has won 3 Cy Youngs and not been inducted. Shoutout to Babe Adams and Billy Pierce, who also fit this criteria of non-Hall of Famers that Player Value thinks should have won 3 Cy Youngs. Of the 2,296 starting pitchers in my dataset based off of games played, 54 are in the Hall of Fame. That's 2.35%, larger than the "top 1%" idea that many people think of the Hall of Fame as, as well as the top 1.18% that the Hall actually operates at. This is a lower induction rate than first basemen, but higher than catchers, second basemen, third basemen, shortstops, leftfielders, centerfielders, rightfielders, and designated hitters. Based on this, there should either be less starters in Cooperstown if we think 2.35% is too lenient (which I don't think it is), or there should be more players inducted at other positions so that this 1.85% rate holds across all positions. At this point, every position I've gone over thus far has had over 1% of the players inducted, so you may be wondering how the overall 1.18% mark can be true. It comes down to the great many relief pitchers that have not been inducted into the Hall of Fame. Below you can graphically see how all of our starters compare in terms of Player Value, along with the black line denoting which players provided positive value, the gold line denoting the Hall of Fame mark, and the blue dots denoting the actual Hall of Fame members:  Greg Maddux is the Hall of Famer to the top right, with Walter Johnson below him to the right. Roger Clemens is the non-Hall of Famer to the far right, with the most Pitching Value all-time. The 3 Hall of Famers to the bottom right with high Pitching Value but not much elsewhere are Nolan Ryan, Pedro Martinez, and Randy Johnson. Carl Mays is the non-Hall of Famer over the gold line with a lot of Fielding/Batting/Baserunning Value but not as much Pitching Value. Clarence Mitchell is the non-Hall of Famer to the top left close to the black line with little Pitching Value but a lot of Fielding/Batting/Baserunning Value. Bill Piercy is the non-Hall of Famer to the far left with the lowest Pitching Value all-time and near 0 value elsewhere. Below you can graphically see how the top 25 starters compare in terms of Player Value: 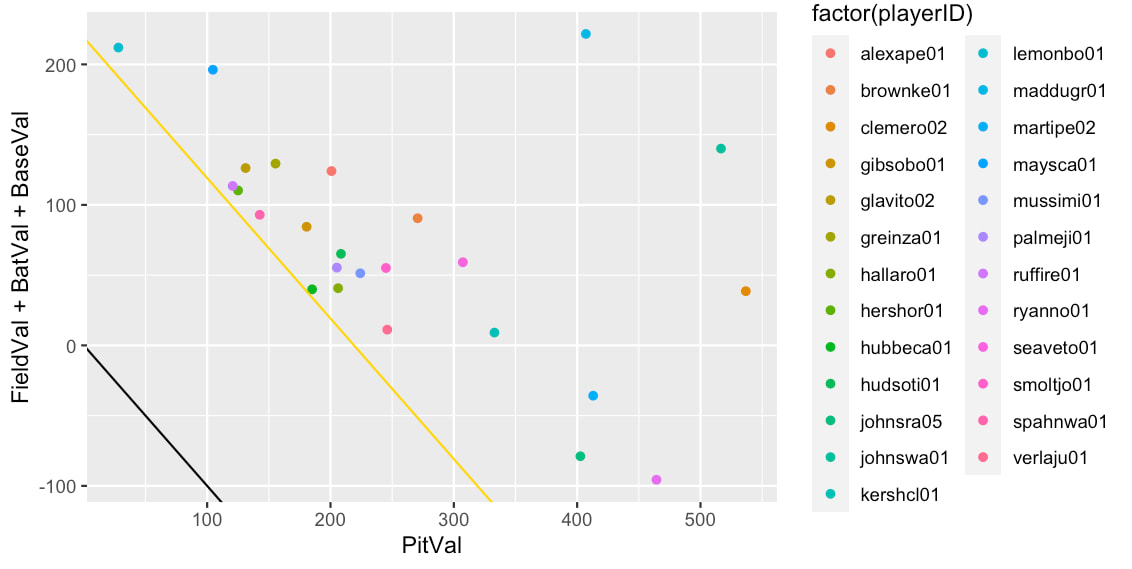 Since we have more than double the starting pitchers than any other position in the field, I'll also graphically show the top 26-50 starters in terms of Player Value:  Below is the dataset of primarily starting pitchers from 1912-2021, as determined by which position the player provided the most Player Value at. There are 2,234 players in this dataset.
Below is the dataset of primarily starting pitchers from 1912-2021, as determined by which position the player played the most games at. There are 2,296 players in this dataset.
Thanks for checking out this starter rankings post. I plan to update it whenever I develop new Player Value iterations, and hopefully we'll get closer and closer to some rankings that we can more firmly support. I'd say the main takeaways for now should be:
If you'd like to receive email updates for each new post that I make, sign up for the Statting Lineup newsletter using the link below: https://weebly.us18.list-manage.com/subscribe?u=ab653f474b2ced9091eb248b1&id=3a60f3b85f The information used here was obtained free of charge from and is copyrighted by Retrosheet. Interested parties may contact Retrosheet at 20 Sunset Rd., Newark, DE 19711. Well, by "all-time", I really mean from 1912-2021, as that is currently the span of years that I have the data for. As the headline suggests, these rankings are according to my Player Value metric as of the date listed above. You can read my initial Player Value post here and its addendum here. Since then I have used Retrosheet play by play data to better fine tune the run value weights of the various events, but haven't been able to write up a post detailing them yet. Rather than listing them out again in this post, you can view them towards the top of my latest Hall of Fame post here. When we're discussing positional rankings, there's a couple of ways we can decide what a player's primary position was. One approach is to do it based on games played, which is the easiest but results in guys like Pete Rose and Ernie Banks being first basemen. I instead elected to take the approach of using the position that a player accumulated the most Player Value at. This way, Rose is a left fielder and Banks is a shortstop. I still list out their main position by games played in the data files below, but that's not what I went off of. There's also the matter of if we should take a player's total Player Value for their career and then just group them by their main position, or should we only use the Player Value that a player accumulated at this specific position. This choice is a little trickier, so I've gone ahead and listed out the top rankings for each option. The number of players that played most of their games at DH is already about 15% of the size of all other positions. This makes some sense, as the DH was not implemented in the AL until 1973, and not in the NL until 2022 (which is unaccounted for here). Only 152 players played most of their games at DH from 1912-2021, and again those are all guys since 1973. But only 42 players in this span provided most of their value at DH. Why? As a DH, you can basically only accrue Batting Value and Baserunning Value. Many players added more value at another position via also having positive Fielding Value. Furthermore, it can be difficult to add value as a DH. The position is limited and designed for the best hitters. When your competitors are other great hitters, it's hard for you to stand out and show your value over your peers, even if you're a great hitter. Lastly, many guys get moved to DH at the end of their careers when they are unable to field as well. Even though they can still competently hit, their hitting abilities have likely also declined with age. For the other positions I've been doing top 25 rankings, but given that I only have 42 players to really work with, I'm just doing the top 10 here instead. So, without further adieu: Top 10 Designated Hitters From 1912-2021, Based On Total Player Value At All Positions
Since DHs basically have no Fielding Value, there is very little nuance when it comes to Player Value. Batting Value basically works like how wOBA and the batting component of WAR works, so we should see very similar rankings by looking at those. The only difference is the run value weights of the different batting events, and the inclusion of more batting events. I will make the following notes, however:
If I use those same 42 players again, this next list is boringly similar. To spice things up a bit, I'm going to use the 152 player dataset of guys that played their most games at DH instead. Top 10 Designated Hitters From 1912-2021, Based On Total Player Value As A DH
Like was the case with Rogers Hornsby and Joe Morgan for 2B, the answer to the "who was the greatest at the positon" question varies depending on how we frame it. Strictly based on value added as a DH, Ortiz was the best. Based on total value added across all positions and then assigning you to your primary position, Edgar was the best. Edgar drops here because he also provided 120.77 in value at 3B in his younger years. Ortiz is so much higher because he really only played DH and blossomed when doing so. In his 278 games at 1B (about half of Edgar's 562 games at 3B), Ortiz provided a -7.10 in Player Value. Big Papi wasn't just a DH; he was the DH. We'll move back to our list of 42 DHs based off of value for the rest of these. Top 10 Designated Hitters From 1912-2021, Based On Batting Value At All Positions
Not surprising that our rankings are similar here, given that Batting Value is the core part of being a designated hitter. The best batting season by a DH was Frank Thomas in 1991 with the White Sox, when he had 49.88 in Batting Value. He won the Silver Slugger and came 3rd in MVP voting. Top 10 Designated Hitters From 1912-2021, Based On Fielding Value At All Positions
Since it's impossible for a guy that is only a DH for entire season to have any Fielding Value, most of these guys accrued this Fielding Value in years when they weren't a DH. That should still be captured in their careers. Within a season, the reason we still include Fielding Value for DHs is because it is preferable to have a DH that is still capable of playing a defensive position well when need be. Branyan does have the best Fielding Value season by a DH, when he posted 21.17 in value in 2010 for the Indians and Mariners. That was from his occasional time at first base. Top 10 Designated Hitters From 1912-2021, Based On Baserunning Value At All Positions
Clearly baserunning is not a big part of being a DH, but it is funny to think of Encarnacion as the stealing king of a position. He stole 61 bases in his career, and was caught 14 times (81%). Terrance Gore is known as a pinch runner, but since that is all that he does he doesn't get as much playing time and therefore less opportunities to steal. He's stolen 43 bases and been caught 9 times (83%), but some seasons he's compared to various outfielders rather than third basemen or DHs, which is why he ranks lower. The best baserunning season by a DH was Gerald Perry in 1990 for the Royals when he had 3.54 Baserunning Value. He stole 17 bases and was caught 4 times that year (81%). Perry was primarily a first baseman for his career, however. From the span of 1912-2021, I have just 42 players that contributed most of their value as designated hitters. This is very interesting, considering there are 8,646 total position players in this span. If you go based off of games played, however, there are 152 designated hitters in this span. This makes sense, as any designated hitters that were negative for their careers would have been assigned to a different position, based on value. So to be in the top 1%, a player would have to be among the top 1-2 designated hitters during this span. To be in the top 1.18% (the general Hall of Fame mark), a player would still have to be among the top 1-2 designated hitters during this span. There are currently 2 designated hitters in the Hall of Fame, assuming we classify Frank Thomas at 1B, Paul Molitor at 3B, and Harold Baines at RF. So if we want to actually match the Hall of Fame numbers, that leaves us with 2 designated hitters to work with. And if we look at the top 2 designated hitters according to Player Value, both of them are in Cooperstown, and nobody else is particularly close. Even if we throw in our DHs by games played, Martinez and Ortiz still rank 3rd and 5th, with the top 2 (Molitor and Thomas) also being Hall of Famers. The exception is Brian Downing at 4th. You can use this and chose to think that neither Downing nor Ortiz should be Hall of Famers, or that both should be. But I'm fine with Ortiz being in and Downing not since Downing was truly mainly a LF based on value. Of the 152 designated hitters in my dataset based off of games played, 2 are in the Hall of Fame. That's 1.3%, slightly larger than the "top 1%" idea that many people think of the Hall of Fame as, as well as the top 1.18% that the Hall actually operates at. This is basically the same induction rate as third basemen, tied for the lowest across all positions. Things have been going well recently for DHs, with Martinez and Baines inducted in 2019, and Ortiz inducted in 2022. But I think things are more promising for third basemen, with the coming induction of Rolen in 2023, almost certainly Beltre in 2024, and likely future stars in Arenado, Machado, etc. Despite this low induction rate, I can't really argue for more DHs to be inducted like I could for third basemen. Encarnacion had a solid career, but he seems like a staple "Hall of Great" player to me. Maybe if his 2019 self had continued into 2020, 2021, and 2022, which would have put him closer to 500 home run territory and added value along the way. I think Cruz is close, but his 2022 was a setback and needed to be more like his 2021 self. The same will be true for his 2023 season. Regardless, his involvement in the Biogenesis scandal will hurt his case. Maybe we could put Brian Downing in, but I'm not pushing too hard on that either way. For the most part I think the DHs that deserved to be inducted have been. Below you can graphically see how all of our designated hitters compare in terms of Player Value, along with the black line denoting which players provided positive value, the gold line denoting the Hall of Fame mark, and the blue dots denoting the actual Hall of Fame members:  Since this uses the 152-player games played dataset, our 5 Hall of Famers here are Molitor, Thomas, Martinez, Ortiz, and Baines. We can clearly see how Baines doesn't really fit in with the rest, but how Brian Downing more so does. The other non-Hall of Famers to the right that standout with their higher Fielding Values are Mike Sweeney, Nelson Cruz, and Jose Canseco. The worst DH in this span was Matt LeCroy, with -39.92 Player Value. Below you can graphically see how the top 25 designated hitters compare in terms of Player Value.  Below is the dataset of primarily designated hitters from 1912-2021, as determined by which position the player provided the most Player Value at. There are technically 1,423 players in this dataset. This is due to the coding logic in my R files; any negative players appear as DHs with 0 value. What you should focus on are the 42 players with positive Player Value, from Edgar Martinez to Herb Washington.
Below is the dataset of primarily designated hitters from 1912-2021, as determined by which position the player played the most games at. There are technically 351 players in this dataset. This is also due to the coding logic in my R files; any player that played 0 games at all positions appear as a DH. An example is Branch Rickey, who appears in the 1912-2021 dataset because he played in 1914. However, he had just 2 PAs in 2 games played, both as a pinch hitter. Since he played none in the field, he doesn't have a registered position. Logically, Rickey couldn't have been a DH since the position didn't exist until 1973. What you should focus on are the 152 players that played at least 1 game at DH, from Paul Molitor to Matt LeCroy.
Thanks for checking out this DH rankings post. I plan to update it whenever I develop new Player Value iterations, and hopefully we'll get closer and closer to some rankings that we can more firmly support. I'd say the main takeaways for now should be:
Statting Lineup Newsletter Signup Form: If you'd like to receive email updates for each new post that I make, sign up for the Statting Lineup newsletter using the link below: https://weebly.us18.list-manage.com/subscribe?u=ab653f474b2ced9091eb248b1&id=3a60f3b85f The information used here was obtained free of charge from and is copyrighted by Retrosheet. Interested parties may contact Retrosheet at 20 Sunset Rd., Newark, DE 19711. Well, by "all-time", I really mean from 1912-2021, as that is currently the span of years that I have the data for. As the headline suggests, these rankings are according to my Player Value metric as of the date listed above. You can read my initial Player Value post here and its addendum here. Since then I have used Retrosheet play by play data to better fine tune the run value weights of the various events, but haven't been able to write up a post detailing them yet. Rather than listing them out again in this post, you can view them towards the top of my latest Hall of Fame post here. When we're discussing positional rankings, there's a couple of ways we can decide what a player's primary position was. One approach is to do it based on games played, which is the easiest but results in guys like Pete Rose and Ernie Banks being first basemen. I instead elected to take the approach of using the position that a player accumulated the most Player Value at. This way, Rose is a left fielder and Banks is a shortstop. I still list out their main position by games played in the data files below, but that's not what I went off of. There's also the matter of if we should take a player's total Player Value for their career and then just group them by their main position, or should we only use the Player Value that a player accumulated at this specific position. This choice is a little trickier, so I've gone ahead and listed out the top rankings for each option. So, without further adieu: Top 25 Rightfielders From 1912-2021, Based On Total Player Value At All Positions
Right field has less nuance than catchers and first basemen when it comes to Player Value, especially on the fielding end, so I have less need for commentary on justifying the rankings you see above. I think they are pretty believable, but I will make the following notes:
Top 25 Rightfielders From 1912-2021, Based On Total Player Value As A Rightfielder
Ruth drops due to time in LF and as a utility outfielder, but still easily claims the top spot. Aaron also drops due to time in LF and CF. Robinson drops due to time in LF, at 1B, and as DH. Sheffield drops due to time in LF and at 3B. Reggie Smith drops out of the top 25 due to providing nearly half of his value at CF. Slaughter also dropped out of the top 25 due to his time in LF. Top 25 Rightfielders From 1912-2021, Based On Batting Value At All Positions
Top 25 Rightfielders From 1912-2021, Based On Fielding Value At All Positions
Top 10 Rightfielders From 1912-2021, Based On Baserunning Value At All Positions
We think of Hank Aaron's bat primarily, but he also ranks as one of the greatest fielding and base stealing rightfielders in history. He was well-rounded, just not quite to the level of Willie Mays. Even though Ichiro's total Player Value isn't as impressive due to his poor Batting Value, ranking as the greatest fielding and base stealing rightfielder in history certainly helps his case. From the span of 1912-2021, I have just 428 players that contributed most of their value as rightfielders. This is very interesting, considering there are 8,646 total position players in this span. If you go based off of games played, however, there are 992 rightfielders in this span. This makes sense, as any rightfielders that were negative for their careers would have been assigned to a different position, based on value. So to be in the top 1%, a player would have to be among the top 9-10 rightfielders during this span. To be in the top 1.18% (the general Hall of Fame mark), a player would have to be among the top 11-12 rightfielders during this span. There are currently 27 rightfielders in the Hall of Fame, but that includes the mainly pre-1912 players Sam Thompson, Sam Crawford, King Kelly, Elmer Flick, Willie Keeler, and Tommy McCarthy, whom we don't really have Player Value for. Casey Stengel, Billy Southworth, and Whitey Herzog were primarily rightfielders during their playing careers, but were inducted as managers. Clark Griffith was primarily a rightfielder (by games played) during his playing career, but was inducted as a pioneer. Also note that these 27 Hall of Famers do not include Stan Musial or Andre Dawson, but do include Harold Baines. So if we want to actually match the Hall of Fame numbers, that leaves us with 21 rightfielders to work with after removing the mainly pre-1912 players. If we look at the top 21 rightfielders according to Player Value, 15 of them are in Cooperstown. The exceptions are Kiki Cuyler (24), Harry Hooper (35), Sam Rice (36), Tony Oliva (40), Ross Youngs (63), and Harold Baines. (82). All six of these Hall of Famers were voted in by a Veterans Committee after being rejected by the BBWAA ballot process. Baines drew particular outrage recently, but as I noted above he lost considerable value just because he kept playing when he was old. However, continuing to play allowed him to accumulate traditional stats like RBI and hits that drove his Hall of Fame case; Baines is currently 34th all-time in RBI, and at the time of his induction every player with more RBI was either in the Hall, still active, or used steroids. That fact is still true, as Pujols, Cabrera, and Beltre will all surely be Hall of Famers. Similarly, Baines currently ranks 47th all-time in hits, and again at the time of his induction every player with more hits was either in the Hall, still active, still on the BBWAA ballot, or used steroids (well, besides Pete Rose). This is still true, as Pujols/Cabrera/Beltre/Ichiro will surely get in, and Vizquel is still on the ballot. Though I don't think he would have reached 3000 hits, Baines' case was also helped by the fact that he played in strike-shortened seasons in 1981 and 1994. Lastly, Baines offensive numbers probably helped his Hall case more so than Player Value does; since he played offensively demanding positions like RF and DH, when compared to his peers Baines' offensive stats are less impressive. Oliva was more a recent induction that I didn't really agree with. Presumably his was a peak case, as he was an 8 time All-Star, but Player Value thinks his peak wasn't enough. It actually thinks he was only the 1st or 2nd best rightfielder in his league for 5 seasons. Harry Hooper actually played 3 seasons prior to our span here, from 1909-1911. He put up 7.6 WAR in those seasons; for reference, his best WAR season was 1920 with 5.2, which was also his best Player Value season at 45.56. If we assume that same ratio, then Hooper would have added about 66.59 in value from his pre-1912 years, which would move him up to 20th. I mentioned earlier that Sam Rice lost 27.4 in Player Value from his last 4 seasons because he played until he was 44. If we add that value back, Rice would rank 30th. Still not quite there, but remember that some of the guys ahead of him used steroids or are still active or on the ballot. Cuyler ranks the best of the bunch at 24th, so given the steroid users and active guys it's reasonable to understand why he is in. The true egregious case (outside of Baines) is Ross Youngs. To be fair, Youngs only played for 10 seasons until he was 29 because his career was cut short due to kidney disease; he died at age 30. However, other players have had short careers and had better peaks and thus more Player Value; Albert Belle (326.27), Ralph Kiner (350.85), Josh Hamilton (212.92), Roy Campanella (418.25), and Kirby Puckett (362.90) all have notably higher Player Value than Youngs' 139.30. As I said, the real reason Youngs got in is the same reason guys like Freddie Lindstrom and Chick Hafey got in: they played with Frankie Frisch, who was the head of the Veterans Committees in the 1970s and exercised extreme cronyism. Dwight Evans, Gary Sheffield, Reggie Smith, Mookie Betts, Sammy Sosa, and Bobby Abreu should presumably be in Cooperstown as they are the six top 21 rightfielders not in the Hall of Fame. If you want to throw out Betts since he's still active, as well as throw out Abreu and Sheffield since they're still on the BBWAA ballot, and throw out Sheffield and Sosa for their steroid usage, then the next 4 would be Bobby Bonds, Tim Salmon, actual Hall of Famer Cuyler, and another active player in Nelson Cruz. Next up is Giancarlo Stanton, also still active. Next from there is Bill Nicholson. So it appears that around 15-17 of the 21 Hall of Famers are justified by Player Value (the actual 15 in the top 21, Cuyler, and Hooper). It would be funny if Bobby Bonds got inducted before his son, though I don't see it happening. Of the 992 rightfielders in my dataset based off of games played, 23 are in the Hall of Fame. That's 2.3%, larger than the "top 1%" idea that many people think of the Hall of Fame as, as well as the top 1.18% that the Hall actually operates at. This is a lower induction rate than first basemen, but higher than catchers, second basemen, third basemen, shortstops, leftfielders, and centerfielders. The Hall loves to induct the big boppers. Based on this, there should either be less right fielders in Cooperstown if we think 2.3% is too lenient (which I don't think it is), or there should be more players inducted at other positions so that this 1.85% rate holds across all positions. Below you can graphically see how all of our rightfielders compare in terms of Player Value, along with the black line denoting which players provided positive value, the gold line denoting the Hall of Fame mark, and the blue dots denoting the actual Hall of Fame members:  The non-Hall of Famer with the most Fielding Value to the far right is Ichiro Suzuki, likely a future Hall of Famer. The notable non-Hall of Famers above the gold Hall of Fame line are Gary Sheffield, Reggie Smith, and Dwight Evans (in order from left to right). Jesus Alou is the worst non-Hall of Famer here. Below you can graphically see how the top 25 rightfielders compare in terms of Player Value.  The Great Bambino, The King of Swing, The Sultan of Swat, The Colossus of Clout, The Maharajah of Mash, The Wizard of Wallop, or my personal favorite, The Titan of Thump, was just an other worldly player. He is just so substantially above the rest of the greatest rightfielders of all-time in terms of Player Value. The difference between him and Hank Aaron (375) would still rank 11th among rightfielders, and the difference between him and Mel Ott (526) would rank 5th. Absurdity. Below is the dataset of primarily rightfielders from 1912-2021, as determined by which position the player provided the most Player Value at. There are 428 players in this dataset.
Below is the dataset of primarily rightfielders from 1912-2021, as determined by which position the player played the most games at. There are 992 players in this dataset.
Thanks for checking out this rightfield rankings post. I plan to update it whenever I develop new Player Value iterations, and hopefully we'll get closer and closer to some rankings that we can more firmly support. I'd say the main takeaways for now should be:
Statting Lineup Newsletter Signup Form: If you'd like to receive email updates for each new post that I make, sign up for the Statting Lineup newsletter using the link below: https://weebly.us18.list-manage.com/subscribe?u=ab653f474b2ced9091eb248b1&id=3a60f3b85f The information used here was obtained free of charge from and is copyrighted by Retrosheet. Interested parties may contact Retrosheet at 20 Sunset Rd., Newark, DE 19711. Well, by "all-time", I really mean from 1912-2021, as that is currently the span of years that I have the data for. As the headline suggests, these rankings are according to my Player Value metric as of the date listed above. You can read my initial Player Value post here and its addendum here. Since then I have used Retrosheet play by play data to better fine tune the run value weights of the various events, but haven't been able to write up a post detailing them yet. Rather than listing them out again in this post, you can view them towards the top of my latest Hall of Fame post here. When we're discussing positional rankings, there's a couple of ways we can decide what a player's primary position was. One approach is to do it based on games played, which is the easiest but results in guys like Pete Rose and Ernie Banks being first basemen. I instead elected to take the approach of using the position that a player accumulated the most Player Value at. This way, Rose is a left fielder and Banks is a shortstop. I still list out their main position by games played in the data files below, but that's not what I went off of. There's also the matter of if we should take a player's total Player Value for their career and then just group them by their main position, or should we only use the Player Value that a player accumulated at this specific position. This choice is a little trickier, so I've gone ahead and listed out the top rankings for each option. So, without further adieu: Top 25 Centerfielders From 1912-2021, Based On Total Player Value At All Positions
Center field has less nuance than catchers and first basemen when it comes to Player Value, especially on the fielding end, so I have less need for commentary on justifying the rankings you see above. I think they are pretty believable, but I will make the following notes:
Top 25 Centerfielders From 1912-2021, Based On Total Player Value As A Centerfielder
Carey drops here, as he had almost 90 in value at LF. Granderson falls out of the top 25 due to having about 39 in value at RF, while Damon falls out of the top 25 due to having almost 63 in value at LF. Top 25 Centerfielders From 1912-2021, Based On Batting Value At All Positions
Terry Cashman's "Talkin' Baseball" mentions Willie, Mickey, and the Duke, all 3 famed centerfielders for New York teams in the 1950s. I think most people think of Mays and Mantle as contemporaries, and they do rank 1st and 3rd all-time overall, but there is somewhat of a decent gap between them. When we just consider batting, however, they are much closer. This is also true for the batting piece of WAR. Duke is much lower at 18th overall, but jumps up to 9th for batting. So really these 3 guys were similar New York 1950s centerfield batters, but Mays was clearly the best overall due to his superior fielding and baserunning. If you just look at their joint seasons in the 1950s, Duke fares better and Mantle actually has the highest WAR. Top 25 Centerfielders From 1912-2021, Based On Fielding Value At All Positions
Top 10 Centerfielders From 1912-2021, Based On Baserunning Value At All Positions
From the span of 1912-2021, I have just 468 players that contributed most of their value as centerfielders. This is very interesting, considering there are 8,646 total position players in this span. If you go based off of games played, however, there are 920 centerfielders in this span. This makes sense, as any centerfielders that were negative for their careers would have been assigned to a different position, based on value. So to be in the top 1%, a player would have to be among the top 9-10 centerfielders during this span. To be in the top 1.18% (the general Hall of Fame mark), a player would have to be among the top 10-11 centerfielders during this span. There are currently 24 centerfielders in the Hall of Fame, but that includes the mainly pre-1912 players Billy Hamilton and Hugh Duffy, as well as the Negro League players Oscar Charleston, Turkey Stearnes, Cristobal Torriente, Cool Papa Bell, and Pete Hill, whom we don't really have Player Value for. Jocko Conlan was primarily a centerfielder (by games played) during his playing career, but was inducted as an umpire. So if we want to actually match the Hall of Fame numbers, that leaves us with 17 centerfielders to work with. If we look at the top 17 centerfielders according to Player Value, just 10 of them are in Cooperstown. The exceptions are Duke Snider (18), Larry Doby (21), Andre Dawson (31), Hack Wilson (39), Earle Combs (41), Edd Roush (44), and Lloyd Waner (72). Snider as previously mentioned was part of a legendary NY CF trio in the '50s, supporting his induction; he's also right on the edge at 18th, with 3 guys ahead of him that are either still active or still on the BBWAA ballot, so his induction is fine. Doby is close to the border as well, and had to spend his first 4-5 professional seasons in the Negro Leagues, in addition to missing a year due to war. He also has the cultural distinction of being the 2nd player to break baseball's color barrier after Jackie Robinson, and the first to do so in the American League. Even with his great MLB numbers, Doby still had to get inducted by a Veteran's Committee. With the exception of Dawson, the rest of the remaining players were also inducted by a Veteran's Committee. Dawson didn't reach 500 homers or 3000 hits, but came close to both. He also has solid Hall of Fame accolades, with an MVP, 8 All-Star games, and 8 Gold Gloves; even then, it took him 9 years on the BBWAA ballot to get inducted. Wilson has some uniqueness in being the single season record holder for RBI, with 191 in 1930. Roush and Combs don't have as much going for them, but they still had solid careers. The real unworthy player is Lloyd Waner, whom Bill James has also stated doesn't deserve to have been inducted. Lloyd's brother, Paul Waner, was a better player in RF and had already been inducted, which may have helped his cause. Mike Trout, Jim Edmonds, Carlos Beltran, Fred Lynn, Bernie Williams, Andruw Jones, and Chet Lemon should presumably be in Cooperstown as they are the seven top 17 centerfielders not in the Hall of Fame. If you want to throw out Trout since he's still active, as well as throw out Beltran and Jones since they're still on the BBWAA ballot, then the next 3 would be actual Hall of Famer Snider, Kenny Lofton, and Mike Cameron. So it appears that around 10 or 11 of the 17 Hall of Famers are justified by Player Value. Of the 920 centerfielders in my dataset based off of games played, 17 are in the Hall of Fame. That's 1.85%, larger than the "top 1%" idea that many people think of the Hall of Fame as, as well as the top 1.18% that the Hall actually operates at. This is a lower induction rate than first basemen and shortstops, but higher than catchers, second basemen, third basemen, and leftfielders. Based on this, there should either be less center fielders in Cooperstown if we think 1.85% is too lenient (which I don't think it is), or there should be more players inducted at other positions so that this 1.85% rate holds across all positions. Below you can graphically see how all of our centerfielders compare in terms of Player Value, along with the black line denoting which players provided positive value, the gold line denoting the Hall of Fame mark, and the blue dots denoting the actual Hall of Fame members:  Our two obvious non-Hall of Famers above the gold Hall of Fame line are Edmonds and Trout. The Hall of Famers with the extreme Fielding Value on the far right are Ashburn and Carey. The Hall of Famer with the extreme Batting Value in the top left is Mantle. The non-Hall of Famer with the most Fielding Value to the right is Willie Wilson, who played more games at CF despite providing more value in LF. The non-Hall of Famer with the least Fielding Value to the left is Samuel Byrd; Duke Snider and Hack Wilson are Hall of Famers that are among the worst defensive centerfielders in history. The lowest Hall of Famer here is Waner, with ~100 in Fielding Value and ~0 in Batting and Baserunning Value. Again, an egregious induction. I'd replace him with Edmonds, Lynn, Williams, Lofton, and more every day of the week. Below you can graphically see how the top 25 centerfielders compare in terms of Player Value:  There's almost two calibers of greatness that we can see here, even among the 25 best centerfielders in history. The top 9 players stand out more than the rest, and while one of those is the active Trout, the other is Edmonds who got voted off the BBWAA ballot. Below is the dataset of primarily centerfielders from 1912-2021, as determined by which position the player provided the most Player Value at. There are 468 players in this dataset.
Below is the dataset of primarily centerfielders from 1912-2021, as determined by which position the player played the most games at. There are 920 players in this dataset.
Thanks for checking out this centerfield rankings post. I plan to update it whenever I develop new Player Value iterations, and hopefully we'll get closer and closer to some rankings that we can more firmly support. I'd say the main takeaways for now should be:
Statting Lineup Newsletter Signup Form: If you'd like to receive email updates for each new post that I make, sign up for the Statting Lineup newsletter using the link below: https://weebly.us18.list-manage.com/subscribe?u=ab653f474b2ced9091eb248b1&id=3a60f3b85f The information used here was obtained free of charge from and is copyrighted by Retrosheet. Interested parties may contact Retrosheet at 20 Sunset Rd., Newark, DE 19711. Well, by "all-time", I really mean from 1912-2021, as that is currently the span of years that I have the data for. As the headline suggests, these rankings are according to my Player Value metric as of the date listed above. You can read my initial Player Value post here and its addendum here. Since then I have used Retrosheet play by play data to better fine tune the run value weights of the various events, but haven't been able to write up a post detailing them yet. Rather than listing them out again in this post, you can view them towards the top of my latest Hall of Fame post here. When we're discussing positional rankings, there's a couple of ways we can decide what a player's primary position was. One approach is to do it based on games played, which is the easiest but results in guys like Pete Rose and Ernie Banks being first basemen. I instead elected to take the approach of using the position that a player accumulated the most Player Value at. This way, Rose is a left fielder and Banks is a shortstop. I still list out their main position by games played in the data files below, but that's not what I went off of. There's also the matter of if we should take a player's total Player Value for their career and then just group them by their main position, or should we only use the Player Value that a player accumulated at this specific position. This choice is a little trickier, so I've gone ahead and listed out the top rankings for each option. So, without further adieu: Top 25 Leftfielders From 1912-2021, Based On Total Player Value At All Positions
Left field has less nuance than catchers and first basemen when it comes to Player Value, especially on the fielding end, so I have less need for commentary on justifying the rankings you see above. I think they are pretty believable, but I will make the following notes:
Top 25 Leftfielders From 1912-2021, Based On Total Player Value As A Leftfielder
Henderson had over 135 in value at CF but still remains 3rd due to just how high the top 3 players are over the rest. Yaz drops due to having about 131 value at 1B, Simmons drops due to having about 157 value at CF, Manny drops due to having about 201 value at RF, and Stargell drops due to having about 131 value at 1B. Rose drops out of the top 25 entirely due to having about 93 value at 2B, 102 value at 3B, 81 value at RF, and 25 value at 1B; Charlie Hustle could play almost anywhere! Top 25 Leftfielders From 1912-2021, Based On Batting Value At All Positions
There is a massive gap in Batting Value between Williams & Bonds and everyone else. Can you imagine what Williams' Batting Value would have been had he not missed his prime age 24-26 seasons from 1943-1945 due to WWII? Led the league in OPS the 2 seasons before that break, and then returned and led the league in OPS for 4 straight seasons... Top 25 Leftfielders From 1912-2021, Based On Fielding Value At All Positions
Top 10 Leftfielders From 1912-2021, Based On Baserunning Value At All Positions
I will note that Vince Coleman played most of his games at LF, but doesn't show up here since he had a negative total Player Value (-115.97) over the course of his career. In fact, among players who played most of their games at LF, Coleman actually has the lowest total Player Value all-time. However, his Baserunning Value of 38.53 would rank 5th among these players. Henderson (1406) , Brock (938), Raines (808), and Coleman (752) rank 1st, 2nd, 5th, and 6th in career stolen bases, respectively. Wilson also ranks 12th with 668. All players were great baserunners and added value in that manner, as we see here. However, while Henderson and Raines also provided solid value with their bat and glove, Brock and Coleman were more one dimensional. This is not a new concept; Henderson's WAR is 111.1 and Raines' is 69.4, while Brock's is 44.4 and Coleman's 12.5. You may think that Brock was a good hitter given his 3,023 hits and .293 career batting average. But we're above just relying on counting stats and batting average. Brock's OPS+ is just 109, while Raines and Henderson sit at 123 and 127. Brock is 4th all-time in at-bats by a leftfielder, allowing him to accumulate hits over the years. As Player Value shows us, you'd have rather had any 'ole Major League LF at the plate or in the field than Brock; it was not until the player was on base where we'd want The Rocket to take over. Brock basically didn't hit for enough power or walk enough to make up for his contact hitting tendencies and his proclivity to strike out. He's 7th among LF in career strikeouts and has less homers and walks than most of the other guys up there. Just compare him to Henderson - similar hits and strikeouts, but still far fewer home runs and walks. From the span of 1912-2021, I have just 445 players that contributed most of their value as leftfielders. This is very interesting, considering there are 8,646 total position players in this span. If you go based off of games played, however, there are 1,101 leftfielders in this span. This makes sense, as any leftfielders that were negative for their careers would have been assigned to a different position, based on value. So to be in the top 1%, a player would have to be among the top 11 leftfielders during this span. To be in the top 1.18% (the general Hall of Fame mark), a player would have to be among the top 13 leftfielders during this span. There are currently 22 leftfielders in the Hall of Fame, but that includes the mainly pre-1912 players Ed Delahanty, Fred Clarke, Jesse Burkett, Joe Kelley, and Jim O'Rourke, whom we don't really have Player Value for. Dick Williams was primarily a leftfielder (by games played) during his playing career, but was inducted as a manager. So if we want to actually match the Hall of Fame numbers, that leaves us with 17 leftfielders to work with. If we look at the top 17 leftfielders according to Player Value, just 9 of them are in Cooperstown. The exceptions are Billy Williams (20), Jim Rice (22), Joe Medwick (26), Minnie Minoso (31), Chick Hafey (35), Heinie Manush (44), Monte Irvin (59), and Lou Brock (140). Irvin missed one year due to WWII and also spent his first 10 professional baseball years in the Negro Leagues, not playing in Major League Baseball until 1949 when he was 30. Minoso also missed his first 3 professional baseball years in the Negro Leagues, and was recently inducted by a Veteran's Committee rather than through the BBWAA ballot. Hafey and Manush also had to be inducted via a Veteran's Committee. Hafey in particular played with Frankie Frisch for 5 years, who is infamous for his cronyism on the Veteran's Committees in the 1970s. Bill James doesn't think Hafey should have been inducted either. Rice and Williams rate pretty close to our cutoff mark, and it did take Rice 15 years on the BBWAA ballot to be inducted. Medwick rates pretty fair as well, and won an MVP and went to 10 All-Star games, but it did take him 9 years on the BBWAA ballot to be inducted. Barry Bonds, Manny Ramirez, Pete Rose, Bob Johnson, Shoeless Joe Jackson, Albert Belle, Ken Williams, and Brian Downing should presumably be in Cooperstown as they are the eight top 17 leftfielders not in the Hall of Fame. Of course, Rose and Jackson technically can't be in the Hall of Fame since they are currently banned from baseball. Bonds and Ramirez are also marred by PED usage. The next 4 players would be Brian Giles, Bobby Veach, actual Hall of Famer Billy Williams, and Ryan Braun, though Braun was also suspended for using PEDs. Next up would be actual Hall of Famer Rice. So bannings and PEDs aside, it appears that actually 11 of the 17 Hall of Famers are justified by Player Value. Of the 1,101 leftfielders in my dataset based off of games played, 18 are in the Hall of Fame. That's 1.63%, larger than the "top 1%" idea that many people think of the Hall of Fame as, as well as the top 1.18% that the Hall actually operates at. This is a lower induction rate than first basemen, second basemen, and shortstops, but higher than catchers and third basemen. Based on this, there should either be less left fielders in Cooperstown if we think 1.6% is too lenient (which I don't think it is), or there should be more players inducted at other positions so that this 2% rate holds across all positions. Below you can graphically see how all of our leftfielders compare in terms of Player Value, along with the black line denoting which players provided positive value, the gold line denoting the Hall of Fame mark, and the blue dots denoting the actual Hall of Fame members:  The non-Hall of Famer on the far left with the worst career Fielding Value among leftfielders is Greg Luzinski. Joining him among the worst are Gary Matthews (1972-1987), Ryan Klesko, and Moises Alou. The non-Hall of Famer on the far right with the best career Fielding Value among leftfielders is Carl Crawford. Joining him among the best are Garrett Anderson and Alex Gordon. The four notable non-Hall of Famers above the gold line are Bonds, Rose, Shoeless Joe Jackson, and Bob Johnson. Below you can graphically see how the top 25 leftfielders compare in terms of Player Value:  Even among the top 25 leftfielders of all-time, Rickey Henderson (far right point) was on a different planet. But Barry Bonds and Ted Williams (top two points) were in a different universe. It is ridiculous how great these 3 players were compared to the other positional greats. For catchers, the gap between the best player and the 4th best player was about 145, and the gap between the 3rd and 4th best players was about 13. For first basemen, the 1-4 gap was 321 and the 3-4 gap was 58. For second basemen, the 1-4 gap was 112 and the 3-4 gap was 21. For third basemen, the 1-4 gap was 248 and the 3-4 gap was 71. For shortstops, the 1-4 gap was 196 and the 3-4 gap was 23. But for leftfielders, the 1-4 gap is an astounding 544, and the 3-4 gap is a massive 216. Part of this is just how great these 3 players were, but part of this may also be the position. The 25th best SS had a 331 Player Value. The 25th best 3B had a 320 Player Value. The 25th best 2B had a 337 Player Value. The 25th best 1B had a 352 Player Value. However, the 25th best LF had just a 256 Player Value. The 25th best C had a 238 Player Value, though there are more reasons to justify catchers having lower career value than there are for leftfielders. Below is the dataset of primarily leftfielders from 1912-2021, as determined by which position the player provided the most Player Value at. There are 445 players in this dataset.
Below is the dataset of primarily leftfielders from 1912-2021, as determined by which position the player played the most games at. There are 1,101 players in this dataset.
Thanks for checking out this left field rankings post. I plan to update it whenever I develop new Player Value iterations, and hopefully we'll get closer and closer to some rankings that we can more firmly support. I'd say the main takeaways for now should be:
Statting Lineup Newsletter Signup Form: If you'd like to receive email updates for each new post that I make, sign up for the Statting Lineup newsletter using the link below: https://weebly.us18.list-manage.com/subscribe?u=ab653f474b2ced9091eb248b1&id=3a60f3b85f The information used here was obtained free of charge from and is copyrighted by Retrosheet. Interested parties may contact Retrosheet at 20 Sunset Rd., Newark, DE 19711. Well, by "all-time", I really mean from 1912-2021, as that is currently the span of years that I have the data for. As the headline suggests, these rankings are according to my Player Value metric as of the date listed above. You can read my initial Player Value post here and its addendum here. Since then I have used Retrosheet play by play data to better fine tune the run value weights of the various events, but haven't been able to write up a post detailing them yet. Rather than listing them out again in this post, you can view them towards the top of my latest Hall of Fame post here. When we're discussing positional rankings, there's a couple of ways we can decide what a player's primary position was. One approach is to do it based on games played, which is the easiest but results in guys like Pete Rose and Ernie Banks being first basemen. I instead elected to take the approach of using the position that a player accumulated the most Player Value at. This way, Rose is a left fielder and Banks is a shortstop. I still list out their main position by games played in the data files below, but that's not what I went off of. There's also the matter of if we should take a player's total Player Value for their career and then just group them by their main position, or should we only use the Player Value that a player accumulated at this specific position. This choice is a little trickier, so I've gone ahead and listed out the top rankings for each option. So, without further adieu: Top 25 Shortstops From 1912-2021, Based On Total Player Value At All Positions
Shortstop has less nuance than catchers and first basemen when it comes to Player Value, especially on the fielding end, so I have less need for commentary on justifying the rankings you see above. I think they are pretty believable, but I will make the following notes:
Top 25 Shortstops From 1912-2021, Based On Total Player Value As A Shortstop
A-Rod drops here due to his time as a third baseman, and Banks drops here due to his time as a first baseman. Yount drops due to his time in center field. Top 25 Shortstops From 1912-2021, Based On Batting Value At All Positions
Top 25 Shortstops From 1912-2021, Based On Fielding Value At All Positions
Top 10 Shortstops From 1912-2021, Based On Baserunning Value At All Positions
From the span of 1912-2021, I have just 397 players that contributed most of their value as shortstops. This is very interesting, considering there are 8,646 total position players in this span. If you go based off of games played, however, there are 955 shortstops in this span. This makes sense, as any shortstops that were negative for their careers would have been assigned to a different position, based on value. So to be in the top 1%, a player would have to be among the top 9-10 shortstops during this span. To be in the top 1.18% (the general Hall of Fame mark), a player would have to be among the top 11-12 shortstops during this span. There are currently 28 shortstops in the Hall of Fame, but that includes the mainly pre-1912 players George Davis, George Wright, John Ward, Bobby Wallace, Hughie Jennings, Joe Tinker, and Honus Wagner, as well as the Negro League players John Henry "Pop" Lloyd, Willie Wells, and Martin Dihigo, whom we don't really have Player Value for. That 23 also assumes that we include Ernie Banks. Leo Durocher was primarily a shortstop (by games played) during his playing career, but was inducted as a manager. So if we want to actually match the Hall of Fame numbers, that leaves us with 18 shortstops to work with. If we look at the top 18 shortstops according to Player Value, 15 of them are in Cooperstown. The exceptions are Luis Aparicio, Derek Jeter, and Phil Rizzuto, who rank 21st, 23rd, and 31st respectively. Rizzuto was inducted by a Veteran's Committee rather than through the BBWAA ballot. He probably gets some slack for winning an MVP and being a part of 7 World Series champion teams, as well as for missing 3 years of his career due to WWII. Aparicio was a poor hitter but one of the best baserunners and defenders in history. He won 9 Gold Gloves and and stole 506 bases, leading the league in steals for 9 seasons. Jeter was one of the best offensive shortstops in history, but arguably the worst defensive one. It's no shock that Jeter was inducted given his being part of 5 World Series champion teams, being the position's all-time hits leader, etc. Alex Rodriguez, Dick Bartell, and Troy Tulowitzki should presumably be in Cooperstown as they are the three top 18 shortstops not in the Hall of Fame. However, Tulowitzki has yet to appear on the ballot and A-Rod is still on the ballot, though his induction is hindered by his PED usage. Next in line would be Tony Fernandez and Miguel Tejada, but Tejada is also marred by PED use. From there the next highest is Aparicio, so I guess Bartell and Fernandez should theoretically be swapped in for Jeter and Rizzuto, according to Player Value. Of the 955 shortstops in my dataset based off of games played, 20 are in the Hall of Fame. That's 2.09%, larger than the "top 1%" idea that many people think of the Hall of Fame as, as well as the top 1.18% that the Hall actually operates at. This is a lower induction rate than first basemen, but higher than catchers, second basemen, and third basemen. Based on this, there should either be less shortstops in Cooperstown if we think 2% is too lenient (which I don't think it is), or there should be more players inducted at other positions so that this 2% rate holds across all positions. Below you can graphically see how all of our shortstops compare in terms of Player Value, along with the black line denoting which players provided positive value, the gold line denoting the Hall of Fame mark, and the blue dots denoting the actual Hall of Fame members:  Our two obvious non-Hall of Famers above the gold Hall of Fame line are A-Rod and Dick Bartell. The Hall of Famer with the extreme Fielding Value on the far right is Maranville, with Ozzie Smith and Dave Bancroft also grouped together. The Hall of Famer with the extreme Batting Value in the top left is Derek Jeter. The non-Hall of Famer with the most Fielding Value to the right is Dick Bartell, and the non-Hall of Famer with the least Fielding Value to the left is Hal Janvrin. The lowest Hall of Famer here that didn't play mainly before 1912 (i.e. Wallace, Tinker, and Wagner) is Rizzuto, with ~200 in Fielding Value and ~75 in Batting and Baserunning Value. I'm honestly fine with his induction, but think that there are certainly players that were more valuable and deserve to get in. Generally, I'd say any identifiable point in the right direction of these types of graphs should be inducted. It symbolizes how a player stood out from the rest of the crowd, the mass huddle of points around 0 Player Value. Below you can graphically see how the top 25 shortstops compare in terms of Player Value:  So you can be all bat and no glove like Jeter, all glove and no bat like Maranville, or a mix of both like Tulowitzki. Below is the dataset of primarily shortstops from 1912-2021, as determined by which position the player provided the most Player Value at. There are 397 players in this dataset.
Below is the dataset of primarily shortstops from 1912-2021, as determined by which position the player played the most games at. There are 955 players in this dataset.
Thanks for checking out this shortstop rankings post. I plan to update it whenever I develop new Player Value iterations, and hopefully we'll get closer and closer to some rankings that we can more firmly support. I'd say the main takeaways for now should be:
Statting Lineup Newsletter Signup Form: If you'd like to receive email updates for each new post that I make, sign up for the Statting Lineup newsletter using the link below: https://weebly.us18.list-manage.com/subscribe?u=ab653f474b2ced9091eb248b1&id=3a60f3b85f The information used here was obtained free of charge from and is copyrighted by Retrosheet. Interested parties may contact Retrosheet at 20 Sunset Rd., Newark, DE 19711. Well, by "all-time", I really mean from 1912-2021, as that is currently the span of years that I have the data for. As the headline suggests, these rankings are according to my Player Value metric as of the date listed above. You can read my initial Player Value post here and its addendum here. Since then I have used Retrosheet play by play data to better fine tune the run value weights of the various events, but haven't been able to write up a post detailing them yet. Rather than listing them out again in this post, you can view them towards the top of my latest Hall of Fame post here. When we're discussing positional rankings, there's a couple of ways we can decide what a player's primary position was. One approach is to do it based on games played, which is the easiest but results in guys like Pete Rose and Ernie Banks being first basemen. I instead elected to take the approach of using the position that a player accumulated the most Player Value at. This way, Rose is a left fielder and Banks is a shortstop. I still list out their main position by games played in the data files below, but that's not what I went off of. There's also the matter of if we should take a player's total Player Value for their career and then just group them by their main position, or should we only use the Player Value that a player accumulated at this specific position. This choice is a little trickier, so I've gone ahead and listed out the top rankings for each option. So, without further adieu: Top 25 Third Basemen From 1912-2021, Based On Total Player Value At All Positions
Third base has less nuance than catchers and first basemen when it comes to Player Value, especially on the fielding end, so I have less need for commentary on justifying the rankings you see above. I think they are pretty believable, but I will make the following notes:
Top 25 Third Basemen From 1912-2021, Based On Total Player Value As A Third Baseman
Evans drops here and Allen falls out of the top 25 due to their time playing first base. Molitor also drops out of the top 25 due to his team at second and as a DH. Top 25 Third Basemen From 1912-2021, Based On Batting Value At All Positions
Top 25 Third Basemen From 1912-2021, Based On Fielding Value At All Positions
Top 10 Third Basemen From 1912-2021, Based On Baserunning Value At All Positions
From the span of 1912-2021, I have just 307 players that contributed most of their value as third basemen. This is very interesting, considering there are 8,646 total position players in this span. If you go based off of games played, however, there are 931 third basemen in this span. This makes sense, as any third basemen that were negative for their careers would have been assigned to a different position, based on value. So to be in the top 1%, a player would have to be among the top 9-10 third basemen during this span. To be in the top 1.18% (the general Hall of Fame mark), a player would have to be among the top 10-11 third basemen during this span. There are currently 19 third basemen in the Hall of Fame, but that includes the mainly pre-1912 players Jimmy Collins and Deacon White, as well as the Negro League players Jud Wilson, Judy Johnson, and Ray Dandridge, whom we don't really have Player Value for. That 19 assumes that we include Tony Perez and Paul Molitor, whom we don't consider as a first baseman or a designated hitter. Bobby Cox, Bill McKechnie, and Dick Williams were all primarily third basemen (by games played or value) during their playing careers, but were inducted as managers. So if we want to actually match the Hall of Fame numbers, that leaves us with 14 third basemen to work with. If we look at the top 14 third basemen according to Player Value, 9 of them are in Cooperstown. The exceptions are Brooks Robinson, Home Run Baker, George Kell, Tony Perez, and Freddie Lindstrom, who rank 15th, 21st, 29th, 40th, and 58th respectively. Baker started his career in 1908, so he has 4 seasons that are unaccounted for here. Three of these five third basemen outside of the top 14 were inducted by a Veteran's Committee as well, rather than through the BBWAA ballot. The exceptions are Robinson and Perez. Robinson is just one spot outside of our top 14, and also rates as the greatest defensive third basemen of all-time, justifying his case. Perez rates and ranks less favorably, and it took him until his 9th year on the ballot to be inducted. His career RBI are pretty solid and he was an important member of one of the greatest teams of all-time, though. Darrell Evans, Harlond Clift, Willie Kamm, Adrian Beltre, and Graig Nettles should presumably be in Cooperstown as they are the five top 14 third basemen not in the Hall of Fame. However, Beltre has yet to appear on the ballot. Next in line would technically be Eddie Yost, but he ranks behind Robinson. Of the 931 third basemen in my dataset based off of games played, 12 are in the Hall of Fame. That's 1.29%, larger than the "top 1%" idea that many people think of the Hall of Fame as, as well as the top 1.18% that the Hall actually operates at. Based on this, there should either be less third basemen in Cooperstown if we think 1.30% is too lenient (which I don't think it is), or there should be more players inducted at other positions so that this 1.30% rate holds across all positions. Below you can graphically see how all of our third basemen compare in terms of Player Value, along with the black line denoting which players provided positive value, the gold line denoting the Hall of Fame mark, and the blue dots denoting the actual Hall of Fame members: 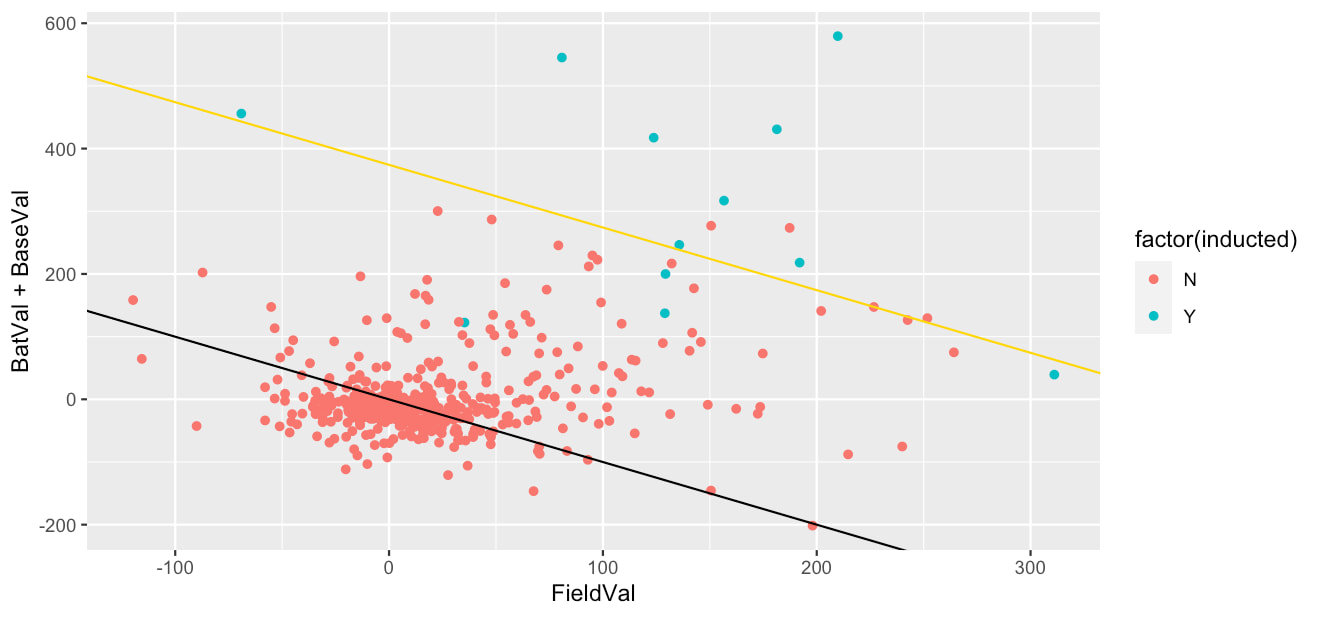 Our two obvious non-Hall of Famers above the gold Hall of Fame line are Harlond Clift and Darrell Evans. The Hall of Famer with the extreme Fielding Value on the far right is Brooks Robinson, while the Hall of Famer with the extreme Batting Value in the top left is Chipper Jones. The non-Hall of Famer with the most Fielding Value to the right is Buddy Bell, who we see sits just below the Hall of Fame line of 1.18%. The non-Hall of Famer with the least Fielding Value to the left is Howard Johnson; Bill Madlock and Aramis Ramirez join him as examples of third basemen that were poor defenders but solid batters. The lowest Hall of Famer here is Lindstrom, who played his entire career after 1912 (1924-1936), so all of his Player Value is accounted for. His induction into Cooperstown is a real head scratcher to me. He's clearly unworthy by Player Value, but I can't find a logical traditional argument for his case either. Bill James supposedly called him the worst third basemen in the Hall, and I'd have to agree. Next time you want to complain about Harold Baines, try complaining about Freddie Lindstrom instead. Below you can graphically see how the top 25 third basemen compare in terms of Player Value.  Below is the dataset of primarily third basemen from 1912-2021, as determined by which position the player provided the most Player Value at. There are 307 players in this dataset.
Below is the dataset of primarily third basemen from 1912-2021, as determined by which position the player played the most games at. There are 931 players in this dataset.
Thanks for checking out this third base rankings post. I plan to update it whenever I develop new Player Value iterations, and hopefully we'll get closer and closer to some rankings that we can more firmly support. I'd say the main takeaway for now should be that players like Evans and Clift were vastly underrated and should be seriously considered for future era committee inductions, as they appear more deserving than current Hall of Famers like Lindstrom, Kell, and even Perez. Recent inductee Scott Rolen fits in nicely with other Hall of Fame third basemen and doesn't adulterate the quality of that pool whatsoever. The fact that it took Ron Santo so long to get inducted is also absurd. Upcoming players like Beltre and Arenado should also be set for induction, while other actives like Machado and Ramirez still have a little work to do. Although third basemen technically get inducted at a higher rate than the Hall of Fame general rate of 1.18%, this is likely due to the large pool of pitchers (especially relievers) that don't get inducted. Compared to the positions that I've done thus far, catchers get inducted at about a 1% rate (15/1469), first basemen at about a 2.5% rate (22/894), second basemen at about a 1.75% rate (18/10330, and third basemen at about a 1.3% rate (12/931). More third basemen ought to be inducted into Cooperstown; Rolen was a step in the right direction, and hopefully Beltre and eventually Arenado will be as well.
Statting Lineup Newsletter Signup Form: If you'd like to receive email updates for each new post that I make, sign up for the Statting Lineup newsletter using the link below: https://weebly.us18.list-manage.com/subscribe?u=ab653f474b2ced9091eb248b1&id=3a60f3b85f The information used here was obtained free of charge from and is copyrighted by Retrosheet. Interested parties may contact Retrosheet at 20 Sunset Rd., Newark, DE 19711. Well, by "all-time", I really mean from 1912-2021, as that is currently the span of years that I have the data for. As the headline suggests, these rankings are according to my Player Value metric as of the date listed above. You can read my initial Player Value post here and its addendum here. Since then I have used Retrosheet play by play data to better fine tune the run value weights of the various events, but haven't been able to write up a post detailing them yet. Rather than listing them out again in this post, you can view them towards the top of my latest Hall of Fame post here. When we're discussing positional rankings, there's a couple of ways we can decide what a player's primary position was. One approach is to do it based on games played, which is the easiest but results in guys like Pete Rose and Ernie Banks being first basemen. I instead elected to take the approach of using the position that a player accumulated the most Player Value at. This way, Rose is a left fielder and Banks is a shortstop. I still list out their main position by games played in the data files below, but that's not what I went off of. There's also the matter of if we should take a player's total Player Value for their career and then just group them by their main position, or should we only use the Player Value that a player accumulated at this specific position. This choice is a little trickier, so I've gone ahead and listed out the top rankings for each option. So, without further adieu: Top 25 Second Basemen From 1912-2021, Based On Total Player Value At All Positions
Second base has less nuance than catchers and first basemen when it comes to Player Value, especially on the fielding end, so I have less need for commentary on justifying the rankings you see above. I think they are pretty believable, but I will make the following notes:
Top 25 Second Basemen From 1912-2021, Based On Total Player Value As A Second Baseman
Hornsby had a few seasons where he mainly played SS or 3B, so as solely a second baseman, Joe Morgan actually produced the most value. So the "best second baseman" argument here is kind of inconclusive, as it depends on how you want to format it. Top 25 Second Basemen From 1912-2021, Based On Batting Value At All Positions
Top 25 Second Basemen From 1912-2021, Based On Fielding Value At All Positions
Top 10 Second Basemen From 1912-2021, Based On Baserunning Value At All Positions
From the span of 1912-2021, I have just 535 players that contributed most of their value as second basemen. This is very interesting, considering there are 8,646 total position players in this span. If you go based off of games played, however, there are 1,033 second basemen in this span. This makes sense, as any second basemen that were negative for their careers would have been assigned to a different position, based on value. So to be in the top 1%, a player would have to be among the top 10-11 second basemen during this span. To be in the top 1.18% (the general Hall of Fame mark), a player would have to be among the top 12-13 second basemen during this span. There are currently 19 second basemen in the Hall of Fame, but that includes the mainly pre-1912 players Bid McPhee, Johnny Evers, and Napoleon Lajoie, whom we don't really have Player Value for. That 19 assumes that we exclude Rod Carew, who we consider as a first baseman. Miller Huggins, Bucky Harris, Sparky Anderson, and Tony La Russa were all primarily second basemen (by games played) during their playing careers, but were inducted as managers. So if we want to actually match the Hall of Fame numbers, that leaves us with 16 second basemen to work with. If we look at the top 16 second basemen according to Player Value, 12 of them are in Cooperstown. The exceptions are Joe Gordon, Red Schoendienst, Jackie Robinson, and Tony Lazzeri, who rank 17th, 18th, 20th, and 30th, respectively. Three of those four second basemen were inducted by a Veteran's Committee as well, rather than through the BBWAA ballot. The exception is Robinson, who obviously has a cultural impact to his Hall of Fame case due to his breaking of baseball's color barrier. Bobby Grich, Lou Whitaker, Robinson Cano, and Jeff Kent should presumably take their places, but Cano has yet to appear on the ballot and may have his reasons for not being inducted due to his PED use. Next in line would technically be Willie Randolph, but he ranks behind Gordon and Schoendienst. But it is important to note that second basemen are getting in at a higher rate than all positions in general. Of the 1,033 second basemen in my dataset based off of games played, 18 are in the Hall of Fame. That's 1.74%, larger than the "top 1%" idea that many people think of the Hall of Fame as, as well as the top 1.18% that the Hall actually operates at. Based on this, there should either be less second basemen in Cooperstown if we think 1.75% is too lenient (which I don't think it is), or there should be more players inducted at other positions so that this 1.75% rate holds across all positions. Below you can graphically see how all of our second basemen compare in terms of Player Value, along with the black line denoting which players provided positive value, the gold line denoting the Hall of Fame mark, and the blue dots denoting the actual Hall of Fame members:  The Hall of Famer with the extreme Fielding Value on the far right is Mazeroski, while the Hall of Famer with the extreme Batting Value in the top left is Hornsby. The two highest non-Hall of Famers above the Hall of Fame line are Grich and Whitaker. The non-Hall of Famer with the most Fielding Value to the right is Frank White, who see sits below the Hall of Fame line of 1.18%. The non-Hall of Famer with the least Fielding Value to the left is Andy High. The two lowest Hall of Famers here are Evers and Lajoie, who both played mainly before 1912 and therefore have a substantial amount of their value unaccounted for. The actual most egregious Hall of Famer looks to be Tony Lazzeri, who is the blue dot that stands out with a Fielding Value of ~0 and a Batting Value + Baserunning Value of ~250. Below you can graphically see how the top 25 second basemen compare in terms of Player Value.  Below is the dataset of primarily second basemen from 1912-2021, as determined by which position the player provided the most Player Value at. There are 535 players in this dataset.
Below is the dataset of primarily second basemen from 1912-2021, as determined by which position the player played the most games at. There are 1,033 players in this dataset.
Thanks for checking out this second base rankings post. I plan to update it whenever I develop new Player Value iterations, and hopefully we'll get closer and closer to some rankings that we can more firmly support. I'd say the main takeaway for now should be that players like Grich, Whitaker, Kent, and Randolph were vastly underrated and should be seriously considered for future era committee inductions, as they appear more deserving than current Hall of Famers like Lazzeri, Gordon, and Schoendienst. Upcoming players like Utley and Kinsler should be considered, but no active player is pushing obvious induction so far. Lastly, second basemen seem to be inducted at a higher clip than other positions, so we should contemplate why that is and whether that should be the case. I believe that all positions play important roles in baseball and that they should all be equally represented in the Hall of Fame; in the case of second basemen, I think we allow our obsession with their defense to alter our perception of the best players, ignoring some of the best offensive second basemen in history.
Statting Lineup Newsletter Signup Form: If you'd like to receive email updates for each new post that I make, sign up for the Statting Lineup newsletter using the link below: https://weebly.us18.list-manage.com/subscribe?u=ab653f474b2ced9091eb248b1&id=3a60f3b85f The information used here was obtained free of charge from and is copyrighted by Retrosheet. Interested parties may contact Retrosheet at 20 Sunset Rd., Newark, DE 19711. |
|||||||||||||||||||||||||||||||||||||||||
