 In this post I will list out the All-Time Boston Braves lineup, according to Player Value. I will follow along the same format as MLB uses with its new "All-MLB" teams, which you can view here. That format is 1 player for each defensive position, 5 starters, and 2 relievers. I will only use DHs for AL teams, since most NL teams don't have enough seasons with the DH to really have a deserving player. Importantly, and as the graphic above suggests, these are based on individual seasons according to Player Value. The question we want to ask here is which version of a player would we want on our team? I want to give guys that only played a few seasons with a team an equal chance at making the lineup as the guys that spent their entire careers with one team. If you had to give this NL team a DH spot, you would probably go with Joe Torre in 1965, who was mainly a C. Torre in 1965 has the highest Batting Value season in Milwaukee Braves history not from Mathews, Aaron, Henke, or Johnny Logan, at 28.68. Logan had the higher Batting Value in 1955 at 31.23, but was mainly a SS so a lot of his value is probably from the positional comparison. Torre has the OPS advantage (.862 vs .802) and the Rbat advantage (26 vs 16). Note that Hank Aaron from 1955-1960 and from 1963-1965 actually had the top 9 RF seasons, but I didn't want to have any duplicate players on the all-time team. His best such RF season was 1960, when he had 53.71 Player Value. Aaron in CF in 1962 added more value over Lee Maye in CF in 1964 than Aaron in RF in 1960 did over Bob Hazle in RF in 1957; thus, Aaron stayed in CF and Hazle was slotted in at RF. Here is how the players on the all-time team compare in terms of their Player Value components:  The team is led by Eddie Mathews with a 68 Player Value season, as well as Denis Menke and Hank Aaron with 55+ Player Value seasons. View the file below to see the numerical values of the Player Value components for each player on the all-time team:
View the files below to see the Player Value components, hypothetical awards based on Player Value, and general statistics for each player season and position (if you're wondering how another player that isn't on the all-time team fares, this is the place to look):
And that's it! I'm trying to make these posts shorter and just focus on sharing the all-time teams themselves and necessary data files. If you want to investigate an individual season for a player on the all-time team, I encourage you to check out their page on Baseball Reference.
0 Comments
 In this post I will list out the All-Time Atlanta Braves lineup, according to Player Value. I will follow along the same format as MLB uses with its new "All-MLB" teams, which you can view here. That format is 1 player for each defensive position, 5 starters, and 2 relievers. I will only use DHs for AL teams, since most NL teams don't have enough seasons with the DH to really have a deserving player. Importantly, and as the graphic above suggests, these are based on individual seasons according to Player Value. The question we want to ask here is which version of a player would we want on our team? I want to give guys that only played a few seasons with a team an equal chance at making the lineup as the guys that spent their entire careers with one team. If you had to give this NL team a DH spot, you would probably go with J.D. Drew in 2004, who was mainly a RF. Drew in 2004 has the 6th highest Batting Value season in Atlanta Braves history, at 47.86. The 5 seasons ahead of him are all from players already on the team (Chipper Jones, Evans, Murphy, and Lopez). Drew hit 31 HR and had an OPS of 1.006, along with a stellar 8.3 WAR. Here is how the players on the all-time team compare in terms of their Player Value components:  The team is led by Maddux, Evans, Murphy, and Giles, all of whom had 60+ Player Value seasons. Furcal and Aaron are also close with 58 and 55 Player Value seasons, respectively. View the file below to see the numerical values of the Player Value components for each player on the all-time team:
View the files below to see the Player Value components, hypothetical awards based on Player Value, and general statistics for each player season and position (if you're wondering how another player that isn't on the all-time team fares, this is the place to look):
And that's it! I'm trying to make these posts shorter and just focus on sharing the all-time teams themselves and necessary data files. If you want to investigate an individual season for a player on the all-time team, I encourage you to check out their page on Baseball Reference.
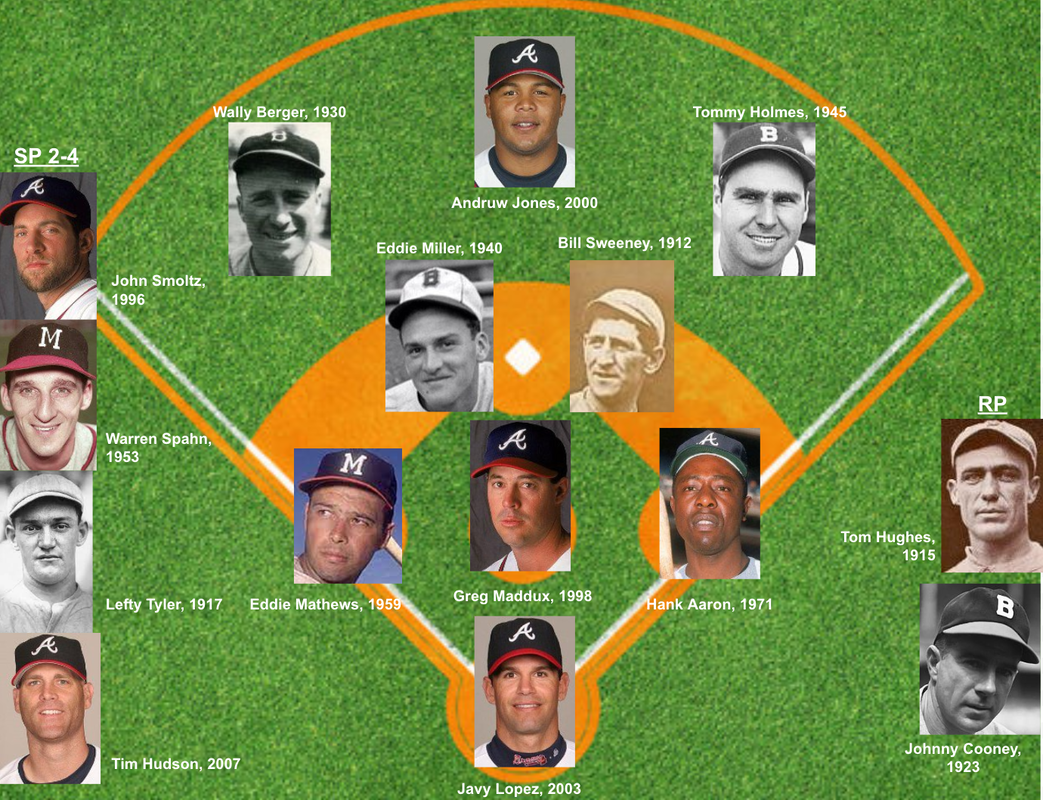 In this post I will list out the All-Time Braves lineup, according to Player Value. I will follow along the same format as MLB uses with its new "All-MLB" teams, which you can view here. That format is 1 player for each defensive position, 5 starters, and 2 relievers. I will only use DHs for AL teams, since most NL teams don't have enough seasons with the DH to really have a deserving player. This includes all years from the Braves franchise since 1912, meaning the Boston Braves/Bees from 1912 to 1952, the Milwaukee Braves from 1943 to 1965, and the Atlanta Braves from 1966 to 2021. You can view the Boston Braves specific all-time team here. You can view the Milwaukee Braves specific all-time team here. You can view the Atlanta Braves specific all-time team here. Importantly, and as the graphic above suggests, these are based on individual seasons according to Player Value. The question we want to ask here is which version of a player would we want on our team? I want to give guys that only played a few seasons with a team an equal chance at making the lineup as the guys that spent their entire careers with one team. If you had to give this NL team a DH spot, you would probably go with Rogers Hornsby in 1928, who was mainly a 2B. Hornsby in 1928 has the highest Batting Value season in Braves history, at 76.13. Part of the reason his Batting Value may be so high is because of the relative comparisons to his 2B positional peers, but he was certainly still absolutely a quality batter across all positions. He earned what is called the "sabermetric Triple Crown" by leading the league in batting average, OBP, and slugging, with a slash line of .387/.498/.632. He also led the league with an OPS of 1.130 and an OPS+ of 202. Bill Sweeney beats out Hornsby for the top 2B spot on the Braves all-time team due to his incredible Fielding Value and Hornsby's minimal Fielding Value. I suspect that my planned improvements to Player Value will sort this out. Note that Hank Aaron in 1962 actually had the top CF season, but I didn't want to have any duplicate players on the all-time team. Furthermore, Wally Berger in 1935 had the 2nd best CF season, so I couldn't use him either, and Hank Aaron in 1961 had the 3rd best CF season. The replacement options were Bob Horner at 1B in 1985, Lonnie Smith in LF in 1989, or Andruw Jones in CF in 2000. It came out that keeping Aaron at 1B and Berger in LF and putting Jones in CF resulted in the highest Player Value for the team. Starting Horner at 1B and putting Aaron in CF was a loss of 10.5 Player Value, starting Smith at LF and putting Berger in CF while keeping Aaron at 1B was a loss of 9.4 Player Value, while starting Jones at CF and keeping Aaron at 1B was the smallest loss at 8.2 Player Value. All-Time Team Total Player Value: 799.2192 (6th in NL, 12th in MLB)
All-Time Team Pitching Value: 194.3122 (10th in NL, 20th in MLB) All-Time Team Fielding Value: 257.7373 (1st in NL, 2nd in MLB) All-Time Team Baserunning Value: 1.5524 (12th in NL, 19th in MLB) The All-Time Braves are one of the better teams in history. Their strongest areas are the great fielding and infield, as well as their pitchers. Interestingly, their pitchers rank not as well when it comes to pitching. What makes them stand out is their ability to hit and play defense, compared to other pitchers. This isn't too shocking, given that the team's ace in Maddux has more Gold Gloves than any other pitchers, and another starter in Warren Spahn was known for his ability with a bat. Lefty Tyler was particularly valuable in batting and fielding, but not so much in pitching. Here is how the players on the all-time team compare in terms of their Player Value components:  The team is led by their middle infield duo of Bill Sweeney and Eddie Miller, who both rate as incredible fielders and both produced 80+ Player Value seasons. View the file below to see the numerical values of the Player Value components for each player on the all-time team:
View the files below to see the Player Value components, hypothetical awards based on Player Value, and general statistics for each player season and position (if you're wondering how another player that isn't on the all-time team fares, this is the place to look):
And that's it! I'm trying to make these posts shorter and just focus on sharing the all-time teams themselves and necessary data files. If you want to investigate an individual season for a player on the all-time team, I encourage you to check out their page on Baseball Reference.
 In this post I will list out the All-Time Miami Marlins lineup, according to Player Value. I will follow along the same format as MLB uses with its new "All-MLB" teams, which you can view here. That format is 1 player for each defensive position, 5 starters, and 2 relievers. I will only use DHs for AL teams, since most NL teams don't have enough seasons with the DH to really have a deserving player. Importantly, and as the graphic above suggests, these are based on individual seasons according to Player Value. The question we want to ask here is which version of a player would we want on our team? I want to give guys that only played a few seasons with a team an equal chance at making the lineup as the guys that spent their entire careers with one team. If you had to give this NL team a DH spot, you would probably go with Gary Sheffield in 1996, who was mainly a RF. Sheffield in 1996 has the highest Batting Value season in Marlins history, at 53.04. Yes, even more than Giancarlo Stanton's MVP year in 2017 (46.99 Batting Value). Stanton may have hit 59 homers compared to Sheffield's 42, but Sheffield struck out just 66 times compared to Stanton's 163 and was walked 142 times compared to Stanton's 85. Sheffield led the league in OBP in 1996 with .465, while Stanton's in 2017 was just .376. However, Stanton did lead the league in slugging in 2017 with .631, compared to Sheffield's .624. Regardless, Sheffield's OPS of 1.090 beats the 1.007 from Stanton. His OPS+ was also higher (189 vs 169), as was his Rbat (72 vs 57). The reason Stanton beats out Sheffield for the starting RF spot comes down to fielding; Stanton had 16.37 Fielding Value while Sheffield had just -11.82. WAR agrees, giving Stanton 11 Rfield while giving Sheffield -16 Rfield, ultimately putting Stanton at 7.9 WAR and Sheffield at 5.9. All-Time Team Total Player Value: 554.7893 (15th in NL, 29th in MLB)
All-Time Team Pitching Value: 185.7958 (11th in NL, 24th in MLB) All-Time Team Fielding Value: 119.2317 (14th in NL, 29th in MLB) All-Time Team Baserunning Value: 0.4642 (14th in NL, 21st in MLB) The All-Time Marlins are unfortunately one of the worst teams in history, and the worst team in NL history. A big reason for that is simply being one of the newest teams, however. Most teams have had since 1912 or sometime in the 1960s for their sample of players, but the Marlins only have since 1993. Not all is woe, though, as they have 2 World Series championships in that timeframe, more than several teams. Their most competitive position group are their pitchers, specifically their starters. Their worst is their catcher and first base combination, though I personally can't critique the Pudge & Delgado duo. Here is how the players on the all-time team compare in terms of their Player Value components:  The team is led by Ramirez and Stanton, both with 60+ Player Value seasons. Kevin Brown and Dee Strange-Gordon are also towards the top with 50+ Player Value seasons. Such a high Player Value is less common for pitchers, so Brown may have had the most uniquely valuable season. View the file below to see the numerical values of the Player Value components for each player on the all-time team:
View the files below to see the Player Value components, hypothetical awards based on Player Value, and general statistics for each player season and position (if you're wondering how another player that isn't on the all-time team fares, this is the place to look):
And that's it! I'm trying to make these posts shorter and just focus on sharing the all-time teams themselves and necessary data files. If you want to investigate an individual season for a player on the all-time team, I encourage you to check out their page on Baseball Reference. Well... maybe a little more. I'm doing those posts for each MLB franchise, but will also be doing ones for certain historic teams that no longer exists, such as the Washington Senators and Montreal Expos. I initially also did this for the Florida Marlins and Miami Marlins. I've since decided that these really aren't two distinct teams, as they have the same nickname (Marlins) and are located in the same city, despite changing the place name from Florida to Miami and changing their color scheme. Nonetheless, sense I already put in the work of this split, I will share those results here. Here's what the All-Time Florida Marlins (1993-2011) team looks like: 
And here's what the All-Time Miami Marlins (2012-2021) team currently looks like: 
If I included the 2022 season, obviously there's a good chance that Alcantara becomes that version of himself, and likely becomes the team's ace.
 In this post I will list out the All-Time New York Mets lineup, according to Player Value. I will follow along the same format as MLB uses with its new "All-MLB" teams, which you can view here. That format is 1 player for each defensive position, 5 starters, and 2 relievers. I will only use DHs for AL teams, since most NL teams don't have enough seasons with the DH to really have a deserving player. Importantly, and as the graphic above suggests, these are based on individual seasons according to Player Value. The question we want to ask here is which version of a player would we want on our team? I want to give guys that only played a few seasons with a team an equal chance at making the lineup as the guys that spent their entire careers with one team. If you had to give this NL team a DH spot, you would probably go with Howard Johnson in 1989, who was mainly a 3B. Johnson in 1989 has the 4th highest Batting Value season in Mets history, at 45.72. All 3 of the seasons ahead of him are from players already on the All-Time team (Alfonzo, Beltran, and Strawberry). An honorable mention goes out to Mike Piazza in 2000, who placed 5th with a Batting Value of 40.99. Piazza had more HRs (38 vs 36) and a higher OPS (1.012 vs ,928) than Johnson, but the even more advanced metrics like OPS+, Rbat, and, well, Batting Value, favor Johnson. All-Time Team Total Player Value: 643.4246 (10th in NL, 22nd in MLB)
All-Time Team Pitching Value: 210.0325 (6th in NL, 16th in MLB) All-Time Team Fielding Value: 106.0489 (15th in NL, 30th in MLB) All-Time Team Baserunning Value: 7.1698 (7th in NL, 8th in MLB) The All-Time Mets are one of the more mediocre teams in history. They are the worst defensive team in history, and their position players rate pretty poorly across the board. They do rank as one of the better baserunning teams, but that is the smallest piece of Player Value. Their pitchers rate well in the NL, but come out as average across MLB as a whole. Gary Carter accounts for nearly 20% of the Mets' total Fielding Value. Here is how the players on the all-time team compare in terms of their Player Value components:  The team is led by Beltran and Alfonzo, both with 60+ Player Value seasons. Carter and Strawberry are also towards the top with 50+ Player Value seasons. View the file below to see the numerical values of the Player Value components for each player on the all-time team:
View the files below to see the Player Value components, hypothetical awards based on Player Value, and general statistics for each player season and position (if you're wondering how another player that isn't on the all-time team fares, this is the place to look):
And that's it! I'm trying to make these posts shorter and just focus on sharing the all-time teams themselves and necessary data files. If you want to investigate an individual season for a player on the all-time team, I encourage you to check out their page on Baseball Reference.
 In this post I will list out the All-Time Philadelphia Phillies lineup, according to Player Value. I will follow along the same format as MLB uses with its new "All-MLB" teams, which you can view here. That format is 1 player for each defensive position, 5 starters, and 2 relievers. I will only use DHs for AL teams, since most NL teams don't have enough seasons with the DH to really have a deserving player. Importantly, and as the graphic above suggests, these are based on individual seasons according to Player Value. The question we want to ask here is which version of a player would we want on our team? I want to give guys that only played a few seasons with a team an equal chance at making the lineup as the guys that spent their entire careers with one team. If you had to give this NL team a DH spot, you would probably go with Dick Allen in 1966, who was mainly a 3B. Allen in 1966 has the 5th highest Batting Value season in Phillies history since 1912, at 52.69. Of the 4 seasons ahead of him, 3 of them are from players already on the All-Time team (O'Doul, Schmidt, and Klein). The 4th highest Batting Value season is Lenny Dykstra in 1993 with 56.77. However, Dykstra was mainly a CF, so a lot of his Batting Value comes from being compared to other centerfielders. For the DH spot that comparison doesn't come into play since we don't really care about fielding ability. In an absolute sense, Allen in 1966 was clearly the superior hitter to Dykstra in 1993: 1.027 vs .902 OPS, .437 vs .400 wOBA, 40 vs 19 HR, 110 vs 66 RBI, etc. All-Time Team Total Player Value: 815.5191 (5th in NL, 10th in MLB)
All-Time Team Pitching Value: 236.9955 (2nd in NL, 8th in MLB) All-Time Team Fielding Value: 205.3182 (5th in NL, 12th in MLB) All-Time Team Baserunning Value: 10.4205 (2nd in NL, 3rd in MLB) The All-Time Phillies are one of the better teams in history. They are terrific at pitching and baserunning, and still solid at batting and fielding. Their starting rotation consists of 4 Hall of Famers. Many great Phillie pitchers like Cliff Lee, Curt Schilling, Roy Halladay, and Zack Wheeler failed to make the team due to how top heavy their hurlers are. Their outfield is also one of the best in history, with 2 Hall of Famers. Their biggest weakness would be their catcher and first baseman, though that unit stills ranks as about average. Here is how the players on the all-time team compare in terms of their Player Value components:  The team is led by their great outfielders in Klein and Ashburn, who both had 80+ Player Value seasons. Hall of Fame legends Schmidt and Alexander also lead the way, both with 78 Player Value seasons, and both of which rank as the 5th highest at their position across all teams since 1912. Pete Alexander's season is probably the most impressive though, as a pitcher gaining that much Player Value is extremely rare. View the file below to see the numerical values of the Player Value components for each player on the all-time team:
View the files below to see the Player Value components, hypothetical awards based on Player Value, and general statistics for each player season and position (if you're wondering how another player that isn't on the all-time team fares, this is the place to look):
And that's it! I'm trying to make these posts shorter and just focus on sharing the all-time teams themselves and necessary data files. If you want to investigate an individual season for a player on the all-time team, I encourage you to check out their page on Baseball Reference.
 In this post I will list out the All-Time Milwaukee Brewers lineup, according to Player Value. I will follow along the same format as MLB uses with its new "All-MLB" teams, which you can view here. That format is 1 player for each defensive position, 5 starters, and 2 relievers. I will only use DHs for AL teams, since most NL teams don't have enough seasons with the DH to really have a deserving player. Also note that this includes all years of the Milwaukee Brewers franchise, including their 1969 season as the Seattle Pilots, even though no players from the Pilots actually made it on the all-time team. The highest rated Pilots player was Don Mincher, who accrued 18.02 Player Value as mainly a 1B in 1969. The highest rated Pilots pitcher was reliever John Gelnar, who had 3.41 Player Value in 1969. Importantly, and as the graphic above suggests, these are based on individual seasons according to Player Value. The question we want to ask here is which version of a player would we want on our team? I want to give guys that only played a few seasons with a team an equal chance at making the lineup as the guys that spent their entire careers with one team. I went ahead and gave the Brewers an actual DH spot on their all-time team since they were an AL team from 1969-1997, despite being an NL team currently. Note that Robin Yount in 1989 actually had the top CF season, but I didn't want to have any duplicate players on the all-time team. Yount at SS in 1982 added more value over Jean Segura at SS in 2013 than Yount in CF in 1989 did over Gomez in CF in 2013; thus, Yount stayed at SS and Gomez was slotted in at CF. All-Time Team Total Player Value: 652.9810 (9th in NL, 21st in MLB)
All-Time Team Fielding Value: 142.2919 (12th in NL, 26th in MLB) All-Time Team Baserunning Value: 7.7562 (4th in NL, 5th in MLB) The All-Time Brewers are below average overall. They rank particularly poorly in Pitching and Fielding, but are closer to average when it comes to Batting. Their Baserunning is solid, but this is the smallest piece of Player Value. Their position players generally rank better than their pitchers, but no particular positional group rates significantly higher than the others. Here is how the players on the all-time team compare in terms of their Player Value components:  The team is led by Yount with about 77 Player Value, as well as Vina and Braun with 70 and 66 Player Value, respectively. View the file below to see the numerical values of the Player Value components for each player on the all-time team:
View the files below to see the Player Value components, hypothetical awards based on Player Value, and general statistics for each player season and position (if you're wondering how another player that isn't on the all-time team fares, this is the place to look):
And that's it! I'm trying to make these posts shorter and just focus on sharing the all-time teams themselves and necessary data files. If you want to investigate an individual season for a player on the all-time team, I encourage you to check out their page on Baseball Reference.
|
|||||||||||||||||||||||||||||||||||||||||||||||||||||||||||||||||||||||||||||||||||||||||||||||||||||||||||||||||||||||||||||||||||||||||||||||||||||||||||||||||
