 In this post I will list out the All-Time San Francisco Giants lineup, according to Player Value. I will follow along the same format as MLB uses with its new "All-MLB" teams, which you can view here. That format is 1 player for each defensive position, 5 starters, and 2 relievers. I will only use DHs for AL teams, since most NL teams don't have enough seasons with the DH to really have a deserving player. Importantly, and as the graphic above suggests, these are based on individual seasons according to Player Value. The question we want to ask here is which version of a player would we want on our team? I want to give guys that only played a few seasons with a team an equal chance at making the lineup as the guys that spent their entire careers with one team. If you had to give this NL team a DH spot, you would probably go with Kevin Mitchell in 1989, who was mainly a LF. Mitchell in 1989 has the highest Batting Value season of any player not already on the all-time team, at 42.64. He hit 47 HR, 125 RBI, had a 1.023 OPS, and a 192 OPS+, all of which led the league. He also won the NL MVP in 1989. Here is how the players on the all-time team compare in terms of their Player Value components: 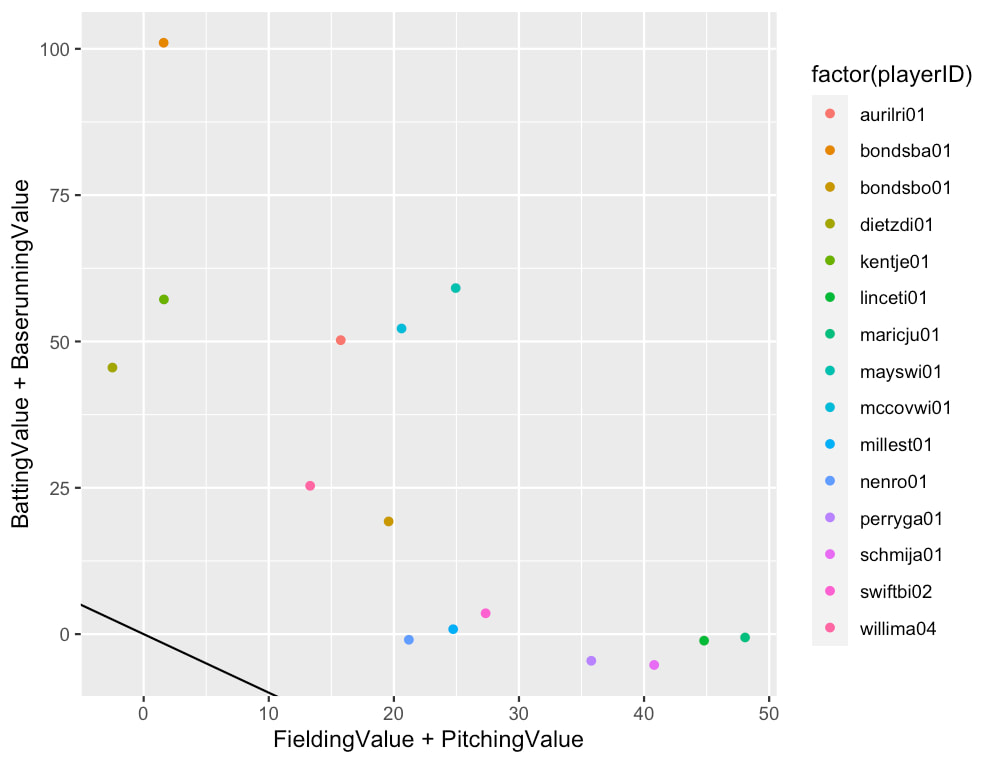 The team is led by all around superstars Bonds and Mays with 103 and 84 Player Value, respectively. View the file below to see the numerical values of the Player Value components for each player on the all-time team:
View the files below to see the Player Value components, hypothetical awards based on Player Value, and general statistics for each player season and position (if you're wondering how another player that isn't on the all-time team fares, this is the place to look):
And that's it! I'm trying to make these posts shorter and just focus on sharing the all-time teams themselves and necessary data files. If you want to investigate an individual season for a player on the all-time team, I encourage you to check out their page on Baseball Reference.
0 Comments
 In this post I will list out the All-Time Giants lineup, according to Player Value. I will follow along the same format as MLB uses with its new "All-MLB" teams, which you can view here. That format is 1 player for each defensive position, 5 starters, and 2 relievers. I will only use DHs for AL teams, since most NL teams don't have enough seasons with the DH to really have a deserving player. This includes all years from the Giants franchise since 1912, meaning the New York Giants from 1912 to 1957 and the San Francisco Giants from 1958 to 2021. You can view the New York Giants specific all-time team here. You can view the San Francisco Giants specific all-time team here. Importantly, and as the graphic above suggests, these are based on individual seasons according to Player Value. The question we want to ask here is which version of a player would we want on our team? I want to give guys that only played a few seasons with a team an equal chance at making the lineup as the guys that spent their entire careers with one team. If you had to give this NL team a DH spot, you would probably go with either Jeff Kent in 2000, who was mainly a 2B, or Willie McCovey in 1969, who was mainly a 1B. Kent has the highest Batting Value season by a player not already on the all-time team, at 58.99. McCovey's Batting Value is the 2nd most in a season by a player not already on the all-time team, at 52.21. Kent's Batting Value is probably higher than McCovey's due to the positional comparison; relative to other 2B, Kent was more valuable than McCovey was relative to other 1B. But since we're talking about using one of these guys as the DH, such relative value is not as important. In an absolute sense, McCovey was perhaps the better hitter. Jeff Kent won the NL MVP in 2000 and hit 33 HR with 125 RBI and a .solid 334/.424/.596/1.021 line, along with a 162 OPS+ and 58 Rbat. McCovey won the NL MVP in 1969 and hit 45 HR with 126 RBI and a .320/.453/.656/1.108 line, along with a 209 OPS+ and 67 Rbat. Note that Mel Ott in 1938 actually had the top 3B season, but I didn't want to have any duplicate players on the all-time team. Ott in RF in 1929 provided more value over Ross Youngs in RF in 1920 than Ott at 3B in 1938 provided over Freddie Lindstrom at 3B in 1928. Thus, Ott was kept in RF and Lindstrom was inserted at 3B. All-Time Team Total Player Value: 870.6469 (1st in NL, 3rd in MLB)
All-Time Team Pitching Value: 236.5404 (3rd in NL, 9th in MLB) All-Time Team Fielding Value: 206.1150 (4th in NL, 11th in MLB) All-Time Team Baserunning Value: 7.7277 (5th in NL, 6th in MLB) The All-Time Giants are one of the best teams in history, and the best in the NL. Their outfield unit also ranks as the best in NL history, and includes 3 members of the 500 home run club. When Ott retired in 1947, he was 3rd on the all-time HR list, with 511, and the all-time NL HR leader. Mays would become the all-time NL HR leader in 1966, and retired with 660 in 1973 for the 3rd most all-time. Bonds retired in 2008 with 762 home runs, the all-time NL and MLB leader. The Giants all-time outfield is simply unreal. The Giants all-time team doesn't really have a weakness, much their worst area are their pitchers, who rank average. Here is how the players on the all-time team compare in terms of their Player Value components:  The team is led by all around superstars Bonds and Mays with 103 and 84 Player Value respectively, as well as by Hall of Fame middle infielders Jackson and Hornsby, also with 84 Player Value each. View the file below to see the numerical values of the Player Value components for each player on the all-time team:
View the files below to see the Player Value components, hypothetical awards based on Player Value, and general statistics for each player season and position (if you're wondering how another player that isn't on the all-time team fares, this is the place to look):
And that's it! I'm trying to make these posts shorter and just focus on sharing the all-time teams themselves and necessary data files. If you want to investigate an individual season for a player on the all-time team, I encourage you to check out their page on Baseball Reference.
 In this post I will list out the All-Time Brooklyn Dodgers lineup, according to Player Value. I will follow along the same format as MLB uses with its new "All-MLB" teams, which you can view here. That format is 1 player for each defensive position, 5 starters, and 2 relievers. I will only use DHs for AL teams, since most NL teams don't have enough seasons with the DH to really have a deserving player. This includes all years from the Dodgers franchise while they were in Brooklyn since 1912, meaning the Brooklyn Trolley Dodgers in 1912, the Brooklyn Dodgers in 1913, the Brooklyn Robins from 1914 to 1931, and the Brooklyn Dodgers again from 1932 to 1957. Importantly, and as the graphic above suggests, these are based on individual seasons according to Player Value. The question we want to ask here is which version of a player would we want on our team? I want to give guys that only played a few seasons with a team an equal chance at making the lineup as the guys that spent their entire careers with one team. If you had to give this NL team a DH spot, you would probably go with Jack Fournier in 1924, who was mainly a 1B. Fournier in 1924 has the highest Batting Value season by a player not already on the all-time team at 44.78. He led the league in HR with 27, and had a .965 OPS. Here is how the players on the all-time team compare in terms of their Player Value components:  The team is led by color-line-breaking greats of Roy Campanella and Jackie Robinson, both of whom produced 80+ Player Value seasons. View the file below to see the numerical values of the Player Value components for each player on the all-time team:
View the files below to see the Player Value components, hypothetical awards based on Player Value, and general statistics for each player season and position (if you're wondering how another player that isn't on the all-time team fares, this is the place to look):
And that's it! I'm trying to make these posts shorter and just focus on sharing the all-time teams themselves and necessary data files. If you want to investigate an individual season for a player on the all-time team, I encourage you to check out their page on Baseball Reference.
 In this post I will list out the All-Time Los Angeles Dodgers lineup, according to Player Value. I will follow along the same format as MLB uses with its new "All-MLB" teams, which you can view here. That format is 1 player for each defensive position, 5 starters, and 2 relievers. I will only use DHs for AL teams, since most NL teams don't have enough seasons with the DH to really have a deserving player. Importantly, and as the graphic above suggests, these are based on individual seasons according to Player Value. The question we want to ask here is which version of a player would we want on our team? I want to give guys that only played a few seasons with a team an equal chance at making the lineup as the guys that spent their entire careers with one team. If you had to give this NL team a DH spot, you would probably go with Gary Sheffield in 2000, who was mainly a LF. Sheffield in 2000 has the highest Batting Value season of any player not already on the all-time team, at 43.69. He hit 43 HR with a 1.081 OPS. Here is how the players on the all-time team compare in terms of their Player Value components:  The team is led by Mike Piazza, whose 84 Player Value far surpasses that of any of his teammates. Koufax and Beltre are next in line with 60+ Player Value seasons. View the file below to see the numerical values of the Player Value components for each player on the all-time team:
View the files below to see the Player Value components, hypothetical awards based on Player Value, and general statistics for each player season and position (if you're wondering how another player that isn't on the all-time team fares, this is the place to look):
And that's it! I'm trying to make these posts shorter and just focus on sharing the all-time teams themselves and necessary data files. If you want to investigate an individual season for a player on the all-time team, I encourage you to check out their page on Baseball Reference.
 In this post I will list out the All-Time Dodgers lineup, according to Player Value. I will follow along the same format as MLB uses with its new "All-MLB" teams, which you can view here. That format is 1 player for each defensive position, 5 starters, and 2 relievers. I will only use DHs for AL teams, since most NL teams don't have enough seasons with the DH to really have a deserving player. This includes all years from the Dodgers franchise since 1912, meaning the Brooklyn Dodgers/Robins from 1912 to 1957 and the Los Angeles Dodgers from 1958 to 2021. You can view the Brooklyn Dodgers specific all-time team here. You can view the Los Angeles Dodgers specific all-time team here. Importantly, and as the graphic above suggests, these are based on individual seasons according to Player Value. The question we want to ask here is which version of a player would we want on our team? I want to give guys that only played a few seasons with a team an equal chance at making the lineup as the guys that spent their entire careers with one team. If you had to give this NL team a DH spot, you would probably go with Mike Piazza in 1997, who was mainly a C. Piazza in 1997 has the 2nd highest Batting Value season in Dodgers history, at 65.62. The only Dodger with more Batting Value is Duke Snider in 1953, who is already on the all-time team. Even though Piazza was a catcher and likely benefitted from the positional comparison, he was a stellar hitter in 1997 regardless of his position. He hit 40 HR with an impressive 1.070 OPS, and led the league with a 185 OPS+. All-Time Team Total Player Value: 865.4705 (2nd in NL, 4th in MLB)
All-Time Team Pitching Value: 253.6216 (1st in NL, 4th in MLB) All-Time Team Fielding Value: 181.4807 (6th in NL, 16th in MLB) All-Time Team Baserunning Value: 7.5656 (6th in NL, 7th in MLB) The All-Time Dodgers are one of the best teams in history. Their pitchers, both the starting rotation and the bullpen, are exceptional. And that's not even including other great Dodger hurlers such as Clayton Kershaw, Don Sutton, Orel Hershiser, Dazzy Vance, or Fernando Valenzuela. While their fielding is closer to average, their batting and baserunning are top notch. The Hall of Fame duo of Campanella and Hodges at C and 1B is one of the best in history, and is particularly impressive given that these guys actually played with each other. Here is how the players on the all-time team compare in terms of their Player Value components:  The team is led by color-line-breaking greats of Roy Campanella and Jackie Robinson, both of whom produced 80+ Player Value seasons. View the file below to see the numerical values of the Player Value components for each player on the all-time team:
View the files below to see the Player Value components, hypothetical awards based on Player Value, and general statistics for each player season and position (if you're wondering how another player that isn't on the all-time team fares, this is the place to look):
And that's it! I'm trying to make these posts shorter and just focus on sharing the all-time teams themselves and necessary data files. If you want to investigate an individual season for a player on the all-time team, I encourage you to check out their page on Baseball Reference.
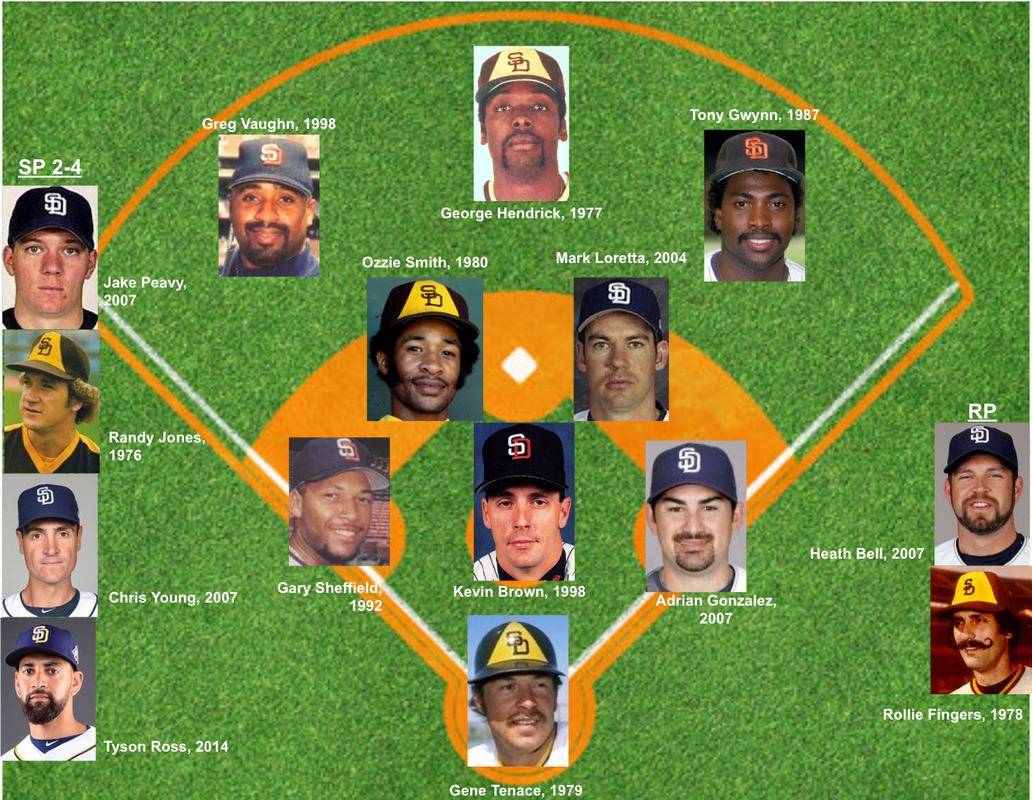 In this post I will list out the All-Time San Diego Padres lineup, according to Player Value. I will follow along the same format as MLB uses with its new "All-MLB" teams, which you can view here. That format is 1 player for each defensive position, 5 starters, and 2 relievers. I will only use DHs for AL teams, since most NL teams don't have enough seasons with the DH to really have a deserving player. Importantly, and as the graphic above suggests, these are based on individual seasons according to Player Value. The question we want to ask here is which version of a player would we want on our team? I want to give guys that only played a few seasons with a team an equal chance at making the lineup as the guys that spent their entire careers with one team. If you had to give this NL team a DH spot, you would probably go with Fernando Tatis Jr. in 2021, who was mainly a SS. Tatis in 2021 has the 3rd highest Batting Value season in Padres history, at 41.59. The only players with more were Gary Sheffield in 1992 and Tony Gwynn in 1987, both of whom are already on the all-time team. While SS normally get a Batting Value boost from the positional comparison, Tatis was truly an exceptional hitter in 2021 regardless of his position. He led the league in HR with 42 and had an impressive .975 OPS and 166 OPS+. An honorable mention for the DH spot could go to Ken Caminiti in 1996, who had 39.97 Batting Value as a 3B. He hit 40 HR with a 1.028 OPS and a 174 OPS+. There is no doubt that Trevor Hoffman provided more Player Value over his career as a Padre than Heath Bell or Rollie Fingers; these are just the results from an individual seasons. Hoffman does have the 2nd and 3rd best RP seasons when it comes to Pitching Value, with Bell in 1st and Fingers in 4th. The reason that Fingers passed both of those Hoffman seasons (1996 and 1998) was because of Batting Value and Fielding Value. All-Time Team Total Player Value: 589.1875 (13th in NL, 27th in MLB)
All-Time Team Pitching Value: 201.4132 (7th in NL, 17th in MLB) All-Time Team Fielding Value: 161.8089 (10th in NL, 21st in MLB) All-Time Team Baserunning Value: 9.7153 (3rd in NL, 4th in MLB) The All-Time Padres are unfortunately one of the worst teams in history. Their baserunning ranks as one of the best, but this is the smallest component of Player Value. While their pitchers only rank slightly below average, each of their position player groups are towards the bottom. Here is how the players on the all-time team compare in terms of their Player Value components:  The team is led by Gary Sheffield and Tony Gwynn, who both produced 59+ Player Value seasons. View the file below to see the numerical values of the Player Value components for each player on the all-time team:
View the files below to see the Player Value components, hypothetical awards based on Player Value, and general statistics for each player season and position (if you're wondering how another player that isn't on the all-time team fares, this is the place to look):
And that's it! I'm trying to make these posts shorter and just focus on sharing the all-time teams themselves and necessary data files. If you want to investigate an individual season for a player on the all-time team, I encourage you to check out their page on Baseball Reference.
 In this post I will list out the All-Time Montreal Expos lineup, according to Player Value. I will follow along the same format as MLB uses with its new "All-MLB" teams, which you can view here. That format is 1 player for each defensive position, 5 starters, and 2 relievers. I will only use DHs for AL teams, since most NL teams don't have enough seasons with the DH to really have a deserving player. Importantly, and as the graphic above suggests, these are based on individual seasons according to Player Value. The question we want to ask here is which version of a player would we want on our team? I want to give guys that only played a few seasons with a team an equal chance at making the lineup as the guys that spent their entire careers with one team. If you had to give this NL team a DH spot, you would probably go with Rusty Staub in 1969, who was mainly a RF. Staub in the inaugural Expos seaosn has the 5th highest Batting Value season in Expos history, at 35.05. The 4 seasons ahead of him are all from players already on the team (Guerrero, Vidro, and Carter). Staub just beat out fellow Expos RF Larry Walker in 1992, who had 34.04 Batting Value. Here is how the players on the all-time team compare in terms of their Player Value components:  The team is mainly led by Gary Carter's 65 Player Value season, but Dawson, Vidro, and Guerrero also led with 50+ Player Value seasons. View the file below to see the numerical values of the Player Value components for each player on the all-time team:
View the files below to see the Player Value components, hypothetical awards based on Player Value, and general statistics for each player season and position (if you're wondering how another player that isn't on the all-time team fares, this is the place to look):
And that's it! I'm trying to make these posts shorter and just focus on sharing the all-time teams themselves and necessary data files. If you want to investigate an individual season for a player on the all-time team, I encourage you to check out their page on Baseball Reference.
 In this post I will list out the All-Time Washington Nationals lineup, according to Player Value. I will follow along the same format as MLB uses with its new "All-MLB" teams, which you can view here. That format is 1 player for each defensive position, 5 starters, and 2 relievers. I will only use DHs for AL teams, since most NL teams don't have enough seasons with the DH to really have a deserving player. Importantly, and as the graphic above suggests, these are based on individual seasons according to Player Value. The question we want to ask here is which version of a player would we want on our team? I want to give guys that only played a few seasons with a team an equal chance at making the lineup as the guys that spent their entire careers with one team. If you had to give this NL team a DH spot, you would probably go with Anthony Rendon in 2019, who was mainly a 3B. Rnedon in 2019 has the 4th highest Batting Value season in Washington Nationals history, at 38.33. Two of the three seasons ahead of him are from players already on the team (Harper and Soto). The other season ahead of him is from Daniel Murphy, but was his 2016 season. Murphy in 2017 ranks higher overall due to his higher Fielding Value that season. Rendon also barely falls behind Zimmerman for the starting 3B spot due to Zimmerman's higher Fielding Value. Here is how the players on the all-time team compare in terms of their Player Value components:  The team is led by Harper and Soto, with 63 and 56 Player Value seasons, respectively. View the file below to see the numerical values of the Player Value components for each player on the all-time team:
View the files below to see the Player Value components, hypothetical awards based on Player Value, and general statistics for each player season and position (if you're wondering how another player that isn't on the all-time team fares, this is the place to look):
And that's it! I'm trying to make these posts shorter and just focus on sharing the all-time teams themselves and necessary data files. If you want to investigate an individual season for a player on the all-time team, I encourage you to check out their page on Baseball Reference.
 In this post I will list out the All-Time Nationals lineup, according to Player Value. I will follow along the same format as MLB uses with its new "All-MLB" teams, which you can view here. That format is 1 player for each defensive position, 5 starters, and 2 relievers. I will only use DHs for AL teams, since most NL teams don't have enough seasons with the DH to really have a deserving player. This includes all years from the Nationals franchise since its inception in 1969, meaning the Montreal Expos from 1969 to 2004 and the Washington Nationals from 2005 to 2021. You can view the Montreal Expos specific all-time team here. You can view the Washington Nationals specific all-time team here. You can also view the Washington Senators specific all-time team here. The Senators were never actually a part of the current Nationals franchise, but rather went on to become the Twins and Rangers franchises. However, they were the primary baseball team in Washington for 70 years and were even technically called the Washington Nationals from 1905-1955, despite the name never really being recognized. The more standard typed W is the more famous Senators logo, but the Senators in the 1960s used the cursive W that is essentially used by the Nationals today. Importantly, and as the graphic above suggests, these are based on individual seasons according to Player Value. The question we want to ask here is which version of a player would we want on our team? I want to give guys that only played a few seasons with a team an equal chance at making the lineup as the guys that spent their entire careers with one team. If you had to give this NL team a DH spot, you would probably go with (my favorite player ever) Vladimir Guerrero in 2000, who was mainly a RF. Vlad in 2000 has the 2nd highest Batting Value season in Nationals franchise history, at 48.10. The only player with more is Bryce Harper in 2015 with 57.24, which is unfortunately why Vlad is not on the all-time team. Vlad has the 6th highest Player Value in a season in the franchise's history, at 50.53. All-Time Team Total Player Value: 635.4446 (11th in NL, 25th in MLB)
All-Time Team Pitching Value: 212.2582 (5th in NL, 15th in MLB) All-Time Team Fielding Value: 165.2201 (9th in NL, 20th in MLB) All-Time Team Baserunning Value: 0.9491 (13th in NL, 20th in MLB) The All-Time Nationals fall towards the bottom of teams in history. Their outfield and catcher/first base units rank fairly average, but their pitchers rank towards the bottom and their infielders fare even worse. Interestingly, their pitchers rank average in terms of pitching, but don't rate as well when considering their ability to hit and play defense. Here is how the players on the all-time team compare in terms of their Player Value components: 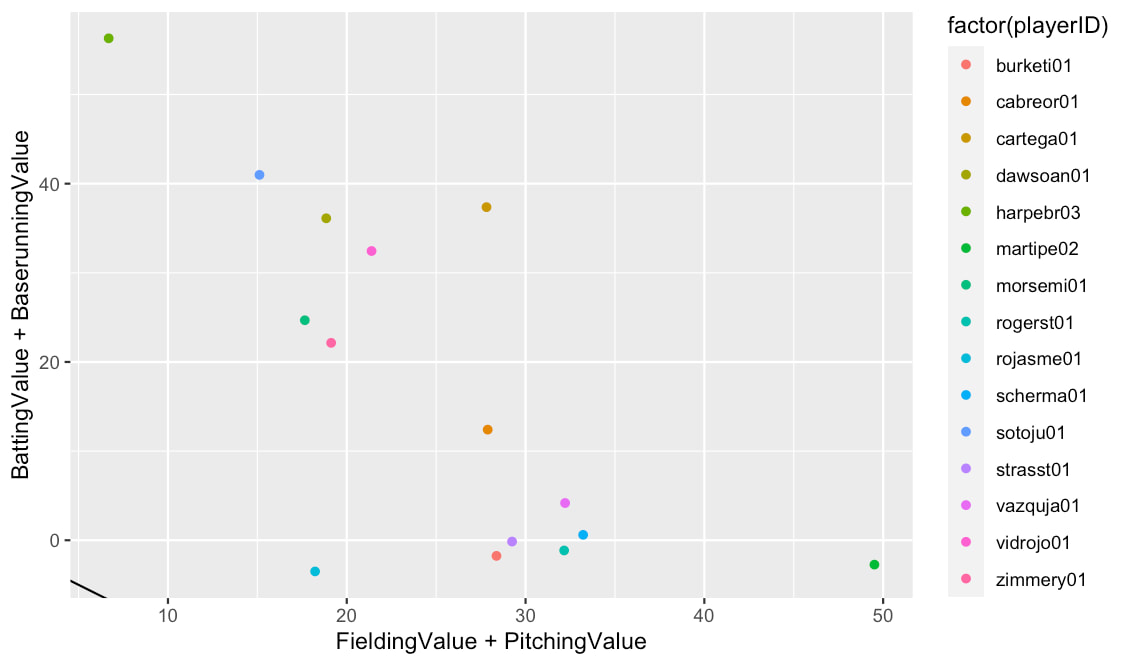 The team is led by Gary Carter and Bryce Harper, who both produced 60+ Player Value seasons. View the file below to see the numerical values of the Player Value components for each player on the all-time team:
View the files below to see the Player Value components, hypothetical awards based on Player Value, and general statistics for each player season and position (if you're wondering how another player that isn't on the all-time team fares, this is the place to look):
And that's it! I'm trying to make these posts shorter and just focus on sharing the all-time teams themselves and necessary data files. If you want to investigate an individual season for a player on the all-time team, I encourage you to check out their page on Baseball Reference.
 In this post I will list out the All-Time Boston Braves lineup, according to Player Value. I will follow along the same format as MLB uses with its new "All-MLB" teams, which you can view here. That format is 1 player for each defensive position, 5 starters, and 2 relievers. I will only use DHs for AL teams, since most NL teams don't have enough seasons with the DH to really have a deserving player. This includes all years from the Braves franchise while they were in Boston since 1912, meaning the Boston Braves from 1912 to 1935, the Boston Bees from 1936 to 1940, and the Boston Braves again from 1941 to 1952. Importantly, and as the graphic above suggests, these are based on individual seasons according to Player Value. The question we want to ask here is which version of a player would we want on our team? I want to give guys that only played a few seasons with a team an equal chance at making the lineup as the guys that spent their entire careers with one team. If you had to give this NL team a DH spot, you would probably go with Rogers Hornsby in 1928, who was mainly a 2B. Hornsby in 1928 has the highest Batting Value season in Braves history, at 76.13. Part of the reason his Batting Value may be so high is because of the relative comparisons to his 2B positional peers, but he was certainly still absolutely a quality batter across all positions. He earned what is called the "sabermetric Triple Crown" by leading the league in batting average, OBP, and slugging, with a slash line of .387/.498/.632. He also led the league with an OPS of 1.130 and an OPS+ of 202. Bill Sweeney beats out Hornsby for the top 2B spot on the Braves all-time team due to his incredible Fielding Value and Hornsby's minimal Fielding Value. I suspect that my planned improvements to Player Value will sort this out. Note that Wally Berger in 1930 actually had the top LF season, but I didn't want to have any duplicate players on the all-time team. Berger in CF in 1935 added more value over Tommy Holmes in CF in 1944 than Berger in LF in 1930 did over Sid Gordon in LF in 1950; thus, Berger stayed in CF and Gordon was slotted in at LF. Similarly, Johnny Cooney is 1924 also had the actual 3rd best SP season. However, Cooney as a RP in 1923 added more value over Ben Cantwell at RP in 1932 than Cooney as a SP in 1924 did over Art Nehf at SP in 1917; thus, Cooney stayed at RP and Nehf was inserted at SP. Here is how the players on the all-time team compare in terms of their Player Value components:  The team is led by their middle infield duo of Bill Sweeney and Eddie Miller, who both rate as incredible fielders and both produced 80+ Player Value seasons. View the file below to see the numerical values of the Player Value components for each player on the all-time team:
View the files below to see the Player Value components, hypothetical awards based on Player Value, and general statistics for each player season and position (if you're wondering how another player that isn't on the all-time team fares, this is the place to look):
And that's it! I'm trying to make these posts shorter and just focus on sharing the all-time teams themselves and necessary data files. If you want to investigate an individual season for a player on the all-time team, I encourage you to check out their page on Baseball Reference.
|
|||||||||||||||||||||||||||||||||||||||||||||||||||||||||||||||||||||||||||||||||||||||||||||||||||||||||||||||||||||||||||||||||||||||||||||||||||||||||||||||||||||||||||||||||||||||||||||||||||||||||||||||||||||||||||||
