 In this post I will list out the All-Time Kansas City Athletics lineup, according to Player Value. I will follow along the same format as MLB uses with its new "All-MLB" teams, which you can view here. That format is 1 player for each defensive position, 5 starters, and 2 relievers. I will only use DHs for AL teams, since most NL teams don't have enough seasons with the DH to really have a deserving player. Importantly, and as the graphic above suggests, these are based on individual seasons according to Player Value. The question we want to ask here is which version of a player would we want on our team? I want to give guys that only played a few seasons with a team an equal chance at making the lineup as the guys that spent their entire careers with one team. The AL did not have a DH until 1973. If you gave this earlier AL team a DH, you'd probably go with LF Elmer Valo in 1955, RF Rocky Colavito in 1964, or 1B Vic Power in 1956. They have the 3 highest Batting Value seasons from players not already on the all-time team, with 21.96, 18.74, and 15.19, respectively. Valo had a shorter season and played in just 112 games, only hitting 3 HR with 37 RBI, but posted an impressive .944 OPS. Colavito hit 34 HR with 102 RBI, along with a .873 OPS. Power hit 14 HR with 63 RBI and had a .787 OPS. The Kansas City Athletics are just a weird team. Before doing this, I had no familiarity with their uniforms or even what players had played for them. They are very similar to the Milwaukee Braves - northeast team relocates to the midwest for 13 years, then jumps ship again to its current location - but the Braves are much better remembered. For one, the Braves had a .563 winning percentage and won 2 NL pennants and a World Series while in Milwaukee. The Athletics had a .404 winning percentage and never made the playoffs while in Kansas City. They didn't even have a single winning season. The Braves uniforms in Milwaukee were much similar to what they still are today, while the A's uniforms are much different today than they were in KC. The Braves were full of future Hall of Famers - Hank Aaron, Warren Spahn, Eddie Mathews - as well as other great players like Del Crandall and Joe Torre. The Athletics were less stacked in Kansas City, and Catfish Hunter looks like a psychopath without a mustache! He was only there for their final 3 seasons. Some other future mainly Oakland players like Sal Bando and Bert Campaneris also started in Kansas City. The only other guy of note is Roger Maris, who was only in Kansas City for a year and a half. Afterwards he went to the Yankees and won back-to-back MVP awards. Jorge Posada's uncle, Leo Posada, also played for the Athletics in Kansas City, as did Hall of Fame manager Tony La Russa. Here is how the players on the all-time team compare in terms of their Player Value components:  The team is led by Jerry Lumpe and Norm Siebern, both with 50+ Player Value seasons. View the file below to see the numerical values of the Player Value components for each player on the all-time team:
View the files below to see the Player Value components, hypothetical awards based on Player Value, and general statistics for each player season and position (if you're wondering how another player that isn't on the all-time team fares, this is the place to look):
And that's it! I'm trying to make these posts shorter and just focus on sharing the all-time teams themselves and necessary data files. If you want to investigate an individual season for a player on the all-time team, I encourage you to check out their page on Baseball Reference.
0 Comments
 In this post I will list out the All-Time Oakland Athletics lineup, according to Player Value. I will follow along the same format as MLB uses with its new "All-MLB" teams, which you can view here. That format is 1 player for each defensive position, 5 starters, and 2 relievers. I will only use DHs for AL teams, since most NL teams don't have enough seasons with the DH to really have a deserving player. Importantly, and as the graphic above suggests, these are based on individual seasons according to Player Value. The question we want to ask here is which version of a player would we want on our team? I want to give guys that only played a few seasons with a team an equal chance at making the lineup as the guys that spent their entire careers with one team. Baines is the DH because he has the highest Player Value among players that were primarily a DH for the season. If you want to instead insert someone who was the best batter not already on the all-time team, you'd probably go with Mark McGwire in 1996 or Reggie Jackson in 1969. Both guys have significantly more Batting Value than Baines did in 1991. McGwire was mainly a 1B and Jackson was mainly a RF, both offensively demanding positions, so there probably isn't a significant difference between the positional baselines used than that of DH. Baines hit 25 doubles and 20 HR with a .857 OPS. Jackson hit 36 doubles and 47 HR with a 1.018 OPS. McGwire hit 21 doubles and 52 HR with a 1.198 OPS. Here is how the players on the all-time team compare in terms of their Player Value components:  The team is led by Henderson and Giambi, both with 70+ Player Value seasons. Henderson won the MVP in 1990, and Giambi finished 2nd in 2001. Giambi did win the MVP in 2000, but even WAR agrees that 2001 was his better year. Newcomer and international phenom Ichiro Suzuki was awarded the 2000 MVP for his rookie season in which he led the league in hits, steals, and batting average. View the file below to see the numerical values of the Player Value components for each player on the all-time team:
View the files below to see the Player Value components, hypothetical awards based on Player Value, and general statistics for each player season and position (if you're wondering how another player that isn't on the all-time team fares, this is the place to look):
And that's it! I'm trying to make these posts shorter and just focus on sharing the all-time teams themselves and necessary data files. If you want to investigate an individual season for a player on the all-time team, I encourage you to check out their page on Baseball Reference.
 In this post I will list out the All-Time Athletics lineup, according to Player Value. I will follow along the same format as MLB uses with its new "All-MLB" teams, which you can view here. That format is 1 player for each defensive position, 5 starters, and 2 relievers. I will only use DHs for AL teams, since most NL teams don't have enough seasons with the DH to really have a deserving player. This includes all years from the Athletics franchise since 1912, meaning the Philadelphia Athletics from 1912 to 1954, the Kansas City Athletics from 1955 to 1967, and the Oakland Athletics from 1968 to 2021. However, no players from the Kansas City Athletics ended up making the all-time team. You can view the Philadelphia Athletics specific all-time team here. You can view the Kansas City Athletics specific all-time team here. You can view the Oakland Athletics specific all-time team here. Importantly, and as the graphic above suggests, these are based on individual seasons according to Player Value. The question we want to ask here is which version of a player would we want on our team? I want to give guys that only played a few seasons with a team an equal chance at making the lineup as the guys that spent their entire careers with one team. There are probably some notable Athletics pitchers missing from the all-time lineup that surprise you. From the bullpen, where are Rollie Fingers and Dennis Eckersley? Among starters, where are Dave Stewart, Vida Blue, and Barry Zito? Dave Stewart's best season was 1990 with 31.11 Player Value, which ranks 11th among Athletics starters. Vida Blue's best season was 1971 with 29.35 Player Value, which ranks 15th. If you rely solely on Pitching Value, Blue's 37.88 in 1971 ranks 3rd behind two seasons from the legendary Hall of Famer Lefty Grove. Barry Zito's best season was 2005 with 24.32 Player Value, which ranks 23rd. Eckersley's best season was also 1990 with 21.29 Player Value, which ranks 7th among Athletics relievers. If you rely solely on Pitching Value, Eck's 22.43 in 1990 ranks 3rd. Rollie Fingers' best season was 1974 with 17.82 Player Value, which ranks 14th. From a career perspective, Eckersley's 95.95 Player Value and Fingers' 65.28 Player Value rank 1st and 2nd among Athletics relievers. This only includes their time playing for the A's. Likewise, Blue's 128.28 Player Value ranks 3rd among Athletics starters and Zito's 100.06 Player Value ranks 4th. Stewart's 27.95 Player Value ranks 20th. Unfortunately, his great 1990 season gets largely offset by his poor 1991 season. All-Time Team Total Player Value: 856.8496 (5th in AL, 7th in MLB)
All-Time Team Pitching Value: 223.2317 (10th in AL, 14th in MLB) All-Time Team Fielding Value: 211.2079 (8th in AL, 10th in MLB) All-Time Team Baserunning Value: 3.3211 (5th in AL, 16th in MLB) The All-Time Athletics are one of the better teams in history. Their position players rate very well, in terms of both batting and fielding. Their C/1B/DH unit ranks as the 2nd best and consists of 3 Hall of Famers; Cocharne and Foxx are bearing the weight, however, as Baines' 15 Player Value season is pretty low. Despite having the best baserunner of all-time, the team's worst area is actually its baserunning. Henderson as an individual had 8.5 Baserunning Value in 1990, but earlier guys like Foxx and Simmons are at around -3 Baserunning Value to bring the team's total down. Here is how the players on the all-time team compare in terms of their Player Value components:  The team is led primarily by Jimmie Foxx, with an incredible 98 Player Value season. Joost ranks 2nd with an 84 Player Value season, and Cochrane, Henderson, and Baker also are near the top with 70+ Player Value seasons. View the file below to see the numerical values of the Player Value components for each player on the all-time team:
View the files below to see the Player Value components, hypothetical awards based on Player Value, and general statistics for each player season and position (if you're wondering how another player that isn't on the all-time team fares, this is the place to look):
And that's it! I'm trying to make these posts shorter and just focus on sharing the all-time teams themselves and necessary data files. If you want to investigate an individual season for a player on the all-time team, I encourage you to check out their page on Baseball Reference.
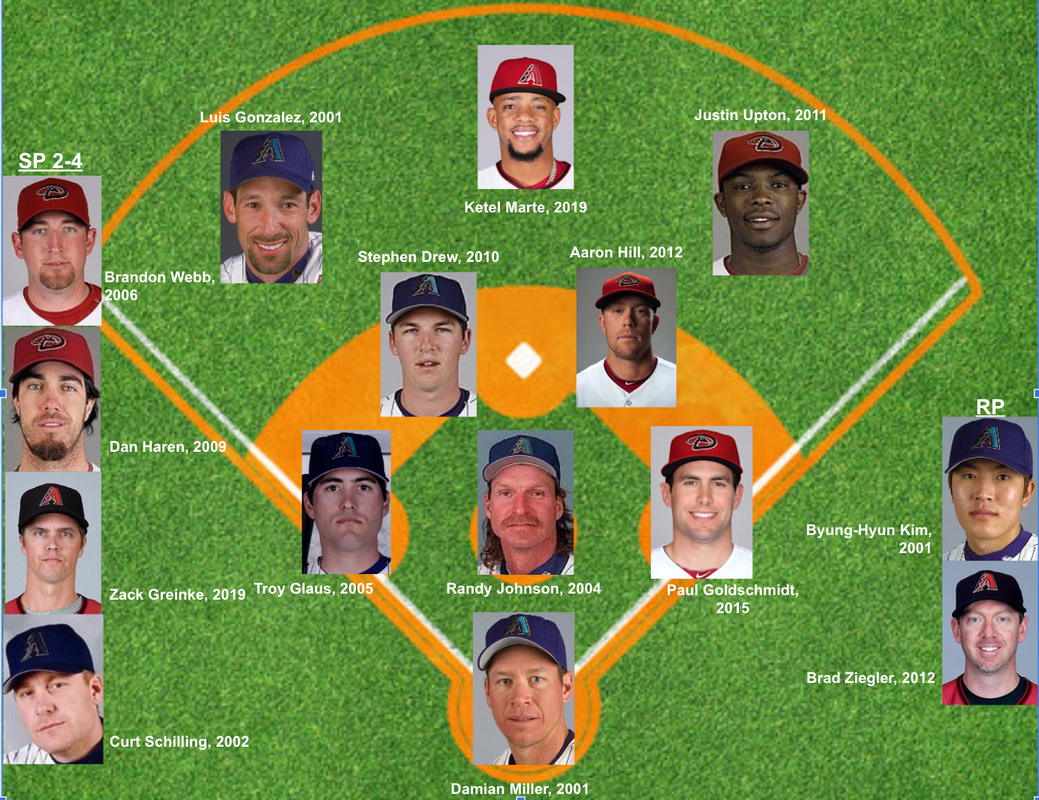 In this post I will list out the All-Time Arizona Diamondbacks lineup, according to Player Value. I will follow along the same format as MLB uses with its new "All-MLB" teams, which you can view here. That format is 1 player for each defensive position, 5 starters, and 2 relievers. I will only use DHs for AL teams, since most NL teams don't have enough seasons with the DH to really have a deserving player. Importantly, and as the graphic above suggests, these are based on individual seasons according to Player Value. The question we want to ask here is which version of a player would we want on our team? I want to give guys that only played a few seasons with a team an equal chance at making the lineup as the guys that spent their entire careers with one team. If you were to give this NL team a DH, you would probably go with Jay Bell in 1999, who was mainly a 2B. His Batting Value that season of 37.32 is the 4th most in Diamondbacks history, behind Gonzalez, Marte, and Goldschmidt. While he would benefit from the positional comparison as a 2B, his .931 OPS is still the highest of any player not already on the all-time team. He also hit 38 HR with 112 RBI. All-Time Team Total Player Value: 574.0581 (14th in NL, 28th in MLB)
All-Time Team Pitching Value: 183.9709 (12th in NL, 25th in MLB) All-Time Team Fielding Value: 121.7674 (13th in NL, 28th in MLB) All-Time Team Baserunning Value: 0.1151 (15th in NL, 23rd in MLB) The All-Time Diamondbacks are unfortunately one of the worst teams in history, but they are also one of the newest franchises in MLB. They rate slightly better when it comes to their outfield and catcher/first base duo, but still below average. Their bullpen rates as the worst of the all-time teams. Here is how the players on the all-time team compare in terms of their Player Value components:  The team is led by Luis Gonzalez and Paul Goldschmidt, with 67 and 58 Player Value seasons, respectively. View the file below to see the numerical values of the Player Value components for each player on the all-time team:
View the files below to see the Player Value components, hypothetical awards based on Player Value, and general statistics for each player season and position (if you're wondering how another player that isn't on the all-time team fares, this is the place to look):
And that's it! I'm trying to make these posts shorter and just focus on sharing the all-time teams themselves and necessary data files. If you want to investigate an individual season for a player on the all-time team, I encourage you to check out their page on Baseball Reference.
 In this post I will list out the All-Time Colorado Rockies lineup, according to Player Value. I will follow along the same format as MLB uses with its new "All-MLB" teams, which you can view here. That format is 1 player for each defensive position, 5 starters, and 2 relievers. I will only use DHs for AL teams, since most NL teams don't have enough seasons with the DH to really have a deserving player. Importantly, and as the graphic above suggests, these are based on individual seasons according to Player Value. The question we want to ask here is which version of a player would we want on our team? I want to give guys that only played a few seasons with a team an equal chance at making the lineup as the guys that spent their entire careers with one team. This NL team has a couple of options if you were to give them a DH spot. Carlos Gonzales in 2010 has the highest Batting Value of anyone not already on the all-time team, at 41.62, but part of that value could be due to the positional comparison. He was technically a utility player, as he didn't play at least 50% of his games at one position, but almost all of that was as an outfielder. He hit 34 HR with 117 RBI, led the league with a .336 batting average, had a .974 OPS, a 143 OPS+, and an Rbat of 36. Matt Holliday in 2007 has the highest OPS by a player with at least 400 plate appearances and not already on the all-time team, at 1.012. Other players close behind are Andres Galarraga in 1993 at 1.005, and Dante Bichette in 1995 at .984. Holliday was mainly a LF and had a 35.25 Batting Value, led the league with 50 doubles, hit 34 HR, led the league with 137 RBI and a .340 batting average, had a 151 OPS+, and 48 Rbat. Galarraga was mainly a 1B and had 26.49 Batting Value, hit 22 HR, had 98 RBI, led the league with a .370 batting average, had a 150 OPS+, and had an Rbat of 29. Bichette was also mainly a LF and had a Batting Value of 32.64, and led the league with 40 HR, 128 RBI, and .620 slugging, while having a 130 OPS+ and an Rbat of 25. All-Time Team Total Player Value: 590.9986 (12th in NL, 26th in MLB)
All-Time Team Pitching Value: 91.6870 (15th in NL, 30th in MLB) All-Time Team Fielding Value: 166.1112 (8th in NL, 19th in MLB) All-Time Team Baserunning Value: 1.6435 (11th in NL, 18th in MLB) The All-Time Rockies are unfortunately one of the worst teams in history, but they are also one of the newest franchises in MLB. In fact, the Rockies rank ahead of all of the other new franchises in the Diamondbacks, Marlins, and Rays, and even in front of a slightly older franchise in the Padres. Their batting is decent and ranks average, but their pitching ranks dead last. I honestly believe that the Rockies chose to prioritize having star sluggers over star hurlers, given the nature of their ballpark. Guys like Arenado and Walker had clear success elsewhere, so it surely isn't all about Coors. Nonetheless, since I don't currently incorporate any type of park adjustment into Player Value, it could be the case that the Rockies' Batting Value is overstated and their Pitching Value is understated. Their best positional grouping is their catcher and first base duo, but that is highly skewed towards Todd Helton. Helton is a Player Value darling, but there's nothing too impressive about Ianetta. Here is how the players on the all-time team compare in terms of their Player Value components:  The team is led by Todd Helton and Troy Tulowitzki, with 83 and 75 Player Value seasons, respectively. Eric Young with 68 Player Value and Larry Walker with 67 Player Value also help lead the way. View the file below to see the numerical values of the Player Value components for each player on the all-time team:
View the files below to see the Player Value components, hypothetical awards based on Player Value, and general statistics for each player season and position (if you're wondering how another player that isn't on the all-time team fares, this is the place to look):
And that's it! I'm trying to make these posts shorter and just focus on sharing the all-time teams themselves and necessary data files. If you want to investigate an individual season for a player on the all-time team, I encourage you to check out their page on Baseball Reference.
 In this post I will list out the All-Time New York Giants lineup, according to Player Value. I will follow along the same format as MLB uses with its new "All-MLB" teams, which you can view here. That format is 1 player for each defensive position, 5 starters, and 2 relievers. I will only use DHs for AL teams, since most NL teams don't have enough seasons with the DH to really have a deserving player. Importantly, and as the graphic above suggests, these are based on individual seasons according to Player Value. The question we want to ask here is which version of a player would we want on our team? I want to give guys that only played a few seasons with a team an equal chance at making the lineup as the guys that spent their entire careers with one team. If you had to give this NL team a DH spot, you would probably go with Johnny Mize in 1948, who was mainly a 1B. Mize in 1948 has the 5th highest Batting Value season in New York Giants history, at 52.20. The 4 seasons ahead of him are all from players already on the all-time team (Mays, Hornsby, and Ott). Mize led the league with 40 HR and had a .959 OPS. Note that Mel Ott in 1938 actually had the top 3B season, but I didn't want to have any duplicate players on the all-time team. Ott in RF in 1929 provided more value over Ross Youngs in RF in 1920 than Ott at 3B in 1938 provided over Freddie Lindstrom at 3B in 1928. Thus, Ott was kept in RF and Lindstrom was inserted at 3B. Christy Mathewson surely would rank higher in the New York Giants' starting rotation, but most of his prime years were before 1912. Here is how the players on the all-time team compare in terms of their Player Value components:  The team is led by Travis Jackson, Rogers Hornsby, and Willie Mays, each with an about 84 Player Value season. View the file below to see the numerical values of the Player Value components for each player on the all-time team:
View the files below to see the Player Value components, hypothetical awards based on Player Value, and general statistics for each player season and position (if you're wondering how another player that isn't on the all-time team fares, this is the place to look):
And that's it! I'm trying to make these posts shorter and just focus on sharing the all-time teams themselves and necessary data files. If you want to investigate an individual season for a player on the all-time team, I encourage you to check out their page on Baseball Reference.
 In this post I will list out the All-Time San Francisco Giants lineup, according to Player Value. I will follow along the same format as MLB uses with its new "All-MLB" teams, which you can view here. That format is 1 player for each defensive position, 5 starters, and 2 relievers. I will only use DHs for AL teams, since most NL teams don't have enough seasons with the DH to really have a deserving player. Importantly, and as the graphic above suggests, these are based on individual seasons according to Player Value. The question we want to ask here is which version of a player would we want on our team? I want to give guys that only played a few seasons with a team an equal chance at making the lineup as the guys that spent their entire careers with one team. If you had to give this NL team a DH spot, you would probably go with Kevin Mitchell in 1989, who was mainly a LF. Mitchell in 1989 has the highest Batting Value season of any player not already on the all-time team, at 42.64. He hit 47 HR, 125 RBI, had a 1.023 OPS, and a 192 OPS+, all of which led the league. He also won the NL MVP in 1989. Here is how the players on the all-time team compare in terms of their Player Value components:  The team is led by all around superstars Bonds and Mays with 103 and 84 Player Value, respectively. View the file below to see the numerical values of the Player Value components for each player on the all-time team:
View the files below to see the Player Value components, hypothetical awards based on Player Value, and general statistics for each player season and position (if you're wondering how another player that isn't on the all-time team fares, this is the place to look):
And that's it! I'm trying to make these posts shorter and just focus on sharing the all-time teams themselves and necessary data files. If you want to investigate an individual season for a player on the all-time team, I encourage you to check out their page on Baseball Reference.
 In this post I will list out the All-Time Giants lineup, according to Player Value. I will follow along the same format as MLB uses with its new "All-MLB" teams, which you can view here. That format is 1 player for each defensive position, 5 starters, and 2 relievers. I will only use DHs for AL teams, since most NL teams don't have enough seasons with the DH to really have a deserving player. This includes all years from the Giants franchise since 1912, meaning the New York Giants from 1912 to 1957 and the San Francisco Giants from 1958 to 2021. You can view the New York Giants specific all-time team here. You can view the San Francisco Giants specific all-time team here. Importantly, and as the graphic above suggests, these are based on individual seasons according to Player Value. The question we want to ask here is which version of a player would we want on our team? I want to give guys that only played a few seasons with a team an equal chance at making the lineup as the guys that spent their entire careers with one team. If you had to give this NL team a DH spot, you would probably go with either Jeff Kent in 2000, who was mainly a 2B, or Willie McCovey in 1969, who was mainly a 1B. Kent has the highest Batting Value season by a player not already on the all-time team, at 58.99. McCovey's Batting Value is the 2nd most in a season by a player not already on the all-time team, at 52.21. Kent's Batting Value is probably higher than McCovey's due to the positional comparison; relative to other 2B, Kent was more valuable than McCovey was relative to other 1B. But since we're talking about using one of these guys as the DH, such relative value is not as important. In an absolute sense, McCovey was perhaps the better hitter. Jeff Kent won the NL MVP in 2000 and hit 33 HR with 125 RBI and a .solid 334/.424/.596/1.021 line, along with a 162 OPS+ and 58 Rbat. McCovey won the NL MVP in 1969 and hit 45 HR with 126 RBI and a .320/.453/.656/1.108 line, along with a 209 OPS+ and 67 Rbat. Note that Mel Ott in 1938 actually had the top 3B season, but I didn't want to have any duplicate players on the all-time team. Ott in RF in 1929 provided more value over Ross Youngs in RF in 1920 than Ott at 3B in 1938 provided over Freddie Lindstrom at 3B in 1928. Thus, Ott was kept in RF and Lindstrom was inserted at 3B. All-Time Team Total Player Value: 870.6469 (1st in NL, 3rd in MLB)
All-Time Team Pitching Value: 236.5404 (3rd in NL, 9th in MLB) All-Time Team Fielding Value: 206.1150 (4th in NL, 11th in MLB) All-Time Team Baserunning Value: 7.7277 (5th in NL, 6th in MLB) The All-Time Giants are one of the best teams in history, and the best in the NL. Their outfield unit also ranks as the best in NL history, and includes 3 members of the 500 home run club. When Ott retired in 1947, he was 3rd on the all-time HR list, with 511, and the all-time NL HR leader. Mays would become the all-time NL HR leader in 1966, and retired with 660 in 1973 for the 3rd most all-time. Bonds retired in 2008 with 762 home runs, the all-time NL and MLB leader. The Giants all-time outfield is simply unreal. The Giants all-time team doesn't really have a weakness, much their worst area are their pitchers, who rank average. Here is how the players on the all-time team compare in terms of their Player Value components:  The team is led by all around superstars Bonds and Mays with 103 and 84 Player Value respectively, as well as by Hall of Fame middle infielders Jackson and Hornsby, also with 84 Player Value each. View the file below to see the numerical values of the Player Value components for each player on the all-time team:
View the files below to see the Player Value components, hypothetical awards based on Player Value, and general statistics for each player season and position (if you're wondering how another player that isn't on the all-time team fares, this is the place to look):
And that's it! I'm trying to make these posts shorter and just focus on sharing the all-time teams themselves and necessary data files. If you want to investigate an individual season for a player on the all-time team, I encourage you to check out their page on Baseball Reference.
 In this post I will list out the All-Time Brooklyn Dodgers lineup, according to Player Value. I will follow along the same format as MLB uses with its new "All-MLB" teams, which you can view here. That format is 1 player for each defensive position, 5 starters, and 2 relievers. I will only use DHs for AL teams, since most NL teams don't have enough seasons with the DH to really have a deserving player. This includes all years from the Dodgers franchise while they were in Brooklyn since 1912, meaning the Brooklyn Trolley Dodgers in 1912, the Brooklyn Dodgers in 1913, the Brooklyn Robins from 1914 to 1931, and the Brooklyn Dodgers again from 1932 to 1957. Importantly, and as the graphic above suggests, these are based on individual seasons according to Player Value. The question we want to ask here is which version of a player would we want on our team? I want to give guys that only played a few seasons with a team an equal chance at making the lineup as the guys that spent their entire careers with one team. If you had to give this NL team a DH spot, you would probably go with Jack Fournier in 1924, who was mainly a 1B. Fournier in 1924 has the highest Batting Value season by a player not already on the all-time team at 44.78. He led the league in HR with 27, and had a .965 OPS. Here is how the players on the all-time team compare in terms of their Player Value components:  The team is led by color-line-breaking greats of Roy Campanella and Jackie Robinson, both of whom produced 80+ Player Value seasons. View the file below to see the numerical values of the Player Value components for each player on the all-time team:
View the files below to see the Player Value components, hypothetical awards based on Player Value, and general statistics for each player season and position (if you're wondering how another player that isn't on the all-time team fares, this is the place to look):
And that's it! I'm trying to make these posts shorter and just focus on sharing the all-time teams themselves and necessary data files. If you want to investigate an individual season for a player on the all-time team, I encourage you to check out their page on Baseball Reference.
 In this post I will list out the All-Time Los Angeles Dodgers lineup, according to Player Value. I will follow along the same format as MLB uses with its new "All-MLB" teams, which you can view here. That format is 1 player for each defensive position, 5 starters, and 2 relievers. I will only use DHs for AL teams, since most NL teams don't have enough seasons with the DH to really have a deserving player. Importantly, and as the graphic above suggests, these are based on individual seasons according to Player Value. The question we want to ask here is which version of a player would we want on our team? I want to give guys that only played a few seasons with a team an equal chance at making the lineup as the guys that spent their entire careers with one team. If you had to give this NL team a DH spot, you would probably go with Gary Sheffield in 2000, who was mainly a LF. Sheffield in 2000 has the highest Batting Value season of any player not already on the all-time team, at 43.69. He hit 43 HR with a 1.081 OPS. Here is how the players on the all-time team compare in terms of their Player Value components:  The team is led by Mike Piazza, whose 84 Player Value far surpasses that of any of his teammates. Koufax and Beltre are next in line with 60+ Player Value seasons. View the file below to see the numerical values of the Player Value components for each player on the all-time team:
View the files below to see the Player Value components, hypothetical awards based on Player Value, and general statistics for each player season and position (if you're wondering how another player that isn't on the all-time team fares, this is the place to look):
And that's it! I'm trying to make these posts shorter and just focus on sharing the all-time teams themselves and necessary data files. If you want to investigate an individual season for a player on the all-time team, I encourage you to check out their page on Baseball Reference.
|
|||||||||||||||||||||||||||||||||||||||||||||||||||||||||||||||||||||||||||||||||||||||||||||||||||||||||||||||||||||||||||||||||||||||||||||||||||||||||||||||||||||||||||||||||||||||||||||||||||||||||||||||||||||||||||||||||
