|
The 2022 MLB regular season has concluded, allowing for another implementation of my Player Value metric onto a season. If you need to get caught up on what Player Value is, you can read about it in detail here, as well as its important addendum here. I've already done a short write-up on using Batting Value to determine which players should win a Silver Slugger and the Hank Aaron Awards in 2022, which you find here. I've also done a short write-up on using Fielding Value to determine which players should win a Gold Glove and the Platinum Gloves in 2022, which you can find here. If you'd like to view another comprehensive example of applying Player Value to an MLB season, check out my rollout post on the 2010 season here. Those Player Value explanation posts can be a bit of a doozy, so here's a quick summary. A player's offensive and defensive events, such as hitting a HR and recording an out, are measured in terms of their run-value, which are derived based on the event's impact on the probability of a run scoring. These events are measured on a per opportunity basis, such as per plate appearance or per inning, to prevent players that just play more from dominating. By using a rate basis, we can see players that are able to excel, even if for a shorter period of time. Since there is still value in being able to play at a high level for a longer time, however, these per opportunity values are multiplied by the number of opportunities. This is how we balance quality and quantity. Lastly, these amounts are compared to a player's positional first-quartile. By comparing a player to his peers, we avoid the impacts of era, run scoring environment, and positional adjustments. We compare a player to his position's first-quartile because being worse than that amount means the player was one of the bottom 25% of players at his position. This is like how WAR compares to replacement level, but with this we have actual relative values based on data rather than the sort of backed-into solution that WAR's replacement level is. Here's a quick reminder of the run value weights for the relevant pitching events: non-Home Run Hit: -.37 runs Home Run: -1.29 runs Unintentional Walk: -.22 runs Intentional Walk: -.17 runs Hit By Pitch: -.24 runs Sacrifice Bunt: .22 runs Sacrifice Fly: .10 runs Strikeout: .34 runs Groundball Double Play: .75 runs Other Out: .33 runs Wild Pitch: -.26 runs Balk: -.25 runs Here's a quick reminder of the run value weights for the relevant defensive events: Putout by a non catcher or first baseman: .33 runs Unassisted Putout by a first baseman: .33 runs Non-strikeout Putout by a catcher: .33 runs Assisted Putout by a first baseman: .2*.33 = .066 runs Strikeout Putout by a catcher: .33*.33 = .1089 runs Assist: .8*.33 = .264 runs Error: -.68 runs Double Play: .10 runs Passed Ball: -.26 runs Stolen Base allowed by catcher: -.15 runs Caught Stealing by catcher: .39 runs Here's a quick reminder of the run value weights for the relevant offensive events: Single: .30 runs Double: .58 runs Triple: .91 runs Home Run: 1.29 runs Unintentional Walk: .22 runs Intentional Walk: .17 runs Hit By Pitch: .24 runs Sacrifice Bunt: -.22 runs Sacrifice Fly: -.10 runs Strikeout: -.34 runs Groundball Double Play: -.75 runs Other Out: -.33 runs Player Value is divided into 4 components: Batting Value, Fielding Value, Baserunning Value, and Pitching Value. What each is measuring should hopefully be obvious. Before we dive into dissecting each award, let's take a look at some helpful plots of Player Value for the 2022 season. First, here's Player Value amongst all positions in MLB in 2022:  Higher players are more valuable offensively, as measured by their Batting Value and Baserunning Value. Further right players are more valuable defensively, as measured by their Fielding Value and Pitching Value. It is the sum of these that is total Player Value. The black diagonal line represents the breakeven point, so any player above the black line is providing positive Player Value. The further a player is above the black line, the better he is, and the further a player is below the black line, the worse he is. The green diagonal line represents the top 5% of players according to Player Value. There were 1,495 players in MLB in 2022, so this marks about the top 75 players. You can think of this line as representing an All-Star quality player. The dark green diagonal line represents the top 1% of players according to Player Value. That marks about the top 15 players, so you can think of this line as representing the quality of player that would receive some MVP votes. The red diagonal line represents the bottom 5% of players, while the dark red diagonal line represents the bottom 1% of players. Players this far down need some serious adjustments or need to get axed. To get this far down, you need to not only play poorly, but also play consistently poorly for many games. As the plot kind of shows, it's difficult for a pitcher to have the most Player Value. Pitchers don't bat anymore, taking away a significant way in which to add value to their team, as well as through baserunning. They appear in the field in far fewer innings than position players, also hindering their ability to add value with their glove. They do add value with their pitching, but they divide that pitching role with many other pitchers. It's certainly possible for a pitcher to have the most Player Value, but that would take the combination of an exceptional pitching season (or stellar batting and fielding to go with it) as well as an overall poor season by the league's position players. In 2022, Alcantara had the highest Player Value amongst pitchers, but was 28th overall. In 2010, Felix Hernandez had the highest Player Value amongst pitchers, but was 9th overall. It just depends on the season. Let's take a closer look at some of these plots by position and league. First, here's Player Value among position players in the AL:  Let's do a quick position count. I see a CF/RF in Judge, DHs in Ohtani and Alvarez, more CFs in Trout and Rodriguez, two SS in Bogaerts and Seager, three 2B in Altuve, Semien, and Gimenez, a 3B in Ramirez, and two C in Kirk and Rutschman. That's some solid positional diversity! All we didn't mention was first base, and guess who that pink dot to left of Seager is... Nathaniel Lowe, first baseman for the Texas Rangers. Here's Player Value among position players in the NL:  And where first base was lacking in the AL, we easily identify Goldschmidt and Freeman in the NL. Catchers in Realmuto, Smith, and d'Arnaud, 2B in McNeil and Rodgers, 3B in Machado, Arenado, and Riley, a SS/2B mix in Edman, an outfielder in Betts, etc. The point being: Player Value is not giving any particular position the short end of the stick. Here's Player Value among pitchers in the AL:  This allows us to see how a pitcher's value is divided between his pitching and fielding, a view not possible in the plot of all positions above since pitching and fielding get lumped together. We see here that Justin Verlander's value is almost entirely due to his pitching, and that Zack Greinke is gaining considerable value from his fielding, albeit not enough to make up for his poor pitching. Dylan Cease, on the other hand, is losing value due to his fielding. We see a decent mix of starters and relievers, so neither of those is getting a considerable advantage. And here's Player Value among pitchers in the NL:  We see that Alcantara had a slightly lower Pitching Value than Verlander, but his superior Fielding Value is what places him ahead of Verlander in the Player Value plot for all positions. Patrick Corbin had decent fielding ability, but boy, did that pitching struggle. Again, we see a good mix of starters and relievers. Alright, let's get into these awards, starting with the most controversial one first! MOST VALUABLE PLAYERS AL MVP: Aaron Judge, CF/RF/DH, New York Yankees, 83.72 Player Value Runner-up: Shohei Ohtani, DH/SP, Los Angeles Angels, 68.61 Player Value
Judge photo courtesy of Yanks Go Yard. Ohtani photo courtesy of Fox Sports. Personally, I'd be fine with a 1979-style co-MVP here, but according to Player Value somebody's gotta win, and that somebody is Judge. Judge had an absurd offensive season. His Player Value is dominated by his 79.26 Batting Value. However, he was still able to uphold the defensive standards of CF and RF, recording a Fielding Value of 4.03. His Baserunning Value was okay at 0.43, stealing 16 bases and being caught 3 times. I'm sure we are all well aware of Judge's accomplishments this season. Nearly won a Triple Crown, leading the AL with 131 RBI. New AL single-season HR record of 62. A .311 batting average, .424 on-base percentage, 1.111 OPS, and a .458 wOBA. Led MLB with a wRAA of 82.1, an Rbat of 80, an expected wOBA of .463, an fWAR of 11.4 and a bWAR of 10.6. In terms of what matters for Player Value, Judge notably got you about 47 more homers, 2 more doubles, 5 less singles, 5 more stolen bases, 49 more unintentional walks, 19 more intentional walks, 44 more strikeouts, 73 less other outs, 6 more putouts, 2 more assists, and 2 less errors. He simply had an incredible season, well deserving of the AL MVP. Two-way phenom Shohei Ohtani also had an amazing season. As a DH, Ohtani had the 2nd highest Batting Value in MLB (behind Judge) at 59.82 and the 3rd most Player Value, 2nd in the AL (behind Judge), at 57.01. He lost some due to his poor Baserunning Value of -2.81, the worst in all of MLB. Ohtani had 11 steals but was caught 9 times, and in case you haven't heard, caught stealings are much more detrimental than stolen bases are valuable. Ohtani had an Rbat of 31 and a wRAA of 31.7, which rank 14th and 12th in MLB, respectively. His position-player fWAR was 3.8 and his position-player bWAR was 3.4. In terms of what matters for Player Value, Ohtani got you about 20 more homers, 10 more doubles, 6 more triples, 16 more singles, 5 more steals, 9 more caught stealings, 13 more unintentional walks, 75 less strikeouts, 13 more intentional walks, 6 less groundball double plays, and 53 more other outs. Note that Ohtani's fielding gets lumped in with his pitching, not his DHing, so we'll discuss that later. You may be wondering how Ohtani scores better than fellow DH Yordan Alvarez, despite Alvarez's better offensive numbers and their similar positions. For one, Alvarez was only 58% a DH, also being 42% a LF, so Alvarez himself isn't a perfect DH comparison. For another, Ohtani was 15% a pitcher, who have 0 Batting Value. Essentially the DH positional first-quartile for Ohtani is getting scaled down by .85. For me, the jury is up on this decision. Maybe we should only consider Ohtani's time as a DH when considering his batting; but also, should we really expect a 15% P and 85% DH to provide the same offensive output as a 100% DH? As a pitcher, Ohtani had the 16th highest Pitching Value in MLB at 12.73 and the 6th most in the AL. He had a somewhat poor Fielding Value of -1.13, making his Player Value of 11.60 the 24th most in MLB among pitchers. Ohtani logged 166 innings with 219 strikeouts, an ERA of 2.33, a WHIP of 1.012, and a a FIP of 2.40. He had the 6th lowest ERA and 3rd lowest FIP in MLB among qualified pitchers, and led the AL in strikeouts per 9 innings with 11.87. His bWAR as a pitcher was 6.1 and his fWAR as a pitcher was 5.6. In terms of what matters for Player Value, Ohtani allowed about 3 less nonHR hits, 7 more unintentional walks, 78 more strikeouts, 12 more wild pitches, 2 less hit by pitches, and 35 less other outs than the first-quartile starting pitcher. Defensively, he got you 1 more putout and 5 less assists. Ohtani was truly one of the best hitters and pitchers in baseball, but these are just 2 components of Player Value. Truthfully, even combining the very best primarily DH and the very best primarily pitcher still wouldn't catch Judge. Alvarez's 47.38 Batting Value and Verlander's 24.78 Pitching Value combine to 72.16, still about 11 short of Judge. We see that Ohtani is just about 4 less than this combined player, and he's just one guy. Furthermore, Ohtani is losing some value on the bases and with his glove. If instead of having about -3 Baserunning Value he were say, Myles Straw of the Cleveland Guardians who went 21/1 with his SB/CS for a 1.81 Baserunning Value, then Ohtani would be up to 70.42. If instead of having about -1 Fielding Value he were say, Zack Greinke of the Kansas City Royals who had a 7.53 Fielding Value, then Ohtani would be up to 79.08. If instead of having about 13 Pitching Value he were Verlander, then Ohtani would be up to 91.13. So if we take the 2nd best AL batter and combine it with the best AL pitcher, baserunner, and fielding pitcher, we can finally top Judge. As great as Ohtani was, he wasn't that. But if he could have been a better base stealer, fielder, and not thrown so many wild pitches, things could have been real close. A quick note about the value of being two-way: for one, Ohtani isn't entirely the starting pitcher that we think he is. The Angels use a 6-man rotation, not the standard 5-man. Ohtani needs the extra guy in there to be able to rest up properly. Tom Tango and WAR have dismissed the value of the extra roster spot as a rounding error, just about 0.1 or 0.2 of WAR. I agree that the roster spot is inconsequential for this race, as the roster spot is probably worth just about 2 Player Value. NL MVP: Paul Goldschmidt, 1B/DH, St. Louis Cardinals, 75.07 Player Value Runner-up: J.T. Realmuto, C, Philadelphia Phillies, 56.48 Player Value 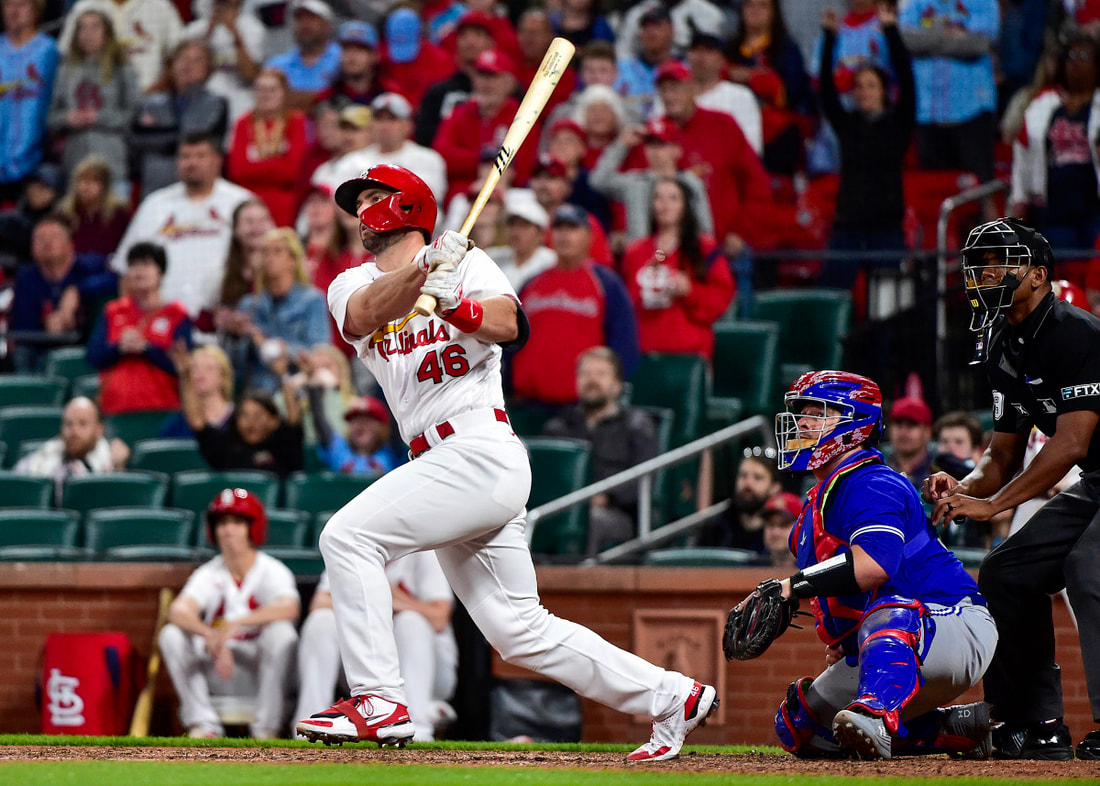 Goldschmidt photo courtesy of Sports Illustrated. This race has been less contentious, and rightly so. Goldschmidt seemed to be more of a favorite throughout the season as he also competed for a Triple Crown, with his .317 batting average finishing 3rd in the NL among qualified batters, his 35 HR finishing 5th in the NL, and his 115 RBI finishing 2nd in the NL. He had a decent Player Value split, with 45.59 Batting Value and 28.49 Fielding Value, leading his position in both. He's got an fWAR of 7.1 and a bWAR of 7.8, the 3rd most in the NL in both. The main Player Value challenger was Realmuto, but the main WAR challengers are third basemen Nolan Arenado and Manny Machado, as well as pitcher Sandy Alcantara. Alcantara's Player Value was 27.30, which was the most in the NL for pitchers, but well behind Goldschmidt. Machado is at 22.87 and Arenado is at 35.89, both solid, but also well behind Goldschmidt. Why the big differences? For Player Value, everything is relative to your position. If I lost Alcantara and had to swap him with a "meh" starting pitcher, how worse would I be? How worse would I be if I had to swap Machado or Arenado with a bottom 25% third baseman? How about if I had to swap Goldschmidt or Realmuto? Here are these guys' OPS and wOBA comparisons relative to their positional first-quartile: Goldschmidt: .981 vs .711, .419 vs .311 Realmuto: .820 vs .604, .354 vs .270 Machado: .898 vs .695, .382 vs .304 Arenado: .891 vs .694, .381 vs .304 Here are these guys' FP% and RF9 comparisons relative to their positional first-quartile: Goldschmidt: .999 vs .992, 9.48 vs 8.07 Realmuto: .993 vs .992, 9.54 vs 8.59 (also .4412 vs .2023 CS%) Machado: .966 vs .961, 2.44 vs 2.65 Arenado: .968 vs .961, 2.95 vs 2.65 So I don't care that Machado and Arenado are better hitters than Realmuto in an absolute sense, because they play different positions. Realmuto's Player Value was also very well split, with 30.55 Batting Value, 23.19 Fielding Value, and even 2.73 Baserunning Value (21 for 22 on SB as a catcher, holy cow!). Arenado was decently split too, with 23.98 Batting Value and 12.76 Fielding Value. Machado, however, is offensively focused with 26.86 Batting Value and -4.42 Fielding Value. Machado has 7.4 fWAR and 6.8 bWAR. Arenado has 7.3 fWAR and 7.9 bWAR. Realmuto has 6.5 fWAR and bWAR. Some offensive highlight comparisons are that Goldschmidt would get you +17 HR, +16 2B, +23 1B, +32 uBB, and -23 other outs than his first-quartile. Realmuto would get you +13 HR, +23 1B, +21 SB, and +9 HBP. Arenado would get you +15 HR, +17 2B, +12 1B, and -44 SO. Machado would get you +17 HR, +11 2B, +21 1B, and +9 IBB. Some defensive highlight comparisons are that Machado would get you -2 PO, -5 A, +4 E, and +5 DP than his first-quartile. Arenado would get you -9 PO, +65 A, +5 E, and +21 DP. Realmuto would get you +8 non-strikeout PO, +10 A, +5 E, +5 DP, -1 PB, -8 SB, +16 CS, and +112 strikeout PO. Lastly, Goldschmidt would get you +16 unassisted PO, +31 A, -3 E, -36 DP, and +141 assisted PO. CY YOUNGS NL Cy Young: Sandy Alcantara, SP, Miami Marlins, 19.20 Pitching Value Runner-up: Zac Gallen, SP, Arizona Diamondbacks, 18.28 Pitching Value  Alcantara photo courtesy of NBC Miami. This hopefully shouldn't come as too big of a shocker to anyone. Alcantara was 14-9 in about 228 innings pitched with a 2.29 ERA and 2.99 FIP while striking out 207 guys. The first-quartile starter had a 2.89 ERA and a 3.09 FIP. Gallen went 12-4 in 184 innings with a 192 strikeouts, a 2.54 ERA, and a 3.05 FIP. Alcantara has an fWAR of 5.7 and a bWAR of 8.1, while Gallen has an fWAR of 4.3 and a bWAR of 5.1. The main WAR challenger is Aaron Nola of the Phillies, with a 6.3 fWAR and a 6.0 bWAR. Nola finished with a Pitching Value of 14.25, the 7th most in the NL. Also ahead of him were Tony Gonsolin, Spencer Strider, Carlos Rodon, and Max Fried. Nola went 11-13 in 205 innings, striking out 235 with an ERA of 3.25 and a FIP of 2.58. Alcantara got you +14 SO, -2 uBB, +4 HBP, +7 GIDP, +15 other outs, +2 nonHR hits, and -4 HR. Gallen got you +36 SO, +6 uBB, +8 HBP, +1 GIDP, +1 other outs, -20 nonHR hits, -1 HR, and +3 WP. Nola got you +61 SO, -18 uBB, +4 HBP, -3 GIDP, -8 other outs, +9 nonHR hits, and +1 HR. AL Cy Young: Justin Verlander, SP, Houston Astros, 24.78 Pitching Value Runner-up: Emmanuel Clase, CP, Cleveland Guardians, 18.05 Pitching Value 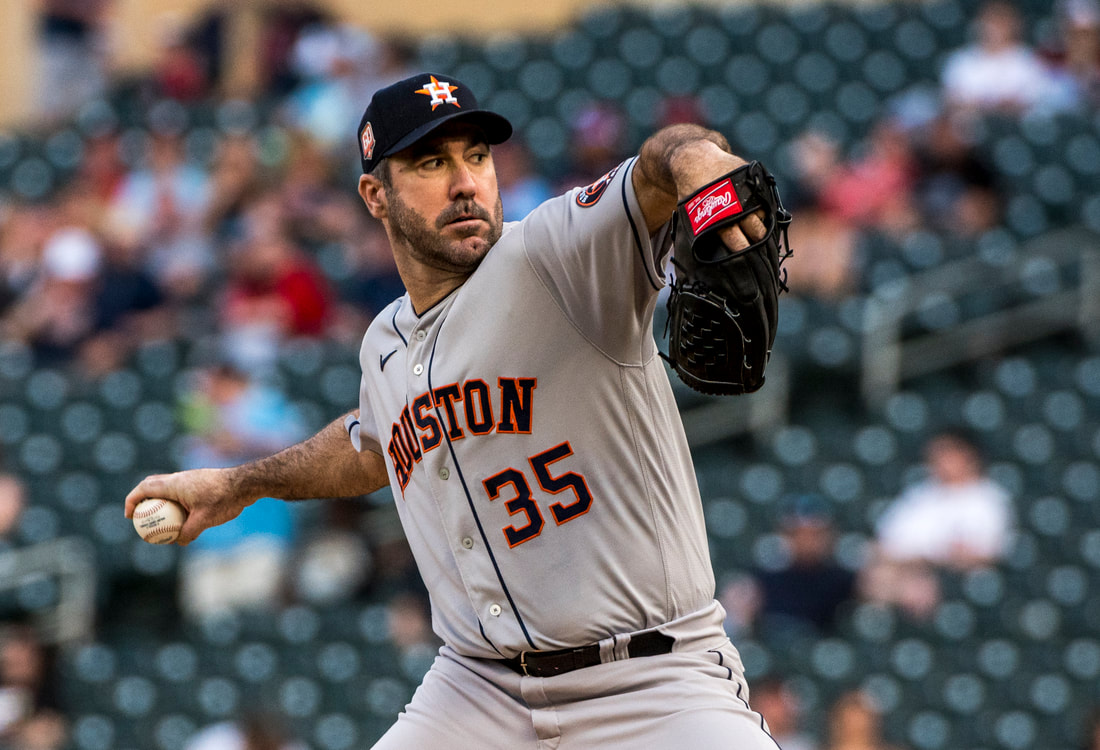 Verlander photo courtesy of Bleacher Report. This also probably doesn't come as too big of a surprise. Verlander went 18-4 in 175 innings with 185 strikeouts, a 1.75 ERA, and a 2.49 FIP. Clase was the best reliever in MLB, and also the best reliever that Player Value has examined thus far (that is to say, better than all of the 2010 relievers in Pitching Value, as well). He went 3-4 with 42 saves in 72 innings with 77 strikeouts, a 1.37 ERA, and a 1.98 FIP. Recall that while the first-quartile starter ERA was 2.89 and FIP was 3.09, the first-quartile reliever ERA was 2.78 and FIP was 3.03. Verlander has an fWAR of 6.1 and a bWAR of 5.9, while Clase has an fWAR of 2.4. and a bWAR of 2.8. Clase has the 2nd highest fWAR among relievers, and the most in the AL, but doesn't even reach the top 30 of starters. The fact that he came in 2nd here is what I believe to be a testament to Player Value's ability to not be biased towards certain positions. fWAR loves Kevin Gausman as the runner-up at 5.7, whom Pitcher Value disagrees strongly with at -4.73 (bWAR has him at 3.0). bWAR loves Dylan Cease as the favorite at 6.1, whom Pitcher Value has at 10.26 (fWAR has him at 4.4). Cease went 14-8 in 184 innings with 227 strikeouts, an ERA of 2.20, and a FIP of 3.10. Gausman went 12-10 in 174 innings with 205 strikeouts, an ERA of 3.36, and a FIP of 2.38. Verlander got you +37 SO, -10 uBB, -2 GIDP, +7 other outs, -15 nonHR hits, and -3 HR. Clase got you +13 SO, -11 uBB, +6 GIDP, +11 other outs, -6 nonHR hits, -1 HR, and +3 WP. Cease got you +71 SO, +35 uBB, -6 GIDP, -20 other outs, -16 nonHR hits, +0 HR, and +5 WP. Gausman got you +57 SO, -11 uBB, -1 GIDP, -20 other outs, +54 nonHR hits, +0 HR. Gausman grades poorly because he got raked within the park, even if he did strike out a lot of guys, didn't allow many homers, and didn't allow a lot of walks, as shown by his low FIP. While we may be quick to jump the gun and blame this on defense because of the ERA and FIP difference, a better approach is to rely on Baseball Savant's OAA behind-the-pitcher measures, which you can view here. RELIEVERS OF THE YEAR Mariano Rivera AL Reliever of the Year: Emmanuel Clase, CP, Cleveland Guardians, 18.05 Pitching Value Runner-up: Jason Adam, RP, Tampa Bay Rays, 11.19 Pitching Value 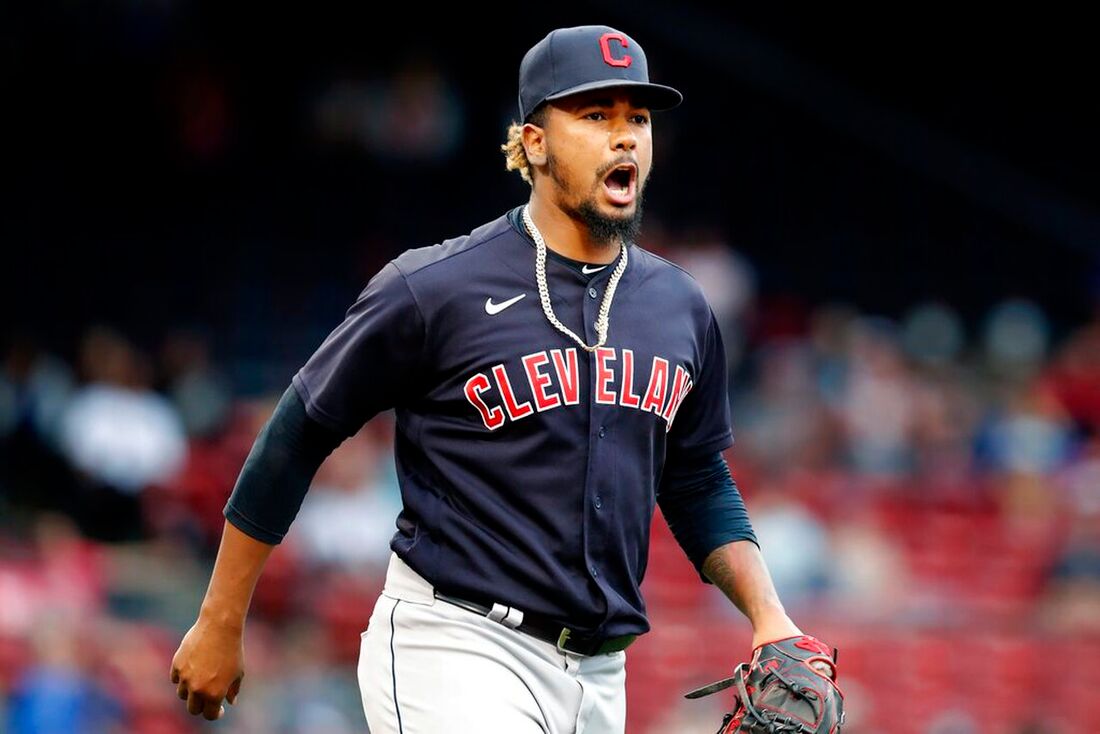 Clase photo courtesy of Cleveland.com Clase led all MLB relievers and finished 2nd in the AL among pitchers in general with his Pitching Value. Again, he went 3-4 with 42 saves in 72 innings with 77 strikeouts, a 1.37 ERA, and a 1.98 FIP. Recall that the first-quartile reliever ERA was 2.78 and FIP was 3.03. Clase has an fWAR of 2.4, the 2nd highest fWAR among relievers, and a bWAR of 2.8. Adam went 2-3 in 63 innings and recorded 8 saves. Baseball Reference technically lists him as the Rays' closer, but the Rays don't really follow the 'closer' philosophy. They had another guy with 7 saves and someone else with 6 saves. Adam struck out 75 with a 1.57 ERA and a 2.86 FIP. His bWAR was 2.6 and his fWAR was 2.2. Clase got you +13 SO, -11 uBB, +6 GIDP, +11 other outs, -6 nonHR hits, -1 HR, and +3 WP. Adam got you +19 SO, -2 uBB, +5 GIDP, -6 other outs, -15 nonHR hits, +1 HR, and +5 HBP Trevor Hoffman NL Reliever of the Year: Ryan Helsley, CP, St. Louis Cardinals, 12.84 Pitching Value Runner-up: Evan Phillips, RP, Los Angeles Dodgers, 12.73 Pitching Value  Helsley photo courtesy of The Athletic. Helsley had the 2nd highest Pitching Value in MLB, while Phillips finished 3rd. Helsley went a stellar 9-1 with 94 strikeouts and 19 saves in 64 innings, to go with a 1.26 ERA and a 2.33 FIP. Recall that the first-quartile reliever ERA was 2.78 and FIP was 3.03. His bWAR was 2.7 and his fWAR was 2.0. Phillips went a solid 7-3 with 77 strikeouts and 2 saves in 63 innings, while having a 1.14 ERA and a 1.94 FIP. His bWAR was 2.8 and his fWAR was 2.2. Helsley got you +37 SO, +2 uBB, -19 nonHR hits, +2 HR, -1 HBP, -0 GIDP, and -11 other outs Phillips got you +21 SO, -3 uBB, -9 nonHR hits, -2 HR, +2 HBP, +1 GIDP, and -4 other outs ROOKIES OF THE YEAR AL RoY: Julio Rodriguez, CF, Seattle Mariners, 40.83 Player Value Runner-up: Adley Rutschmann, C/DH, Baltimore Orioles, 23.32 Player Value  Photo courtesy of Lookout Landing. Rodriguez has had a tremendous first season, finishing 2nd in MLB and the AL in Player Value among CF. He was also the 4th best OF in MLB, and the 14th best player in MLB overall. Julio was well-rounded, with 25.26 Batting Value and 15.93 Fielding Value, good enough to what should win him the AL Gold Glove for CF. Julio had a bWAR of 6.0 and an fWAR of 5.3. Rutschman also had a solid rookie campaign, finishing 8th in MLB and 3rd in the AL in Player Value among C. He was more one-dimensional, with a -2.50 Fielding Value but a 25.27 Batting Value, good enough to what should win him the AL Silver Slugger for C. Adley had a bWAR of 5.2 and an fWAR of 5.3. Julio had an OPS of .853 compared to a first-quartile of .621, and a wOBA of .366 vs a first-quartile of .280. Adley had an OPS of .806 vs a first-quartile of .609, and a wOBA of .354 vs a first-quartile of .273. As their Batting Values show, they were very comparable offensively. Defensively, Adley's fielding percentage comparisons are .989 vs .992, while Julio's are .984 vs .990. Adley's RF9 comparisons are 8.33 vs 8.60, while Julio's are 2.88 vs 2.41. Julio made more outs than Rutschman, relative to his position. NL RoY: Nolan Gorman, 2B/DH, St. Louis Cardinals, 26.95 Player Value Runner-up: Brendan Donovan, 2B/3B/RF/LF/1B/DH/SS, St. Louis Cardinals, 26.22 Player Value  Photo courtesy of Redbird Rants. A pair of Cardinals rookies lead the NL according to Player Value, while most people and WAR probably expect a pair of Braves rookies to be leading the way. Braves SP Spencer Strider led all rookie pitchers in MLB and the NL with a Player Value of 18.20, finishing 6th in MLB and 4th in the NL among rookies. Braves CF Michael Harris II finished 9th in MLB and 6th in the NL among rookies with a Player Value of 12.36. Finishing ahead of the Braves duo but behind the Cardinals duo was Pirates rookie SS Oneil Cruz, with a Player Value of 20.30. FanGraphs WAR has Harris and Strider at 4.9, Donovan at 2.7, Cruz at 1.2, and Gorman at 0.5. Baseball Reference WAR has Harris at 5.3, Donovan at 4.1, Strider at 3.7, Cruz at 2.3, and Gorman at 0.7. So, why the disparity with Player Value? Let's quickly dig into the details. First, how does Player Value think these players are good? Here are the Batting Value and Fielding Values for the NL rookies in question, with the Pitching Value and Fielding Value for Strider: Gorman: 2.63 Batting Value, 24.24 Fielding Value Donovan: 8.93 Batting Value, 18.38 Fielding Value Cruz: 3.96 Batting Value, 16.97 Fielding Value Strider: 17.50 Pitching Value, 0.70 Fielding Value Harris: 17.88 Batting Value, -6.79 Fielding Value Just like it is difficult for a pitcher to win the MVP under Player Value, it is difficult for a rookie pitcher to win the Rookie of the Year under Player Value. While Strider can add value pitching to make up for the fact that he doesn't bat, he spends considerably less time in the field, preventing him from accumulating as much Fielding Value as his fellow rookies. So Gorman and Cruz are defense heavy, Donovan is pretty split, and Harris is offense heavy. Statcast disagrees on Gorman and Cruz, measuring them at -12 and -9 OAA. Donovan is measured at -3 OAA, while Harris is at 7 OAA. Rfield has Gorman at -6, Donovan at 9, Cruz at 1, and Harris at 8. fWAR has Gorman's Fielding Runs at -8, Donovan at -3.7, Cruz at -5.2, and Harris at 7. When discussing Player Value, it is imperative that we understand the impact that a player's position has. On an absolute scale, Gorman clearly wasn't the best rookie batter. Harris had an OPS of .853 and a wOBA of .368, and the first-quartile CF had an OPS of .621 and a wOBA of .280. Gorman had both a lower OPS and wOBA at .721 and .316, compared to 2B first-quartiles of .681 vs .302. So Harris was the better batter both absolutely and relative to his position, hence his higher Batting Value. But what about fielding? Gorman had a .9750 fielding percentage vs his position's first-quartile of .9761, but his RF9 comparison was 5.05 vs 3.67. Harris had a fielding percentage comparison of .9920 vs .9903, but an RF9 comparison of 2.25 vs 2.41. So Harris did better at making the balls surely hit his way, but Gorman did a better job of making additional plays. Now I will dive into 1st-team and 2nd-team selections for both the AL and NL, as well as MLB overall. Each starting position gets one spot, besides pitchers. Starting pitchers get 5 spots, as is the usual rotation size. Relief pitchers get two spots, and closers get one spot. I've also added a miscellaneous spot for safety, which will be used by diverse outfielders that didn't play at least 50% of their games at one outfield position, utility players that didn't play at least 50% of their games at any one position, outfielders that finish in the top 6 among all outfielders but not among the top 2 in a specific outfield position, or relievers/closers that finish in the top 6 among relievers/closers but not among the top 4 relievers or top 2 closers. The flexibility is intended so that every year there's hopefully at least somebody that qualifies, and this prevents worthy guys from being left out. This safety spot will only be used for the NL and AL teams. For the MLB, I'll put the safety player where I think makes the most sense, if he qualifies. FIRST-TEAM AL C: Alejandro Kirk, Toronto Blue Jays, 32.11 Player Value 1B: Nathaniel Lowe, Texas Rangers, 28.47 Player Value 2B: Andres Gimenez, Cleveland Guardians, 54.81 Player Value 3B: Rafael Devers, Boston Red Sox, 30.45 Player Value SS: Xander Bogaerts, Boston Red Sox, 43.28 Player Value LF: Steven Kwan, Cleveland Guardians, 15.82 Player Value CF: Mike Trout, Los Angeles Angels, 44.96 Player Value RF: Taylor Ward, Los Angeles Angels, 27.02 Player Value DH: Shohei Ohtani, Los Angeles Angels, 57.01 Player Value SP1: Justin Verlander, Houston Astros, 24.91 Player Value SP2: Framber Valdez, Houston Astros, 14.65 Player Value SP3: Nestor Cortes, New York Yankees, 14.45 Player Value SP4: Alek Manoah, Toronto Blue Jays, 14.02 Player Value SP5: Shane Bieber, Cleveland Guardians, 14.01 Player Value RP1: Jimmy Herget, Los Angeles Angeles, 10.91 Player Value RP2: Jason Adam, Tampa Bay Rays, 10.83 Player Value CP: Emmanuel Clase, Cleveland Guardians, 20.64 Player Value Misc: Aaron Judge, New York Yankees, 83.72 Player Value Judge was 44% a CF, 41% a RF, and 14% a DH. He was the best player in all of MLB, but gets the miscellaneous spot since he didn't play at least 50% of his games at one specific position. SECOND-TEAM AL C: Cal Raleigh, Seattle Mariners, 27.77 Player Value 1B: Anthony Rizzo, New York Yankees, 17.79 Player Value 2B: Marcus Semien, Texas Rangers, 46.63 Player Value 3B: Jose Ramirez, Cleveland Guardians, 29.20 Player Value SS: Corey Seager, Texas Rangers, 31.86 Player Value LF: Andrew Benintendi, Kansas City Royals & New York Yankees, 10.14 Player Value CF: Julio Rodriguez, Seattle Mariners, 40.83 Player Value RF: Kyle Tucker, Houston Astros, 18.15 Player Value DH: Yordan Alvarez, Houston Astros, 45.79 Player Value SP1: Shane McClanahan, Tampa Bay Rays, 12.35 Player Value SP2: Shohei Ohtani, Los Angeles Angels, 11.60 Player Value SP3: Ross Stripling, Toronto Blue Jays, 9.27 Player Value SP4: Cristian Javier, Houston Astros, 9.06 Player Value SP5: Jeffrey Springs, Tampa Bay Rays, 8.41 Player Value RP1: John Schreiber, Boston Red Sox, 10.37 Player Value RP2: Wandy Peralta, New York Yankees, 10.36 Player Value CP: Clay Holmes, New York Yankees, 10.80 Player Value Misc: Byron Buxton, Minnesota Twins, 24.06 Player Value Buxton was the 5th best outfielder in the AL, but the 3rd best CF in the AL. He gets the miscellaneous spot since he was better than Benintendi, but didn't play any LF. Also note Shohei's impressive feat of being on both the first and second team for the AL. FIRST-TEAM NL C: J.T. Realmuto, Philadelphia Phillies, 56.48 Player Value 1B: Paul Goldschmidt, St. Louis Cardinals, 75.07 Player Value 2B: Jeff McNeil, New York Mets, 41.12 Player Value 3B: Nolan Arenado, St. Louis Cardinals, 35.89 Player Value SS: Francisco Lindor, New York Mets, 28.74 Player Value LF: Ian Happ, Chicago Cubs, 17.12 Player Value CF: Bryan Reynolds, Pittsburgh Pirates, 17.04 Player Value RF: Mookie Betts, Los Angeles Dodgers, 46.44 Player Value DH: Albert Pujols, St. Louis Cardinals, 21.53 Player Value SP1: Sandy Alcantara, Miami Marlins, 27.30 Player Value SP2: Max Fried, Atlanta Braves, 21.36 Player Value SP3: Zac Gallen, Arizona Diamondbacks, 20.51 Player Value SP4: Corbin Burnes, Milwaukee Brewers, 19.94 Player Value SP5: Tony Gonsolin, Los Angeles Dodgers, 19.68 Player Value RP1: Evan Phillips, Los Angeles Dodgers, 14.61 Player Value RP2: Brusdar Graterol, Los Angeles Dodgers, 11.20 Player Value CP: Ryan Helsley, St. Louis Cardinals, 14.54 Player Value Misc: Tommy Edman, St. Louis Cardinals, 52.08 Player Value Edman's position distribution was 49% 2B, 4% 3B, 44% SS, 1% CF, 1% RF, and 2% DH. He was one of the best players in MLB and the NL, but since he didn't play at least 50% of the time at one specific position, he gets the miscellaneous spot. SECOND-TEAM NL C: Will Smith, Los Angeles Dodgers, 38.39 Player Value 1B: Freddie Freeman, Los Angeles Dodgers, 41.70 Player Value 2B: Brendan Rodgers, Colorado Rockies, 40.40 Player Value 3B: Manny Machado, San Diego Padres, 22.87 Player Value SS: Oneil Cruz, Pittsburgh Pirates, 20.30 Player Value LF: Joc Pederson, San Francisco Giants, 11.62 Player Value CF: Michael Harris II, Atlanta Braves, 12.36 Player Value RF: Juan Soto, Washington Nationals & San Diego Padres, 37.03 Player Value DH: Bryce Harper, Philadelphia Phillies, 18.24 Player Value SP1: Logan Webb, San Francisco Giants, 18.60 Player Value SP2: Tyler Anderson, Los Angeles Dodgers, 18.57 Player Value SP3: Spencer Strider, Atlanta Braves, 18.20 Player Value SP4: Carlos Rodon, San Francisco Giants, 14.88 Player Value SP5: Aaron Nola, Philadelphia Phillies, 14.09 Player Value RP1: Devin Williams, Milwaukee Brewers, 9.62 Player Value RP2: Collin McHugh, Atlanta Braves, 7.85 Player Value CP: Edwin Diaz, New York Mets, 10.36 Player Value Misc: Brendan Donovan, St. Louis Cardinals, 26.22 Player Value Donovan's position distribution was 11% 1B, 26% 2B, 21% 3B, 5% SS, 13% LF, 14% RF, and 11% DH. Since he didn't play at least 50% of the time at one specific position, he gets the miscellaneous spot. Edwin Diaz's brother, Alexis Diaz of the Cincinnati Reds, was the 6th best relief pitcher in the NL with an 8.37 Player Value, but he was technically the Reds' closer, despite recording just 10 saves. Williams did takeover closer duties for the Brewers after they traded Josh Hader to the Padres, but Hader was their main closer for the season. FIRST-TEAM MLB C: J.T. Realmuto, Philadelphia Phillies, 56.48 Player Value 1B: Paul Goldschmidt, St. Louis Cardinals, 75.07 Player Value 2B: Andres Gimenez, Cleveland Guardians, 54.81 Player Value 3B: Nolan Arenado, St. Louis Cardinals, 35.89 Player Value SS: Tommy Edman, St. Louis Cardinals, 52.08 Player Value LF: Yordan Alvarez, Houston Astros, 45.79 Player Value CF: Aaron Judge, New York Yankees, 83.72 Player Value RF: Mookie Betts, Los Angeles Dodgers, 46.44 Player Value DH: Shohei Ohtani, Los Angeles Angels, 57.01 Player Value SP1: Sandy Alcantara, Miami Marlins, 27.30 Player Value SP2: Justin Verlander, Houston Astros, 24.91 Player Value SP3: Max Fried, Atlanta Braves, 21.36 Player Value SP4: Zac Gallen, Arizona Diamondbacks, 20.51 Player Value SP5: Corbin Burnes, Milwaukee Brewers, 19.94 Player Value RP1: Evan Phillips, Los Angeles Dodgers, 14.61 Player Value RP2: Brusdar Graterol, Los Angeles Dodgers, 11.20 Player Value CP: Emmanuel Clase, Cleveland Guardians, 20.64 Player Value Since Judge was mainly a CF and RF, and Betts had a higher Player Value than Trout, Judge gets the CF spot and Trout gets demoted to the 2nd team. The best primarily LF, Ian Happ, has a substantially lower Player Value than his other outfield leaders. Alvarez spent 42% of his time in LF, and has the 9th highest Player Value overall, so getting him on the 1st-team made sense. Since Edman played mainly 2B and SS and has a higher Played Value than Gimenez and Bogaerts, and since Gimenez had a higher Player Value than Bogaerts, I put Edman in the SS spot. SECOND-TEAM MLB C: Will Smith, Los Angeles Dodgers, 38.39 Player Value 1B: Freddie Freeman, Los Angeles Dodgers, 41.70 Player Value 2B: Marcus Semien, Texas Rangers, 46.63 Player Value 3B: Rafael Devers, Boston Red Sox, 30.45 Player Value SS: Xander Bogaerts, Boston Red Sox, 43.28 Player Value LF: Jeff McNeil, New York Mets, 41.12 Player Value CF: Mike Trout, Los Angeles Angels, 44.96 Player Value RF: Juan Soto, Washington Nationals & San Diego Padres, 37.03 Player Value DH: Alejandro Kirk, Toronto Blue Jays, 32.11 Player Value SP1: Tony Gonsolin, Los Angeles Dodgers, 19.68 Player Value SP2: Logan Webb, San Francisco Giants, 18.60 Player Value SP3: Tyler Anderson, Los Angeles Dodgers, 18.57 Player Value SP4: Spencer Strider, Atlanta Braves, 18.20 Player Value SP5: Carlos Rodon, San Francisco Giants, 14.88 Player Value RP1: Jimmy Herget, Los Angeles Angeles, 10.91 Player Value RP2: Jason Adam, Tampa Bay Rays, 10.83 Player Value CP: Ryan Helsley, St. Louis Cardinals, 14.54 Player Value As mentioned above, due to the utility reasons for Judge and Edman, Trout and Bogaerts get sent to the 2nd-team despite being the best primarily CF and SS (respectively) in both the AL and the NL. The 2nd best primarily DH, Alvarez, was promoted to the 1st-team as the LF. Kirk was the best primarily C in the AL, and 5th best primarily C in MLB overall, but spent 40% of his time at DH, so he gets the 2nd-team DH spot. McNeil was the the 3rd best primarily 2B, but spent 22% of his time at LF, so he gets the 2nd-team LF spot. Happ gets demoted despite being the best primarily LF in both leagues, as McNeil was easily the superior player. Guys like Julio Rodriguez and Taylor Ward were clearly better players than Happ overall, but unfortunately didn't play enough LF to justify putting them in that spot, and were both worse than McNeil overall. TOP 25 MLB PLAYERS
PLAYER VALUE BY POSITION And now we will finally wrap everything up, showing that total Player Value is not particularly biased towards any certain position. Here are the boxplots of Player Value by position:  Shohei naturally gets his own spot for his unique two-way talents, but technically so too does... Pablo Reyes? He played in just 5 games for the Brewers in 2022, 3 as a SS, 2 as a 3B, and 1 as a RP. That's why we see him here; at least 50% of his games at SS, and at least 15% of his games as a pitcher. Leftfielders were particularly down this year, but this is not the case for Player Value in general, as Josh Hamilton, Carl Crawford, and Matt Holliday all ranked very high in the 2010 example. PLAYER VALUE BY TEAM Since a team's Player Value correlates well with its run differential per game, then we'd expect that the teams that have players with the most Player Value will be the ones that have the highest run differentials. Recall from my original Player Value post that Batting Value Average and Baserunning Value Average can describe 92.37% of a team's runs scored per game, while Fielding Value Average and Pitching Value Average can describe 86.1% of a team's runs allowed per game. These should also be the teams that win the most, since run differential per game correlates well with winning percentage (wins per game). Run differential per game can describe 89.31% of a team's winning percentage. Here are the boxplots and summary statistics of Player Value by team in 2022:   Feel free to compare these side by side with the 2022 MLB standings here. I spot the Braves, Guardians, Astros, Dodgers, and Yankees as having higher box plots, denoting a higher average Player Value. Weren't these teams good? I also spot the Reds, Royals, Marlins, Athletics, Pirates, and Rangers as having lower box plots, denoting a lower average Player Value. Weren't these teams bad? Player Value seems to uphold its ability to correlate with a team's ability to win. The Nationals' box plot doesn't seem as low as it should be given their record, but look at those outliers on the low end! Sure enough, we see they have the lowest mean Player Value. The Cardinals' box plot doesn't seem as high as it should be given their record, but look at those outliers on the high end! Sure enough, we see they have a high mean Player Value. Looks like the Giants were the team with the highest mean Player Value but the worst record, at 81-81. Here is the run differential per game by team in 2010:  Not surprising, we see that the Braves, Astros, Dodgers, Mets, Yankees, and Cardinals had high run differentials, and were good in 2022. I didn't explicitly mention the Mets above, but if you look at their box plot you'll see that it was higher. Similarly, we see that the Reds, Rockies, Tigers, Royals, Athletics, Pirates, and Nationals had low run differentials, and were bad in 2022. I didn't explicitly mention the Rockies above, but if you look at their box plot you'll see that it was lower. The Tigers' box plot actually appears somewhat middle-of-the-pack, but they are also the only team without an outlier on the upper end, and have several outliers on the lower end. Here is the win differential by team in 2010:  Again, we see that the Braves, Astros, Dodgers, Mets, and Yankees were the winningest teams. The Mets won more than their run differential would suggest, and the Cardinals won less than their run differential would suggest. We also see that the Reds, Rockies, Tigers, Royals, Athletics, Pirates, and Nationals were the least winningest teams. The Rangers lost more than their run differential would suggest, as did the Athletics. The Rockies lost less than their run differential would suggest. The fact that the Giants had a positive run differential but a .500 record explains why Player Value was slightly off for them. The setup is Player Value --> Run Differential --> Winning Percentage, so if we see a disconnect between Player Value & Winning Percentage, it could be because of unique Run Differential to Winning Percentage disconnects, rather than Player Value being necessarily wrong. I hope I have been able to show the value of Player Value as a metric! Player Value is measured in runs. Teams with a higher average Player Value are generally the same teams with higher run differentials and higher winning percentages. Teams with a lower average Player Value are generally the same teams with lower run differentials and lower winning percentages. If you want to be good, grab those guys with higher Player Values, and dump those guys with lower Player Values! FILES The below files show the players that were used for the first-quartile calculation for each position:
The files below show the first-quartile values for position players and pitchers, respectively:
The files below is the "master file" for position players. It shows the stats and Player Value components for all position players, and also divides players into their respective positions on different tabs. First-team guys are highlighted green, and second-team guys are highlighted light green. Silver Slugger and Hank Aaron Award winners are highlighted in silver, while Gold Glove and Platinum Glove winners are highlighted in gold.
This file is the equivalent "master file" for pitchers. It shows the stats and Player Value components for all pitchers, and all divides pitchers into starters and relievers on different tabs. First-team guys are highlighted green, and second-team guys are highlighted light green. Gold Glove winners are highlighted in gold, while Cy Young and Reliever of the Year winners are also highlighted in green.
This file combines the Player Value components of the position players and the pitchers. This is how you'll see who your top 25 players overall are. Most Valuable Player winners are highlighted in green. Platinum Glove winners are highlighted in gold, while Hank Aaron Award winners are highlighted in silver. Rookies are placed on a separate tab, with the Rookie of the Year winners highlighted in green.
These are the files used to obtain the stats for each player, courtesy of Baseball Reference. You can also find this data online on Baseball Reference. Player batting data here. Player fielding data here. Pitcher data here. Catcher fielding here. Pitcher batting against data here. Player game appearances data here. Team standings here. For all of these, I scrolled down to the player table (such as Player Standard Batting), hit Hide Partial Rows, hit Share & Export, hit Get table as CSV (for Excel), copied the data into Excel, used Excel's Text to Columns feature, and then saved the resulting file.
The first two R files below for position players and pitchers were used to do all of the calculations for Player Value for 2022, while the third R file below combined the Player Values of position players and pitchers:
The Yearly wOBA Weights workbook is read in by the R files, so it is needed as well. It is essentially just a download from the FanGraphs Guts! page, which you can find here.
One last thing - think that the 25% baseline is too low or high? Well, the R files above are equipped to easily change the baseline level to your liking. Just change the baselineLevel variable at the beginning to your liking. For example, here is how the position players and pitchers look if a baseline level of 10% is used instead:
The results are very similar. Judge should still be the AL MVP, and Goldschmidt should still be the NL MVP. Verlander and Alcantara should still win the AL and NL Cy Youngs. The Platinum Glove and Hank Aaron Award winners are the same, too. Julio and Gorman should still be the AL and NL Rookies of the Year. Anyone that is in the negatives here is in the bottom 10% of their position. Thank you all for reading. Previously I've been using the Lahman Dataset for the player data. It probably won't be updated for 2022 until next Spring, so I had to pull the data from Baseball Reference to get this season done quickly. Baseball Reference has more data than Lahman, but my Player Value files aren't updated to work with the additional data. I plan to incorporate this extra data - such as more specific baserunning, batting against for pitchers, and better measurements of opportunity for fielders - into Player Value soon. If these updates lead to any substantial changes in Player Value, I'll update this post accordingly or make another one. As always, feel free to comment any thought you have. Statting Lineup Newsletter Signup Form:
If you'd like to receive email updates for each new post that I make, sign up for the Statting Lineup newsletter using the link below: https://weebly.us18.list-manage.com/subscribe?u=ab653f474b2ced9091eb248b1&id=3a60f3b85f
0 Comments
Leave a Reply. |
Statting Lineup Newsletter Signup Form:
|
||||||||||||||||||||||||||||||||||||||||||||||||||||||||||||||||


