|
In my last post I introduced my Player Value metric, which seeks to be a simplified version of WAR. The jist is that we determine the run-value of each of the different events in baseball (like hitting a home run, catching a pop fly, and so forth) and then reward or dock players for each time they record those events. We then compare players to their position's first quartile values. This addendum serves to address 3 changes to Player Value since the original post. Like WAR, I intend to continuously update this metric to make it the best that it can be. Unlike WAR, I will always apply the same version of the metric to all players across time. I won't measure defense one way for Honus Wagner and another way for Andrelton Simmons. The first update was pointed out to me after I shared my metric on the r/Sabermetrics sub-Reddit. My previous "Run Driving In Value" was flawed because I was rewarding batters for the entire value of the runs that they drove in. Realistically, those players already had probabilities of scoring. Driving them in should only reward batters for the increase in probability. For example, previously I determined that there are .4057 RBI per double hit, which served as the Run Driving In Value. I was saying that in that respect, a double was worth .4057 runs. However, the probability that say a man on 2nd with 0 outs will score is already 62.11%. If you hit a double and drove the runner in, you shouldn't get credit for the entire run. Rather, you should only be rewarded for the 1-.6211 = 37.89% additional probability. To this end, I have removed the Run Driving In Value from the metric weights and concentrated it all into the Baserunner Effecting Value. I calculate the probability increase of going from 3rd to home on a single the same exact way that I previously calculated the increase of going from 2nd to 3rd on a single. The only change is that I'm not intentionally ignoring the scoring scenarios like I was before, since I'm no longer relying on the Run Driving In portion to cover it. The second update was one improvement that I noted I could make immediately at the bottom of the last post. I previously assumed that all events that put you on the same base gave you the same probability of scoring. This is to say, I assumed that a single and an intentional walk gave you the same probability of scoring, since you end up at first base for both. However, the frequencies with which these events occur leave themselves to be differently conducive at scoring runs. For singles, 24.63% of them occur with nobody on and 0 outs, resulting in you being on first with nobody else on and still 0 outs. This situation gives you a 42.64% shot at scoring. For intentional walks, 29.32% of them occur with a man on 2nd and 2 outs. This puts you at 1st with 2 outs and a man on 2nd after you've been intentionally walked, giving you a probability of scoring of just 11.91%. Clearly, intentional walks take place more commonly in situations where scoring is less likely. The same is true for our other events; base-out state frequencies play a role in our events' probabilities of scoring. Because of this, I have adjusted the Run Scoring Value for all of the events. The Run Scoring Value is now the weighted average probability of scoring of each scenario. You can see a calculation example with singles below: 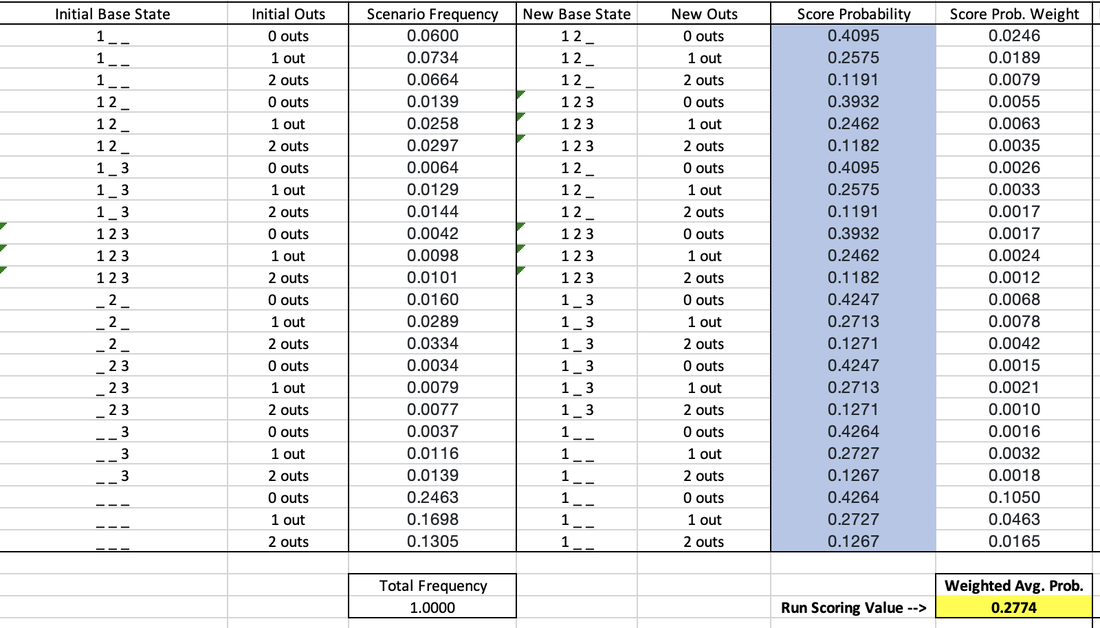 I already mentioned the nobody on, nobody out example above. For another example, about 6% of singles take place with a man on 1st out and 0 outs. When the single is hit, we assume all baserunners will advance as many bases as the batter does (in this case, one). That makes the new situation men on 1st and 2nd with still 0 outs. For the guy on first, this gives him a 40.95% chance of scoring, which is multiplied by the likelihood that scenario occurs (6%) to get the weight of .0246. Adding these up across all possible scenarios, we get the weighted average probability of scoring after hitting a single of 27.74%. The same process was applied to all events. Since I changed the probability of scoring for each event, this also impacted the Future Batters Effecting Value for each event, but the calculation for that piece remained the exact same. The new baseline probability of scoring when you walk up to the plate is 11.24%, and the new Future Batters Effecting Value for outs is -.1080. So I've updated the Run Scoring Value for each event, which impacted the baseline probability of scoring. Thus each event has a new Run Scoring Value Over Baseline. I essentially merged the Run Driving In Value with the Baserunners Effecting Value, and changed the method by which I calculated the Run Driving In Value piece. Lastly, the change in the baseline probability of scoring also impacted the Future Batters Effecting Value for the different events. The third update that I did was also thanks to the r/Sabermetrics sub-Reddit. I was previously weighting the value of an error as the difference between a "non-HR hit" and an "other Out". Realistically, it is unlikely that an error would result in a batter reaching 3rd base solely due to the error. An error will likely put a guy on 1st, and maybe on 2nd if an outfielder drops a flyball or something. To account for this, I calculated a "1B or 2B hit" value that is the weighted average value of a single and double. I now calculate the error as the difference between a "1B or 2B hit" and an "other out". This makes the new value of an error -.6797. You can see the result of these 3 updates in the new run-value weights for each event below: 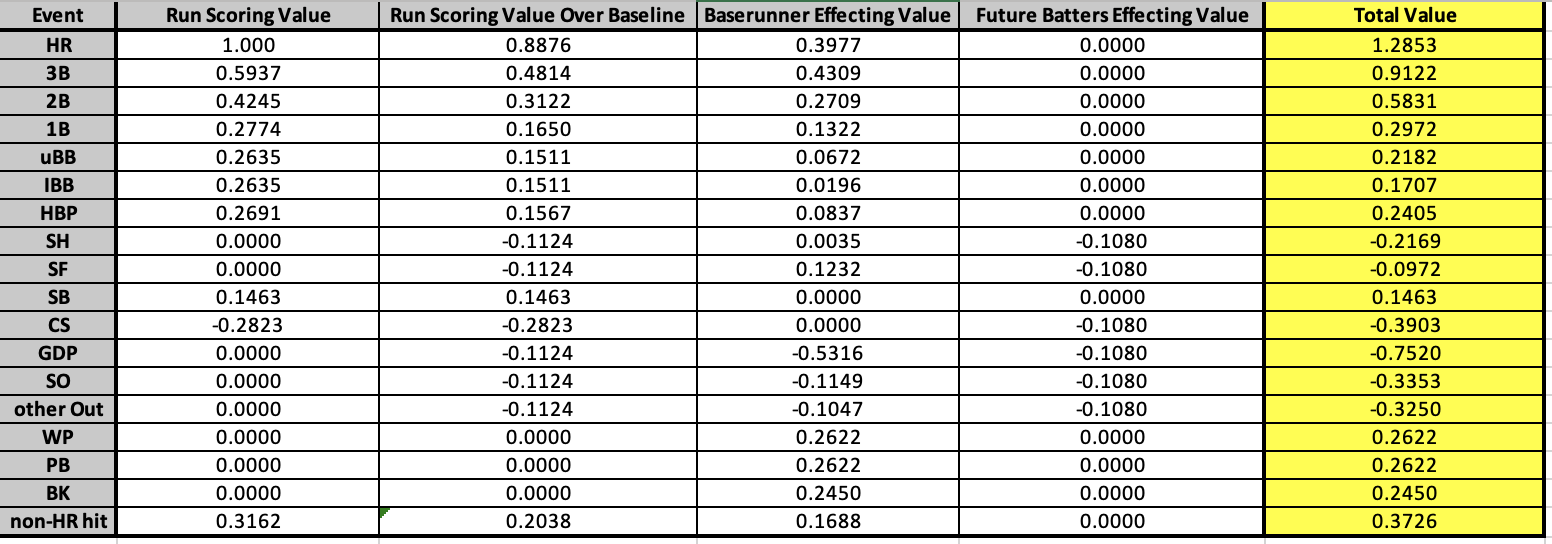 Some events like wild pitches, balks, and passed balls were unaffected by these updates. Most events were changed slightly, but not drastically. The event that had its value change the most was the sac fly, from .6274 to -.0972. This is because I was previously rewarding the batter an entire run for driving the guy on 3rd in. However, the baserunner on 3rd has already done the bulk of the work for that run. Moreover, since there are only 0 outs or 1 out, the guy on 3rd already has a high probability of scoring, even for "being on third base" standards. Bringing him in via sac fly only marginally increases the probability, which gets outnumbered by the detrimental value of the additional out on any remaining baserunners or future batters. The overall effect of these updates is a more accurate measure that intuitively makes more sense. However, there is also an effect on the its ability to describe runs scored and runs allowed per game. Batting Value Average previously had a correlation with runs scored per game of .9341, with an R^2 of .8726. After these updates, it now has a correlation with runs scored per game of .9463 and an R^2 of .8956. So, we improved! When we previously added Baserunning Value Average into the mix, we got an adjusted R^2 of .9071 when running a multiple linear regression to predict runs scored per game. After the updates, we now have an adjusted R^2 of .9238. Again, on the offensive side we see improvement with these updates. Pitching Value Average previously had a correlation with runs allowed per game of -.9217, with an R^2 of .8495. After these updates, it now has a correlation with runs allowed per game of -.9199 and an R^2 of .8462. So, we got a little worse on the pitching side. When we previously added Fielding Value Average into the mix, we got an adjusted R^2 of .8757 when running a multiple linear regression to predict runs allowed per game. After the updates, we now have an adjusted R^2 of .861. Thus overall on the defensive side we lost some performance with these updates. Offensively, we went from describing 90.71% of runs scored per game to 92.38%, a gain of 1.67%. Defensively, we went from describing 87.57% of runs allowed per game to 86.1%, a loss of 1.47%. Thus overall, we increased the descriptive ability of the Player Value metric by 0.2%. This increase is pretty marginal on the measurement side, but again remember that correlation isn't everything; OPS isn't better than wOBA. Having a process that intuitively and mathematically makes more sense is more important, and that is what was really improved through these updates. Below is an updated comparison of my metric's weights with those of other metrics:  Thank you for reading this addendum to Player Value. I look forward to applying this to players in the 2010 season and sharing the results! As always, let me know any thoughts you may have in the comments below. See below for updated versions of the files that I shared in the initial Player Value post:
Statting Lineup Newsletter Signup Form:
If you'd like to receive email updates for each new post that I make, sign up for the Statting Lineup newsletter using the link below: https://weebly.us18.list-manage.com/subscribe?u=ab653f474b2ced9091eb248b1&id=3a60f3b85f
0 Comments
Leave a Reply. |
Statting Lineup Newsletter Signup Form:
|
||||

