|
SAXX Underwear has announced a statistical sweepstakes of sorts for the 2023 World Series. The contest involves correctly predicting the outcome of a ball-centered formula that they've created, called the Ballgorithm. The Ballgorithm relies on a lot of "ball" events in baseball, such as pitches that are called balls, passed balls, bases on balls (walks), and even 2 ball 0 strike counts. The contest will go on for each game of the 2023 World Series, starting with game 1 this Friday, October 27th. If you are able to correctly predict the Ballgorithm to the .000 decimal place, the advertisement is that you will win free SAXX underwear for life! If you read the fine print, it actually says that the "approximate retail value of 25 years’ worth of SAXX Underwear" is "$9,600 USD". So "for life" may work for some older folks out there, but I personally hope to make it past 49 so I may be running out of underwear during my lifetime. Furthermore, the Terms and Conditions explain that it isn't some constant stream of underwear shipments that you'll be receiving over 25 years, but rather the gift is defined as "(1) gift consisting of one (1) shipment of three hundred (300) Pairs of SAXX Underwear". I'm not sure how effective a pair of underwear is after sitting in a box in your basement for 25 years, but I suppose time will tell. You can enter into the Ballgorithm competition here. You will need to make a separate entry for each game of the World Series, and you must enter before the start of each game. The rules define the Ballgorithm as the "total number of balls thrown, added to the total two balls – no strike counts, multiplied by two, added to the total base on balls multiplied by four, added to the number of passed balls squared. Then divide that number by the total number of pitches thrown". That formula may be difficult to comprehend as text, so here's a more visual example of the Ballgorithm for you to digest: 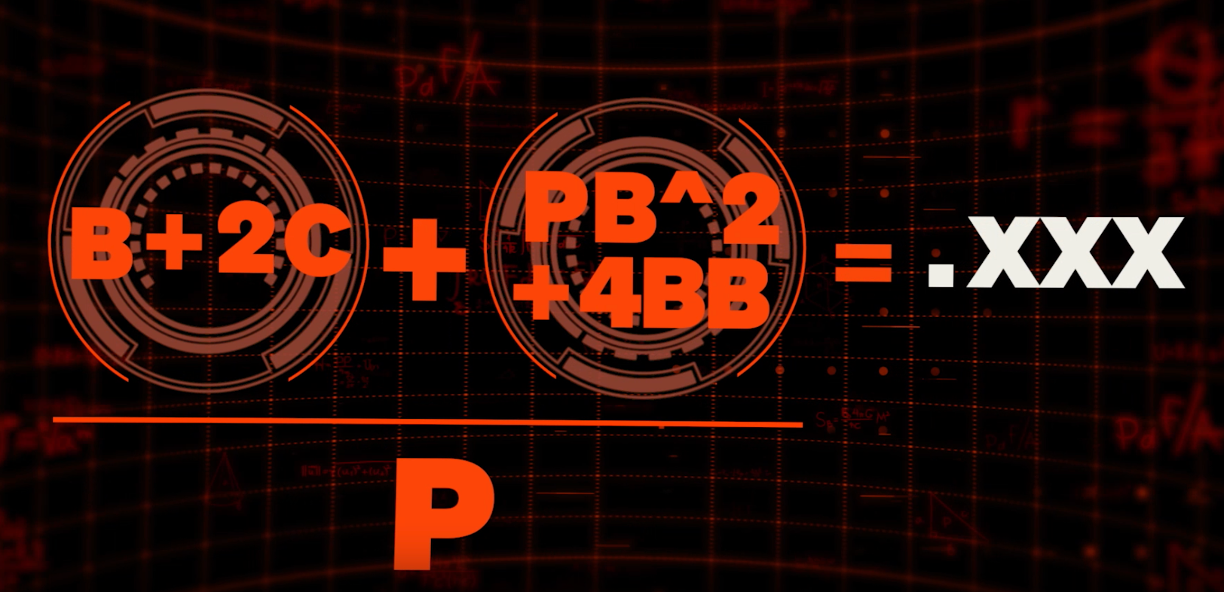 In the formula above, the variables are defined as:
I've created a Ballgorithm calculator where you can enter in your guesses for the 5 input variables into cells H2-H6, and the resulting Ballgorithm amount will appear in cell H8. With the introduction and formalities aside, let's dig into predicting the Ballgorithm! I will offer a couple ways of determining the result, but there are truly infinite ways that you could set up the data to back up your answer and getting the answer right will largely still be up to our good friend Lady Luck. MLB Regular Season Data One source of data we could use to predict the Ballgorithm is that from the 2023 regular season. Baseball Reference has a "Pitching Pitches" table that shows the total number of pitches and strikes thrown in the regular season, which you can find here. The table shows the values for each team, the MLB totals, and the MLB averages. In 2023, there were a total of 718,247 pitches. The 2023 regular season consists of a total of 2,430 games, calculated as 30 teams playing 162 games each, but each game is played between 2 teams, so (30 * 162) / 2 = 2,430. With the total number of pitches and the total number of games, we can calculate the expected number of pitches per game as:
Rather, we must round each of our 5 input variables to their closest whole numbers that could actually occur in a baseball game. This means that our actual input variable values would be:
Rangers and Diamondbacks Regular Season Data Maybe we want to make a Ballgorithm estimate using the specific teams that we know will be playing in the World Series, the Texas Rangers and the Arizona Diamondbacks. The "Pitching Pitches" table from above also has the total number of pitches thrown from each of these team's regular seasons. The Rangers threw a total of 23,162 pitches, while the Diamondbacks threw a total of 23,584 pitches, making the expected number of pitches per game for these teams as:
However, we must again remember that instances like 6.27 walks can't actually happen in a real game, so we round these expected values to their nearest whole numbers to get the following updated input variable estimations:
MLB Postseason Data The regular season is one thing, but maybe we want to focus on specifically post season games from this season. We can develop a Ballgorithm estimate using data from all games in the 2023 post season thus far. Again using Stathead, you can click here to see the number of pitches thrown in each 2023 postseason game. This table shows each team game, meaning there are rows for both teams in a given game. This table has 72 rows that come from the 36 post season games that have happened so far. Adding up the number of pitches from those 36 games, there have been a total of 10,339 pitches thrown, so we can evaluate the expected number of pitches per game to be:
With each of the 5 input variables estimated, we can plug them into the Ballgorithm to get an expected output of:
However, we must again remember that instances like 287.19 pitches can't actually happen in a real game, so we round these expected values to their nearest whole numbers to get the following updated input variable estimations:
Rangers and Diamondbacks Postseason Data The last example I will go over is looking at the two teams set to play in the World Series, but only their specific post season performance. Both the Rangers and the Diamondbacks have played in 12 post season games so far. We can use Stathead to see their totals from each post season game, which you can find here. Adding these amount for all of their post season games, we get that the Rangers have thrown 1,687 pitches and 1,076 strikes, meaning 1,687 - 1,076 = 611 balls. They've also issued 38 total walks. Using this info we can obtain the following expected values per game:
However, we must again remember that instances like 100.17 balls can't actually happen in a real game, so we round these expected values to their nearest whole numbers to get the following updated input variable estimations:
Conclusion I've gone over 4 of the numerous different ways that you could come up with an estimate of the Ballgorithm. As I've tried to hint at, there really isn't one "right" answer and getting the value correct will largely be due to luck. However, you can give yourself a chance by at least selecting input values that are in the range of what is most likely to occur. Before I summarize the 4 methods I've shared above, let's take a quick look at the spread of the different input values. First up is passed balls. The expected value was basically around 0.10 across the board, so you really have to bank on 0, or maybe 1, passed balls occurring in the game. I queried some 2022 regular season data from Retrosheet and didn't find any games with more than 2 passed balls, and even those were rare instances. Next up is 2-0 counts. The expected value was around 1.5 to 1.8, so we can lean on there being 1 or 2 such plate appearances in the game. Looking at the Retrosheet data from the 2022 regular season, the fewest 2-0 counts in a game was 0 and the most was 8. I also used that data to create the following histogram of 2-0 counts by game from the 2022 regular season: 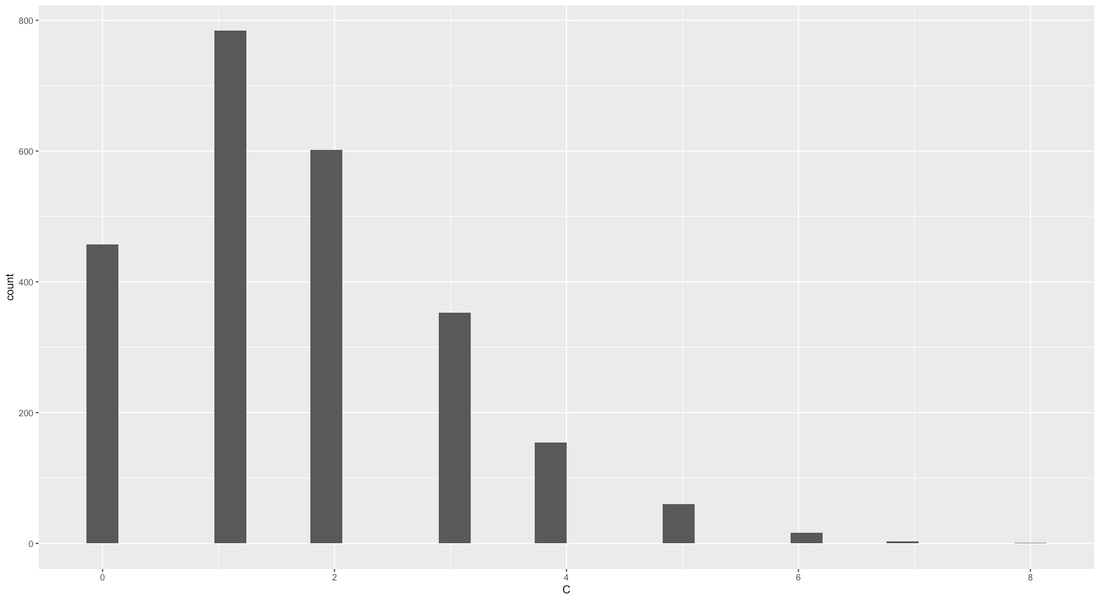 This is a right-skewed distribution and we can see that it is most likely that there will be 1 or 2 plate appearances with a 2-0 count in a game, though the broader range of 0-3 is still decently plausible. Next up are walks. The expected values are around 6.2 to 6.8, so our most likely range is assuming 6 or 7 walks in the game. From the 2022 regular season data from Retrosheet, the game with the least walks had 0 and the game with the most walks had 17. We can see that this range was true for 2023 as well by using Stathead, which you can view here. The most walks that the Rangers allowed in a game this season was 10 and the most that the Diamondbacks allowed was 9. Here's a histogram from the 2022 Retrosheet data of the walks per game:  Perhaps not my best formatting work, but we can roughly make out that the 4-7 walks range is the hot spot, but extending that to 3-8 or even 2-10 isn't too unreasonable. Last up are pitches and balls. I wasn't able to use the 2022 Retrosheet data as well for these because that datasheet is play-by-play data rather than pitch-by-pitch data, and I was having trouble reconciling the total pitch and ball counts from 2022 to their actual amounts as listed on Baseball Reference or Baseball Savant. Our expected range of balls is from around 100 to 107, and my attempts at a histogram suggest that the 90 to 110 range is most reasonable. Our expected range of pitches is from around 277 to 297, and my attempts at a histogram suggest that the 275 to 315 range is reasonable. So we've gone over Ballgorithm and the different ways we can use prior data to estimate the values. We can split the data a million ways to come up with a possible answer, but ultimately it's going to be up to luck. However, we can look at historical ranges to make an educated guess. I recommend you pick a value from my suggested ranges and then use my Ballgorithm calculator to determine the amount that you should enter into the competition for each game of the World Series. Here is a final summary of the estimates under the 4 approaches I've shared, as well as what I personally plan to use for my first entry:
Banking on 0 passed balls is probably the safest bet we will have out of any of these. The counts being between 1 and 2 seems fairly certain, but which of those is pretty up for grabs, since our actual estimate was pretty close to 1.5. The 2022 distribution was skewed right, bringing the mean/average up, so I'm going with the median as my measure for the "typical" game. I do think that post season baseball is privy to fewer pitches and balls since there are less blowouts and overall better teams. I'm sticking with the average for the number of walks. Thank you for reading and hopefully someone out there gets to experience a fantastic feeling of 300 new pairs of underwear! Also, see below if you are interested in my *very messy* Excel workbook
World Series Game 1 Update:
Eno Sarris is serving as the baseball stats expert spokesperson for the SAXX Ballgorithm competition. For Game 1, he predicted a value of 0.521, which you can view on Twitter/X here. Admittedly, Eno was much closer than I was. Combining the totals from the Rangers and Diamondbacks, the Game 1 input values and resulting Ballgorithm amount was:
World Series Game 2 Update: Eno Sarris shared the outcome of the Ballgorithm for Game 1 was 0.530, which is slightly different from the 0.525 that I had computed, so there is some disconnect into how these events are recorded by SAXX/Eno vs how Baseball Reference records them. My guess is that it is the 2-0 counts, since I get .530 if I change that amount from 1 to 2. I think Stathead only shows the 2-0 counts as the plate appearances that ended with that count, while SAXX/Eno may be using whenever that count appears, such as on a 4 pitch walk. With this in mind, we probably need to shift our guesses for the # of 2-0 counts up. Eno shared on Twitter/X that his prediction for Game 2 was 0.525, which you can view here. The actual input amounts and resulting Ballgorithm, per Baseball Reference, were:
World Series Game 3 Update: Eno shared that the actual Ballgorithm for Game 2 was 0.455, and that his prediction for Game 3 was 0.510, which you can view here. Again, this appears to be from Stathead only showing the PAs that end in a 2-0 count, rather than the all PAs where a 2-0 count occurred at some point. Here are actual input amounts and resulting Ballgorithm for Game 3 (to the best of my ability), per Baseball Reference:
World Series Game 4 Update: Eno shared that the actual Ballgorithm for Game 4 was 0.484, and that someone actually predicted it correctly, which you can view here. Unfortunately, I was late updating this again and didn't get my guess in for Game 6 in time. Hopefully the Dbacks win to force a Game 6 and allow me another guess. I've updated the Ballgorithm Calculator with the stats from Game 4, which you can view here on Baseball Reference as well. There 318 pitches, 117 balls, 0 passed balls, and 5 walks. There were 3 for sure 2-0 counts per Stathead, as there were 3 plate appearances that ended with a 2-0 count or a 3-0 count (which would have had to have been 2-0 before). This is actually the first game where I haven't been able to back into the actual number of 2-0 counts, given Eno's answer. When I use 8, I get .481, but when I use 9, I get .487. I'm not sure how Eno got to .484. For Game 5, Eno guessed a .505. Again, it was too late for me to enter my guess, but if I had to still pick one I guess I would go with .503. (I am publishing this at 9:21 PM Central time on 11/1/2023, for the record)
0 Comments
|
Statting Lineup Newsletter Signup Form:
|
||||||||||||||||||||||||||||||||||||||||||||

