Since the turn of the century, we've seen several prominent players from Japan enter the MLB and immediately dominate, but unfortunately many of their career totals are hindered by the fact that it took so much time for them to even get the opportunity to play in the United States. Professional baseball has existed in Japan since 1936, but it wasn't until 2001 until the first Japanese-born position player appeared in Major League Baseball. What if these players had played in the US from the get-go? The immediate success of some players suggests that the level of play in Japan wasn't all that worse, but other Japanese players that transitioned have struggled more, and furthermore there have been several pretty mediocre MLB players that have gone over and played in Japan and dominated. We'll start by looking at two players whose combined US and Japan stats, taken at surface level, would almost ensure them induction into Cooperstown. Notably, Hideki Matsui has over 500 home runs in both leagues combined, and Ichiro Suzuki would be the all-time hit king using his combined league stats.  Hideki Matsui played 10 years in Japan from 1993 to 2002 when he was ages 19 to 28. During his time there he amassed 1,390 hits, 332 home runs, 889 RBI, 901 runs scored, and batted .304 in 1,268 games played. In terms of awards in Japan, Matsui was a 9 time All-Star, won 3 MVPs, won 3 championships, won 1 championship MVP, and was named to the "Best Nine" 8 times, an award given to the best player at each position. He joined the New York Yankees in 2003 at age 29, and would play in the MLB for 10 years until he retired in 2012 at the age of 38. While in the MLB Matsui recorded 1,253 hits, 175 home runs, 760 RBI, 656 runs scored, and batted .282 in 1,236 games played. Awards wise, Matsui appeared in 2 All-Star games, was 2nd in Rookie of the Year voting in 2003, and won a World Series and was named the World Series Most Valuable Player in 2009. Combining his statistics in both leagues, Matsui played in 2,504 games, batted .293 for his career, and accumulated 2,643 hits, 507 home runs, 1,649 RBI, and 1,557 runs scored. If these stats were all solely achieved in the U.S., Matsui would surely be a Hall of Famer as his home runs are over the 500 mark and would place him 27th all-time, and his RBI would place him 33rd all-time. In both of these cases every player ahead of Matsui is either in the Hall of Fame, still playing, not yet eligible for the ballot, or used steroids. Matsui is already a member of the Japanese Baseball Hall of Fame, being inducted in 2018 after receiving 91.3% of the vote. Of course we can't take these career totals at face since we know that the quality of play in Japan and the U.S. isn't equal. To see how much more difficult the MLB is, we will look at Matsui's stats during his prime years on both sides of the league transition. By throwing out Matsui's first season in Japan (when he was only 19 and batted .223) we see that his batting average improves to .307 and that he averages .72 runs per game, 1.11 hits per game, .27 home runs per game, and .71 RBI per game. By throwing out Matsui's last two seasons in the MLB (when he was 37 and 38 and batted .252 and .147) we see that his batting average improves to .290 and that he averages .56 runs per game, 1.05 hits per game, .15 home runs per game, and .64 RBI per game. By dividing each of the Japan averages by the U.S. averages, we can get a factor that shows how much more difficult the U.S. playing environment was than in Japan. For example, if we divide his primal .307 Japan batting average by his primal .290 U.S. batting average we get 1.06, meaning the U.S. was about 6% more difficult in terms of batting average. The factor for runs scored is 1.48, the hits factor is 1.22, the home runs factor is 1.99, and the RBI factor is 1.27. We can now use these factors and apply them to Matsui's Japanese stats to adjust them down for the MLB playing environment. However, we also must be aware that the MLB's schedule has more games each season than the NPB's (Nippon Professional Baseball) does. While all MLB teams play a constant 162 games each season, teams in the NPB only play 143 games currently. During Matsui's playing days, the number of games per season was variable and ranged from 130 to 140. Matsui played in every single game after his first year, and even played in every game in his first 3 years in the MLB, holding the record for most consecutive games played to start a career with 518. Therefore to properly answer the question of what Hideki Matsui's stats would have looked like had he played in the MLB for his entire career, we must first adjust his Japanese stats down due to the more difficult U.S. playing environment and then adjust them up for the increased number of games. Matsui played in 43.8% of the games in his first year, so we assume he'd play in about 71 games in the U.S. From there we assume he'd play in all 162 games each season since he played in every game in Japan. Using his final year in Japan as an example, we see that in 2002 Matsui played in 140 games, scored 112 runs, recorded 167 hits, belted 50 home runs, and drove in 107 runs en route to his 3rd NPB MVP award and 3rd championship. These numbers place him at .80 runs per game, 1.19 hits per game, .36 home runs per game, and .76 RBI per game. Using the factors mentioned above we get an adjusted .54 runs per game, .98 hits per game, .18 home runs per game, and .60 RBI per game. Then we multiply these by 162 (the number of MLB games in a season) and the percentage of games Matsui played in (43.8% in 1993, 100% from 1994 to 2002). This gives Matsui a hypothetical 88 runs scored, 159 hits, 29 home runs, and 98 RBI had he played his 2002 season in the MLB. Going from 50 home runs in Japan to just 29 in the MLB is a big adjustment! We repeat this process for all Japanese seasons and get a hypothetical 733 additional runs scored, 1,377 extra hits, 200 more home runs, and 845 more RBI. Lastly, we add these hypothetical additions to Matsui's actual MLB stats and conclude that he would have recorded 1,389 runs scored, 2,630 hits, 375 home runs, and 1,605 RBI while batting .290. While the home run total is nowhere close to the 500 mark, his hit and RBI totals are much closer to his actual career totals in both leagues. These stats may not show that Matsui would have for sure been a Hall of Famer, but he certainly would have had the numbers to merit close consideration. He would be ranked 37th all-time in RBI, with everyone above him either in the Hall, still active, not yet eligible for the ballot, or a steroid user. You can view the Excel workbook that includes all of the works and steps shown for Matsui below:
 Ichiro Suzuki played in Japan for 9 seasons from 1992 to 2000 when he was ages 18 to 26. While playing in the NPB, Ichiro totaled 658 runs scored, 1,278 hits, 211 doubles, 118 home runs, 529 RBI, and batted .353 in 951 games. He was a 7 time All-Star, 3 time MVP, 7 time Gold Glove winner, 7 time batting champion, won one championship, and was named to the "Best Nine" 7 times while playing in Japan. Ichiro joined the Seattle Mariners in 2001 at the age of 27 and played for 19 seasons until he retired in 2019 at the age of 45. During his time in Major League Baseball, Ichiro scored 1,420 runs, recorded 3,089 hits, smacked 362 doubles, belted 117 home runs, drove in 780 runs, and stole 509 bases in 2,653 games while batting .311. He was immediately successful, being named the Rookie of the Year and the Most Valuable Player in his first season in 2001. In his 4th season in 2004 he would break the record for most hits in a single season with 262. He was named to 10 All-Star games, won 3 Silver Sluggers, won 10 Gold Gloves, and was a 2 time batting champion. Ichiro's MLB stats in isolation are already enough to ensure his induction into Cooperstown (he ranks 24th all-time in hits and is tied for 35th all-time in stolen bases), but when combining his numbers from both leagues the results are even more staggering. In his entire career across both leagues, Ichiro batted .322 and played in 3,604 games where he recorded 2,078 runs scored, 4,367 hits, 573 doubles, 235 home runs, 1,309 RBI, and 708 stolen bases. If these stats were solely recorded in the MLB, Ichiro would rank 1st in games played, 7th in runs scored, 1st in hits, 27th in doubles, and 11th in stolen bases. These would only further staple Ichiro as one of the greatest players ever. Ichiro is not currently in the Japanese Baseball Hall of Fame. Again, we can't take Ichiro's combined stats at face value since we know that the quality of play in Japan was slightly inferior. Given Ichiro's instant and substantial success, however, we shouldn't expect the adjustment to truly be all that large. By throwing out his age 18 and 19 seasons (when he batted .253 and .188) we see that primal Ichiro in Japan had a batting average of .359 and had per game averages of .74 runs scored, 1.43 hits, .24 doubles, .13 home runs, .60 RBI, and .23 stolen bases. Similarly, by using his first 10 seasons in the MLB up until he was age 37, we see that primal Ichiro in the U.S. batted .331 and had per game averages of .66 runs scored, 1.41 hits, .16 doubles, .06 home runs, .35 RBI, and .24 stolen bases. Just like with Matsui, we divide the primal Japanese per game averages with the primal U.S. per game averages to get the adjustment factors. For Ichiro we get marginal factors of 1.08 for batting average and 1.01 for hits, as well as .94 for stolen bases, 1.13 for runs scored, 1.45 for doubles, 2.38 for home runs, and 1.71 for RBI. Essentially it was easier for Ichiro to steal bases in the MLB than in Japan, and only slightly more difficult to record hits, but much more challenging to produce extra base hits, home runs, and RBI. Ichiro wasn't quite as durable as Matsui, but he did still have 5 straight seasons from 1994 to 1998 when he played in every game in Japan, so we assume he would have played 162 games each season in the MLB. He played in 32% of the games his first year and about 34% of the games his second year, which equate to 52 and 55 games in the MLB respectively. He played in about 77% and 80% of games his final 2 years in Japan, which equate to about 125 and 130 MLB games respectively. We'll use the same process for Ichiro as we did with Matsui. For each season Ichiro played in Japan, we take his per game averages and then adjust them using the factors we calculated them above. We then multiply those adjusted per game averages by the number of MLB games we would have expected him to play to get his hypothetical additional countable statistics. It comes out that Ichiro would have added 718 runs scored, 1,552 hits, 179 doubles, 61 home runs, 380 RBI, and 262 stolen bases. By adding these to Ichiro's actual career MLB statistics, we can estimate that Ichiro would have amassed 2,138 runs scored, 4,641 hits, 541 doubles, 178 home runs, 1,160 RBI, and 771 stolen bases. Wow! Those totals would put him 1st in hits, 7th in runs scored, 38th in doubles, and 6th in stolen bases. We see that these totals track very well with his actual combined totals from both leagues, trading off less doubles, home runs, and RBI for more runs scored, hits, and stolen bases. You can view the Excel workbook that includes all the work and steps shown for Ichiro below:
Now we will look at two players who have combined stats that are somewhat worthy of at least an initial consideration for Cooperstown. Their combined US and Japan stats probably aren't actually good enough to get in, but they were good career numbers and would have at least gotten these guys on the ballot.  Nori Aoki played in Japan from 2004 to 2011, in the MLB from 2012 to 2017, and again in Japan from 2018 to present. While in the U.S. he recorded 377 runs scored, 774 hits, 33 home runs, 219 RBI, and batted .285 in 759 games played. In Japan, Aoki has accumulated 954 runs scored, 1,819 hits, 137 home runs, 617 RBI, and has batted .320 in 1,475 games played. Combining his numbers from both leagues, Aoki has a total of 1,331 runs scored, 2,593 hits, 170 home runs, 836 RBI, and a combined career batting average of .309 in 2,234 games played. Since he played in the U.S. in the middle of his career we don't have a "prima" U.S. version of Aoki, but we can tack off his first and last seasons in Japan to get his primal Japan stats to use for the factor adjustments. For Aoki the adjustments are 1.14 for batting average, 1.34 for runs scored, 1.24 for hits, 2.19 for home runs, and 1.45 for RBI. Using these factors to adjust Aoki's per game averages in Japan, and then adjusting for the increased number of games in the MLB (while considering the percentage of games in Japan Aoki actually played in), we conclude that he would have reached 1,160 runs scored, 2,393 hits, 100 home runs, and 721 RBI. These numbers better show that Aoki would not be Hall of Fame worthy had he played his whole career in the MLB. Aoki has been an 8 time All-Star, 7 time "Best Nine" winner, and 7 time Gold Glove winner in Japan, but never won any accolades while playing in Major League Baseball. You can view the Excel workbook that includes all the work and steps shown for Aoki below:
 Kosuke Fukudome started his career in Japan in 1999 and played there until 2007, then came overseas and played in the MLB from 2008 to 2012, and since 2013 has been playing back in Japan. In Japan he's amassed 1,040 runs scored, 1,951 hits, 285 home runs, 1,075 RBI, and batted .287 in 2,000 games played. During his stint in the MLB, Fukudome recorded 264 runs scored, 498 hits, 42 home runs, 195 RBI, and batted .258 in 595 games played. Combining his numbers from both leagues, Fukudome totals 1,304 runs scored, 2,449 hits, 327 homers, 1,270 RBI, and a .281 batting average. This gives Fukudome an impressive career hit total, but a large portion of them came from his time in Japan. Just like with Aoki, since Kosuke played in the U.S. during the middle of his career, he does not have a "primal" version of himself while playing in the MLB. He struggled in his last year in the MLB (hence his exit), as well as during his first year back in Japan, but was able to pick it up from there. Fukudome was a competent player right away in 1999, but his last two seasons in Japan have clearly been subprime, so we will remove them to get his primal self while playing in Japan. Using these primal totals with his MLB totals we can get Fukudome's factor adjustments, which are 1.23 for runs scored, 1.22 for hits, 2.13 for home runs, 1.71 for RBI, and 1.13 for batting average. Using these factors to adjust Fukudome's per game averages in Japan, and then adjusting for the increased number of games in the MLB (while considering the percentage of games in Japan Fukudome actually played in), we conclude that he would have reached 1,244 runs scored, 2,363 hits, 198 home runs, and 926 RBI. These numbers better show that Fukudome would not be Hall of Fame worthy had he played his whole career in the MLB. Fukudome won an MVP, was a 4 time "Best Nine" winner, a 4 time All-Star, and a 5 time Gold Glove winner in Japan, but only ever appeared in one All-Star game while playing in the MLB (in 2008). You can view the Excel workbook that includes all the work and steps shown for Fukudome below:
Now we'll take a look at 3 current Japanese position players in the MLB and see how they have been doing since their transition from NPB. Since these players are all pretty young we don't really care about adjusting their career stats, but rather examining how their stats in the US compare to what they were able to do in Japan.  Yoshi Tsutsugo began his career in Japan at the age of 18 in 2010 and played there until 2019 when he was 27. His first four seasons saw him playing minimally and not up to par with what he produced in 2014 to 2019, so we'll only use those seasons as his primal Japanese self. Overall in Japan, Yoshi scored 515 runs, recorded 977 hits, smacked 205 home runs, and drove in 613 runs while batting .283 in 968 games. Using just his prime, Yoshi would have a .298 batting average, 462 runs scored, 846 hits, 185 home runs, and 542 RBI in 794 games. Taking these per game averages and then dividing these by his US per game averages, we get factors of 1.42 for runs scored, 1.74 for hits, 1.92 for home runs, 1.61 for RBI, and 1.43 for batting average. In his last 4 seasons in Japan, Yoshi hit 44/28/38/29 home runs, while just hitting 8 in each season in the MLB. Granted that the 2020 season was limited to just 60 games, but on a per game basis he went from belting about .25 homers per game for four straight years to about half that rate when in the MLB. He was a 5 time All-Star and 3 time "Best Nine" winner in Japan, but has yet to receive any accolades thus far in the US. You can view Yoshi's Excel workbook below:
 Shogo Akiyama began his career in Japan in 2011 at the age of 23 and played there until he was 31 in 2019. In Japan it took him one year to start playing at a consistent level, so we won't include his first season in with his primal self. In total Akiyama recorded 769 runs scored, 1,405 hits, 116 home runs, 513 RBI, and batted .301 in 1,207 games played in Japan. While in the US that average has dropped to just .224, but his on-base percentage is slightly better at .320, and surprisingly higher than his slugging percentage of .274. Akiyama's lack of power in the MLB has been apparent, as he has yet to hit a home run in his two seasons played so far despite hitting at least 20 each of his last three years in Japan. The factors for Akiyama are 2.97 for runs scored, 2.44 for hits, 3.03 for RBI, 1.36 for batting average. The home run factor is literally impossible to calculate since Shogo went from hitting .1 home runs per game during his prime in Japan to hitting 0 per game in the US. The best I could do was to adjust his MLB home runs per game up to .01, which makes the factor a high 10.48. Shogo was a 5 time All-Star, 4 time "Best Nine" winner, and 6 time Gold Glover in Japan. He has yet to win any awards in the MLB, but was named a Gold Glove finalist in 2020. You can check out Shogo's Excel workbook below:
 Last but certainly not least of the current players is the wondrous Shohei Ohtani, who first played in Japan at age 18 in 2013 and stayed there until he was 22 in 2017. It's somewhat difficult to determine what Shohei's prime was in Japan, as he was pretty young his entire time there. He only batted in about half of all his team's games in his first 3 seasons, and only put up decent numbers in his second season. He batted in about three quarters of his team's games in year 4 and put up great numbers, and also put up solid numbers in year 5 despite batting in less than half the games. Of course, Ohtani's batting appearances in games were limited due to the fact that he was also used as a pitcher. I've decided to just use Ohtani's stats from his last 2 seasons in Japan as his Japanese primal self, and used all of his MLB seasons so far for his US primal self. Ohtani's factors are unique in that some of them are actually below 1, suggesting that it was more difficult playing in Japan than in the US. His factors are .94 for runs scored, 1.15 for hits, .8 for home runs, .99 for RBI, and 1.23. These factors aren't too surprising given that only 2 Japanese seasons were used, but including his earlier seasons would have only amplified these factors. Ohtani hit 22 home runs in Japan in 2016, and then hit 22 and 18 homers in the US in 2018 and 2019, and after a poor year in 2020, exploded for a whopping 46 dingers in 2021. While in Japan, Ohtani was an All-Star 5 times, named to the "Best Nine" 3 times (twice as a pitcher and once as a DH), and won the MVP in 2016 when in addition to his 22 homers he batted .322 while posting a 1.86 ERA and striking out 174 batters. While in the US, Ohtani has won a Rookie of the Year, a Silver Slugger, been an All-Star (as both a pitcher and a DH) and won the MVP in 2021 when in addition to his 46 homers he led the league in triples and had a 9-2 record with a 3.18 ERA. You can view Shohei's Excel workbook below:
In conclusion, we've seen some players like Ichiro, Ohtani, and Matsui come over from Japan and be immediately successful in Major League Baseball, but others such as Aoki and Fukudome have only been decent, and Tsutsugo and Akiyama have struggled. So how does playing in Japan compare to playing in the US? Let's take a look at each player's environmental factors one more time, as well as the total average factors among these players.
Since Shogo's factors were so unlike all of the other players' besides for batting average, none of his factors were included when calculating the average for the other four factors. Looking at the average factors, we see that basically getting hits and scoring runs are about 20-26% more difficult in the MLB than in Japan (at least among the most prominent Japanese transition players), driving runs in is about 46% more difficult in the MLB, and hitting a home run is about 90% more difficult!  There is of course one great Japanese position player that never had the opportunity to play in Major League Baseball, and that is the legendary Sadaharu Oh. Oh played in Nippon Professional Baseball from 1959 (when he was age 19) until 1980 (when he was age 40). In his career in Japan, Oh scored 1,967 runs, recorded 2,786 hits, drove in 2,170 runs, had a .301 career batting average, and belted a whopping 868 home runs in 2,831 games played. Oh is Japan's all-time home run king and he has 211 more homers than the guy in 2nd. That booming home run total would also make him MLB's all-time leader and gives him 113 more than Hank Aaron in 467 fewer games, and 106 more than Barry Bonds in 155 fewer games played. Oh would also rank 3rd all-time in RBI, behind only Aaron and Babe Ruth. Of course, to truly compare these great players, we must account for the inferior quality of play in Japan, but also for the more games played per season in the US. How would have Oh fared if he had played his entire career in Major League Baseball? As you could probably guess, we'll use the average factors that we calculated above. We will also adjust up for MLB's longer schedule, but keep in mind that until 1962 there were only 154 games played per season in the MLB. When using the average factors above, we see that Oh would have had scored 1,929 runs, recorded 2,731 hits, drove in 1,839 RBI, and still smashed 565 home runs. He would have played in a total of 3,497 games, which would have placed him 2nd all-time behind only Pete Rose with 3,562 games played. Oh's career batting average would have dropped to about .251, however. While this shows that Oh would have NOT been baseball's home run king, it does show that Oh likely would have been worthy of induction into the Hall of Fame had he been able to play his entire career in the United States. Of course, one could argue that the Japanese baseball that Oh played in was of lesser quality than what the above players saw, and that the adjustment factors used for Oh should have been even stronger. These factors could also be improved to include data on how much easier it has been to play in Japan than in the MLB for players such as Randy Bass, Tuffy Rhodes, Alex Cabrera, and Wladimir Balentien. Nonetheless, I think the factors do a decent enough job of showing us roughly what Oh's hypothetical MLB career would have looked like. During his playing days in Japan, Oh won 11 championships, 9 MVPs (even more than Barry Bonds!), was a 20 time All-Star, a 9 time Gold Glove winner (which were only awarded in the final 9 years of his career), named to the "Best Nine" 18 times, and achieved 2 Triple Crowns. The All-Star game, Silver Slugger, Gold Glove, and Best of Nine were not awarded during Oh's playing career. He was inducted in the Japanese Baseball Hall of Fame in 1994. You can check out a detailed read of Oh's case for the National Baseball Hall of Fame in Cooperstown here: baseballguru.com/ctomarkin/analysisctomarkin07.html This other post below also tried to estimate Oh's MLB home run total, and clocked him in for 527 homers: baseballguru.com/jalbright/analysisjalbright08.html You can check out Oh's Excel workbook below:
Thank you all for reading, and I hope this post shed some light on some of Japan's greatest players. I hope to do a similar post in the future regarding the greatest Negro Leagues players and what their career numbers would have looked like had they been able to play their entire careers in Major League Baseball. I used the following links to obtain the stats in Japan for the players in this post: www.baseball-reference.com/register/player.fcgi?id=matsui001hid https://www.baseball-reference.com/register/player.fcgi?id=suzuki001ich https://www.baseball-reference.com/register/player.fcgi?id=aoki--001nor https://www.baseball-reference.com/register/player.fcgi?id=fukudo001kos https://www.baseball-reference.com/register/player.fcgi?id=tsutsu000yos www.baseball-reference.com/register/player.fcgi?id=akiyam000sho https://www.baseball-reference.com/register/player.fcgi?id=otani-000sho https://www.baseball-reference.com/register/player.fcgi?id=oh----000sad I would only let Ichiro into Cooperstown because I think that only actual MLB (or Negro League) statistics should be used when making a player's case for the baseball Hall of Fame that is located in... America.
As my first ever blog post pointed out, I like to think of Ty Cobb as my hit king since the 154 game to 162 game transition would have given Cobb more than enough plate appearances to amass more hits than Rose, and Rose only had 67 more career hits than Cobb despite playing in 528 more games. As my second ever blog post pointed out, I like to think of Hank Aaron as my home run king since he only had 7 homers less than Bonds, and did it without the use of performance enhance drugs. Furthermore, if you factor in the schedule change from 154 games to 162 games into Aaron's career, he'd likely have more career homers than Bonds anyway. Pretty cool last name too. Ruth does have a case, however, if he was able to play his entire career as a batter rather than being primarily a pitcher in his earlier seasons.
0 Comments
Recently, Yankees slugger Giancarlo Stanton belted his 300thcareer home run on August 31st. At age 28 and in just 1,119 games, he was the 5thfastest player to do so; beating him to it were Ralph Kiner, Ryan Howard, Juan Gonzalez, and Alex Rodriguez. As you may have noticed, none of the top three home run hitters in baseball history were quicker than Stanton. Therefore, we can conclude that Giancarlo will be our next home-run king, correct? Not so fast. Remember when Miguel Cabrera hit his 400thhome run back in 2015? He too was on a better pace than baseball’s home-run greats of Ruth, Aaron, and Bonds. However, in the past two seasons, Miggy has hit a depressingly low 19 home runs combined, making a home-run-record breaking career pretty much impossible. The truth of the matter with baseball’s home run record, and most of its records in general, is that it doesn’t matter how quickly or early a player accomplishes something. All that matters is that the player gets it done eventually and continues to do it consistently throughout the remainder of his career. Of the players that reached 300 quicker than Stanton, only one of them (Alex Rodriguez, 696 career home runs) went on to live up to -or at least around- his pace. Ralph Kiner only made it to 512. Juan Gonzalez only to 434. Andruw Jones, another one of the fastest players to reach 300, matched Gonzalez at 434. Ryan Howard failed to even continue to the 400-home run club, ending up with 382. The mid-to-late 30s (and at times even the early 30s) are a crucial period in a player’s career in terms of record-breaking. Players either hang around and continue to prove their worth or show their age and retire. It’s a large facet of what makes a player an all-time great. Let’s take a look at how several different players compare in their mid-to-late 30s:  You probably see the pattern by now. The key to having a career with more home runs involves playing when you’re older and still hitting a lot of homers while doing so. With the exception of Ruth, all of the top career home run hitters (we’ll look at Pujols later) were hitting 25+ homers at age 39, whereas their counterparts that had more productive first-half careers were sitting at home on the couch at the same age. Breaking records is exciting. We all hope and prematurely predict players to break records, but unfortunately many of our predictions come up short. Players aren’t robots and many hit a sort of career wall by age 35. Stanton is on pace to be the next home run great, but he’ll have to keep it up for many years to come to be legitimate. The second half of a player’s career is just as important, if not more important, than the first half in deciding their relative greatness. With all that being said, the remainder of this week’s post will involve taking a look at today’s players and seeing who might (or might not) be giving the home run record a run for its money. I only used players that I found to be projected into the 600s, as well as notable active career home run leaders. Some important things to acknowledge before looking at the list are:
Before we start the actual list, let’s quickly find the number of additional home runs players will hypothetically hit the rest of this season as mentioned above:  Now, we can finally proceed to our actual list: *note that the “current” home run values INCLUDE tthe Hypothetical Additional Home Runs calculated above*  Please note below how I determined the average home runs per season for each player:
Thanks again for reading. I know this post was harder to understand and took more calculation time on my part, but hopefully you still found it interesting. Aaron Springer Sources Used: https://www.si.com/mlb/2015/05/16/miguel-cabrera-tigers-400th-career-home-run https://www.baseball-reference.com/bullpen/200_Home_Run_Club https://www.baseball-reference.com/bullpen/300_Home_Run_Club https://www.baseball-reference.com/bullpen/400_Home_Run_Club https://www.baseball-reference.com/bullpen/500_Home_Run_Club http://www.espn.com/mlb/story/_/id/24527546/yankees-slugger-giancarlo-stanton-hits-300th-hr-5th-fastest-mark https://www.baseball-reference.com/leaders/HR_active.shtml I also used the Baseball-Reference Pages for the following players: Barry Bonds Hank Aaron Babe Ruth Alex Rodriguez Willie Mays Juan Gonzalez Andruw Jones Ryan Howard Albert Pujols Adrian Beltre Miguel Cabrera Giancarlo Stanton Mike Trout Khris Davis Nolan Arenado Joey Gallo Aaron Judge Cody Bellinger
When Babe's in a Bond, a Hammer Comes to the Rescue: Deciding Who Should be Baseball's Home Run King9/9/2018
Before I start my second post I encourage you to take a look at my first post, which investigated the implications that the 1961 Major League Baseball increase in games played had on the total career hit count of Ty Cobb. We concluded (or better yet, I concluded, seeing that every response to last week’s poll still voted Pete Rose as baseball’s hit king) that the additional 8 games per year actually had a massive impact on Cobb’s statistical potential, as he was deprived of roughly 650 at-bats which was translated to about 225 more hits for his career. This week’s post will deal with a very similar issue, but instead of the impact that the switch to 162 games had on certain players’ career hits, we will look at the impact that the switch had on certain player’s career home runs. The subject of home run king has been an icy topic, as baseball’s current leader Barry Bonds (762 career homers) has been highly believed to have used steroids/PEDs. This controversy has thwarted Bonds from being inducted into Cooperstown despite more than enough achievements to deem him worthy of the reward. In fact, because of his alleged steroid use, many true baseball fans still consider Hank Aaron (755 home runs) to be the home run king. However, it is neither of these two leaders, but the third-place finisher Babe Ruth (714 home runs), who we will be taking the deepest look at. As I’ve mentioned before, in 1961 the MLB increased the number of games played in a season to 162 – 8 more than the previous 154 used since 1904 (with the notable exception of 1919, when 140 games were played). Bonds had the 162-game luxury his entire career, as he played from 1986-2002. Ruth, on the other hand, was deprived of these extra games every year of his career from 1914-1935. Unlike last week, this time around we will have an exciting third player and element to take into the picture, as Hank Aaron was actually also deprived of the 162-game mark for several seasons being that he played from 1954-1976. So again, let’s try to answer the question: If all three players were able to play 162 games each season, who would be the home run king? As I said last week, not every player plays in every single game of their team’s season. Thus, we will take the percentage of the 154 games that Ruth and Aaron played and use it to find the number of games they would have played in a 162-game season. Starting with “The Bambino”:  ** We did not include the 1914 season since Ruth hit no home runs that year. He was primarily a pitcher during his stint with the Red Sox and thus deprived of more could-have-been homers. More on this later.** By adding up all of the New Games Played for each season, we get a New Career Games Played of 2,650 for Babe Ruth; 147 more games than his actual career total of 2,503 thanks to the MLB rule change. Now we’ll calculate the same thing for the 7 seasons in which “Hammerin’ Hank” was only able to play a maximum of 154 games:  By adding up all of the New Games Played for each season with all of his career games played from 1961 to 1976, we get a New Career Games Played of 3,353 for Hank Aaron; 55 more games than his actual career total of 3,298 thanks to the MLB rule change. Now that we know how many extra games each player would have had, we can use this information to calculate how many extra at-bats they would have gotten as well. Again, we’ll start with the “Sultan of Swat”:  Adding up the total of the New Total At Bats in Season gives us a New Total At Bats in Career of 8,890 for Babe Ruth; an extra 491 at bats more than his actual career total of 8,399 thanks to the MLB rule change. Again, now we’ll do the same process for Hank Aaron:  Adding up the total of the New Total At Bats in Season with his total at bats from 1961-1976 gives us a New Total At Bats in Career of 12,577 for Hank Aaron; an extra 213 at bats more than his actual career total of 12,364 thanks to the MLB rule change. Lastly, we can now use each player’s New Total At Bats per Season and multiply it by their home-run percentage (home runs hit in season divided by at bats in season) in order to get their New Home Runs in Season. Then we’ll simply add up the new home runs in each season in order to get the new total career home runs for each player. Like before, we will start with the “Colossus of Clout”:  For one last time, by adding up the total of the New Home Runs in Season, we get the New Total Home Runs in Career of 746 for Babe Ruth; 32 more home runs than his actual career total of 714 thanks to the MLB rule change. These numbers obviously show that Ruth would have been able to increase his home run amount by a fair amount, but still wouldn’t be have enough to top Aaron or Bonds. But will Aaron have the same fate? Let’s check it out:  Adding up the New Home Runs in Season with his total home runs from 1961 to 1976 gives us a New Total Home Runs in Career of 763 for Hank Aaron; 8 more home runs than his actual career total of 755 thanks to the MLB rule change. Thus, had Aaron been able to play 162 games for the first seven years of his career, he likely would have barely had more homers than Bonds, beating him out by literally one career home run. But wait! There’s more! Remember how we mentioned that Babe Ruth was mainly a pitcher during his years with the Red Sox? What if Ruth was able to be the legendary slugger that he went on to be during the first six years of his career? Although Ruth was finally allowed to be a position player in his 5th and 6th years with the Red Sox, he still was used often as a pitcher, pitching in 20 and 17 games respectively. For the purpose of this extra add-on, we’ll recalculate Ruth’s New Home Runs by multiplying his Home Run Percentage for those years with the average New Total At Bats Per Season he had throughout the rest of his career. Let’s do it: *Note: the New Total At Bats in Season from 1920 to 1935 add up to 7,684; dividing this by 16 gives us the Average New Total At Bats in Season of 480.25, which we round down to 480* **Also, since Ruth didn’t hit any homers in 1914, largely due to his lack of games played, we are forced to assume that he still wouldn’t have played often or hit any home runs that year**  Adding up Ruth’s New Home Runs in Season for his first 6 seasons (86) with his New Home Runs in Season for the remaining 16 seasons (693) gives us a New Total Home Runs in Career of 779 for Babe Ruth; 65 more home runs than his actual career total of 714 thanks to the MLB rule change and his being primarily a pitcher for the start of his career. Thus, with the information that we’ve gathered, had all 3 sluggers been able to play as position players their entire career and play 162 games each season, Babe Ruth would likely be our home run king with about 779 homers compared to Aaron’s 763 and Bond’s 762. However, Ruth’s pitching status was a decision made based on his skill at an early age, something that he could have hypothetically changed had he shown a greater aptitude for hitting rather than pitching. On the other hand, the switching of the number of games played each season was an executive decision made by the MLB and totally out of the players’ hands. It is for this reason that I believe that Hank Aaron should be considered baseball’s all-time Home Run King. Even though his new numbers only show him beating Bonds by a mere one home run, he was able to accomplish that feat steroid-free. The topic is still largely up for debate, but I hope this investigation helped to put each of the careers of the three players involved into a better perspective. As always, this post used statistical assumptions that both Ruth and Aaron would continue to hit homers at the same rate they had been doing all season in their extra games. Both players could have hit or more less homers than predicted and thus changed their hypothetical career totals. Thanks again for sticking around and giving this a look. Best wishes, Aaron Springer Sources used: https://www.baseball-reference.com/players/a/aaronha01.shtml https://www.baseball-reference.com/players/r/ruthba01.shtml https://www.baseball-reference.com/players/b/bondsba01.shtml https://en.wikipedia.org/wiki/Babe_Ruth https://en.wikipedia.org/wiki/Hank_Aaron
As we all know, the title of Major League Baseball’s all-time hit king belongs to Peter Edward Rose Sr., known as the iconic Pete Rose. “Charlie Hustle” broke the mold on September 11, 1985, with a single to left-center off of San Diego Padres pitcher Eric Show, making it his 4,1922 hit, presumably breaking the 57-year-old record of 4,191 set by the great Tyrus Raymond Cobb. It has since been discovered that one of Ty Cobb’s games was falsely recorded, meaning “The Georgia Peach” actually ended up with 4,189 base knocks and that Rose technically surpassed him on September 8 of 1985 with a single off of the Chicago Cub’s Reggie Patterson. And thus, the story goes. But does it belong? Society can go on and on about the subjectivity of the term “Hit King”. For the most part, it’s agreed that the “king” of each statistical category in baseball is the player with the most of it – Rickey Henderson is the runs scored and stolen base king, Hank Aaron the RBI king, and Barry Bonds the HR king - despite the wishes of most of baseball’s fans. This means that sitting on the throne of a statistical category is based more on the longevity and consistency of a player’s career than how good that player was at certain periods of time. One could argue that Ichiro Suzuki is the “Hit King” because, in 2004, he set the record of hits in a season with 262. During that season itself, Ichiro was the hit king of baseball. However, because of Ichiro’s ethnicity and the lack of MLB recruiting in Japan at the time, he wasn’t able to play in the big leagues until he was 27, putting him at a major disadvantage for the quest of “Hit King” (comparatively, Rose started playing at age 22 and Cobb at 18). We could go on and on about the lapses and holdbacks in different players’ careers that prevented them from being the best. Whether it be international status, an injury, early retirement, or simply the front office not calling up a player early enough, things happen that are simply unavoidable. For the most part, we can’t relish in the “what ifs?” of baseball and it is for that reason that we crown Pete Rose as our Hit King. With that all being said, I am writing today to present a “what if?” that isn’t rooted in an injury or lack of skill of a player at a young age, but rather in the basic setup of the MLB as a whole: games played. In 1961, the MLB underwent a change in both the NL and AL in which teams would begin playing 162 games a year, a schedule that is still in use today. Prior to that, starting in 1904, teams played only 154 games each, with the exception of the 1919 season which consisted of only 140 games. With Cobb playing from 1905-1928 and Rose from 1963-1986, you may be beginning to see the issue at hand. So let’s take a look. Though Cobb was supposed to play 154 games/year and Rose 162, both players had seasons where they actually exceeded this limit. Cobb played 156 games in 1909 due to tie games being called on May 31 and July 16 of that year. Though most games go into extra innings when it is tied, some games throughout history have been recorded as ties due to darkness (not so much an issue in the modern era), weather, passing curfew, or both teams running out of available pitchers. Similar instances took place in 1915 for Cobb and the Tigers on May 29 and 30, as well as in 1924 on July 10. Likewise, Pete Rose played in 163 games in 1974 when the Reds tied the Braves on September 11 (a day of the year that would become notable to him later on in his career). Though Cobb benefitted more from these “extra game” scenarios, Rose had the bigger advantage as he was seemingly able to play 8 more games than Cobb each year. Thus, for the purpose of this exercise, we will be manipulating the statistics of Ty Cobb’s hitting career to reflect if he had been given the opportunity to play 162 games each season. To begin, we aren’t simply going to calculate the stats as if Ty Cobb had literally played 162 games every year. For one reason or another, baseball players consistently miss games each year even though their teams play a full schedule. Thus we will take the percentage of the total games that Cobb actually played each year and multiply that by the new games per season of 162. Please see the table below: 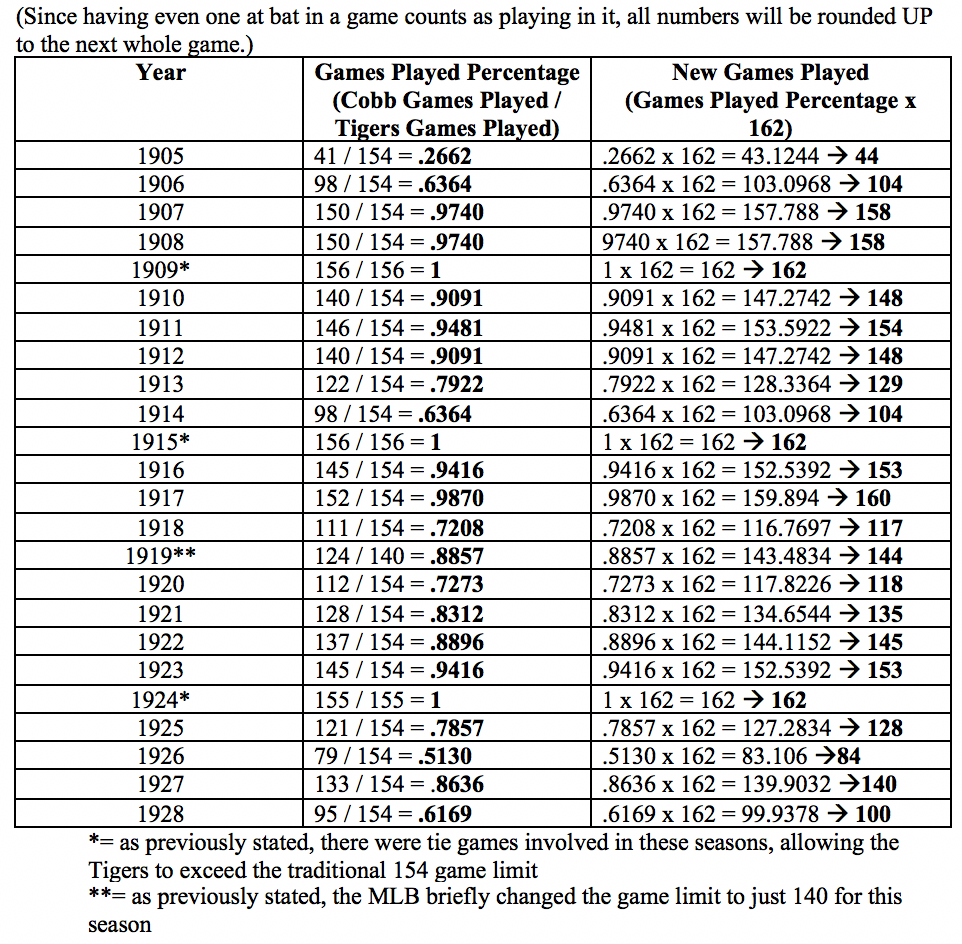 By adding up all of the New Games Played for each season, we get a New Career Games Played of 3,110for Ty Cobb; 76 more games than his actual career total of 3,034 thanks to the MLB rule change. From here, there are mainly two ways in which we can calculate how many additional hits Cobb would have recorded: by using his career batting average or by using his batting average for each individual season. Regardless of which way we do, however, we first must calculate how many additional at-bats Cobb would have had. For this next step, see the table below: 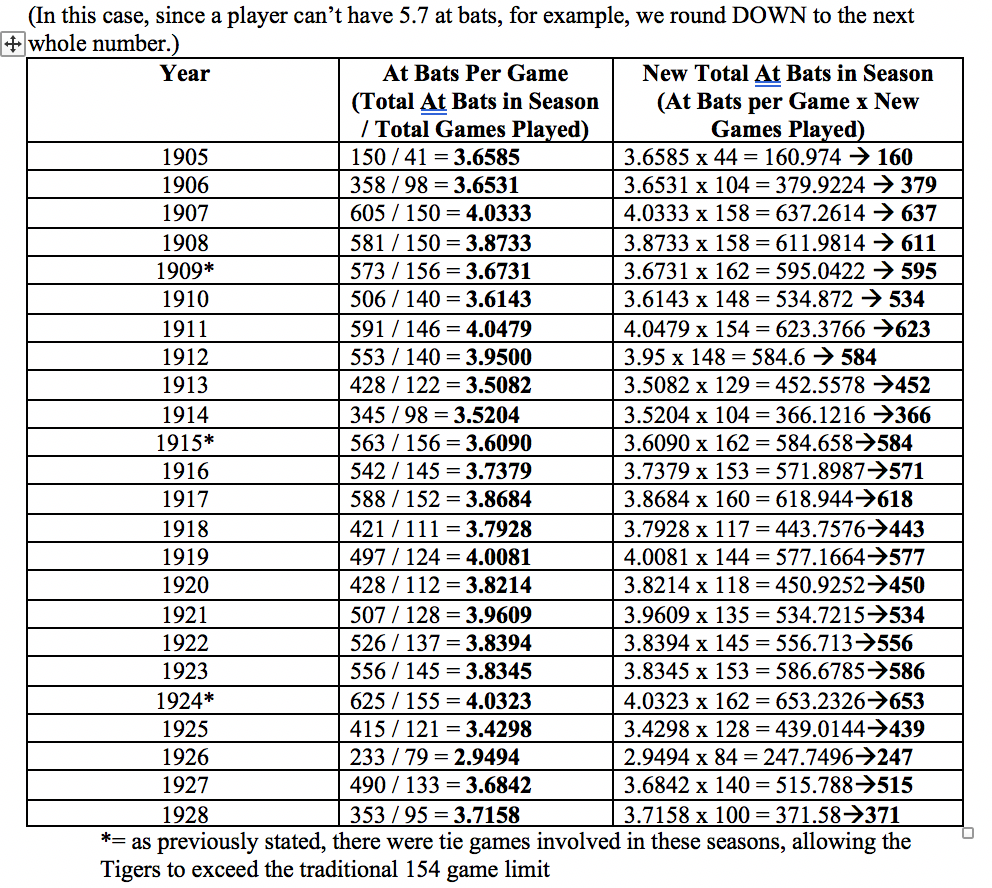 Adding up the total of the New Total At Bats in Season gives us a New Total At Bats in Career of 12,085for Ty Cobb; an extra 651 at bats more than his actual career total of 11,434 thanks to the MLB rule change. Using the first method that we mentioned earlier, which is faster and easier albeit less accurate, we can take Cobb’s New Total At Bats in Career and multiply it by his career batting average to find his rough New Total Hits in Career (12,085 x .366 = 4423.11à4,423). This shows already that Cobb’s hit total would likely have been more than Rose’s had he had the luxury of 162 games per season (Rose finished his career with only 4,256 hits). However, since this is the less accurate way to calculate this new total (and thus less fun way), let’s try it again using Cobb’s batting average for each individual season. For this last step, take a look at the table below:  For one last time, by adding up the total of the New Hits in Season, we get the more accurate New Total Hits in Career of 4,413for Ty Cobb; 224 more hits than his actual career total of 4,189 thanks to the MLB rule change. To summarize, since Cobb’s calculated total of 4,413 is larger than Rose’s career total of 4,256, we can surmise that Ty Cobb would still be the Hit King today had he been given the opportunity to play 162 games a year. As of now, we simply allow whatever player with the most of a statistic to be deemed the King of his statistical category without taking into consideration the massive implications that the 1961 increase in games per season has. Even with Cobb’s adjusted numbers, he would have still played in 452 less games than Rose (3,562-3,110) and had 1,968 less at bats (14,053-12,085), yet still had 157 more career base hits (4,413-4,256). Cobb also posted a much higher career batting average (.366) than Rose did (.303). When it comes down to the numbers, it becomes quite clear that the only reason “Charlie Hustle” ever eclipsed “The Georgia Peach” was because of his additional games per year advantage. It is with this evidence that I from now on believe that Ty Cobb, not Pete Rose, is the greatest hitter of all-time and thus should be crowned Major League Baseball’s Hit King. As with every statistical analysis, this exercise used some assumptions in its process, notably that Ty Cobb would have batted the same he was each year in all of the additional games for each year. Obviously, Cobb could have gone in a slump in his additional games or maybe even hit better than he was, but for the purpose of the exercise (and primarily due to the lack of skill/knowledge of the 2-week-in college freshman writing this), this assumption was made. I hope you all enjoyed reading this and consider adjusting your stance on the Hit King as well, although I’m sure most of you will be from Cincinnati and refuse to do so. I look forward to writing more about statistics and baseball in the future. Thanks for reading and sticking around, Aaron Springer 
A final point that I forgot and would like to add: Ty Cobb would have needed just 68 more hits to pass Rose's mark of 4,256, yet would have had roughly 651 additional at bats had he been able to play 162 games each season. Thus Cobb would have only had to hit a dismal .105 in his "extra" games to break the record... |
Statting Lineup Newsletter Signup Form:
|
|||||||||||||||||||||||||||||||||||||||||||||||||||||||||||||||||||||||||||||||||||||||||||||


