An Application of My New Player Value Metric on the 2010 MLB Season: Fielding Value and Gold Gloves9/5/2022 I have recently unveiled my new metric for assessing player value, which you can read about here. I also made some quick changes to the metric, which you can read about in the addendum here. The goal of this metric is to act like WAR, but be more understandable and transparent. For the time being I'm resorting to just calling it 'Player Value', but am open to name change recommendations. As a quick summary of the metric, each player gets credited and docked for the run-value of each event they achieve, from hitting a home run to striking out. These values are applied on a 'per opportunity' basis, such as per plate appearance or per inning. These are then compared to a player's positional first quartile value. If you hit fewer HR per PA than your position's first quartile, that means you are in the bottom 25% of home run hitters at your position, for example. We multiply the differences by a player's total # of opportunities to credit players that are able to stay healthy and play more. In this post I will apply the Fielding Value portion of my Player Value metric to players in the 2010 season to determine who should have won the Gold Glove at each position in each league. I'll also decide who should have won the Platinum Glove based on Fielding Value, if the award had existed back then. Then I'll look at how Fielding Value varies by position to show that it is not biased towards or against any particular position. Any player that is an elite defender at their position has the chance to add the same amount of value. This is because of the inherent defensive expectations of each position. I don't reward 'more difficult' positions to play like catcher, shortstop, or center field because it is expected that guys that play those positions are good at defense. Each additional out a player makes is basically worth the same, regardless of your position. Your shortstop is likely a better defender than your third baseman, yes. But if you have the best defensive third baseman, that's tremendously valuable; you're getting extra outs from that position that other teams aren't. If your shortstop is pretty average compared to ones on other teams, that's not as valuable. We could move the shortstop to third and he would fare better defensively, but likely will fare worse offensively. A player can either uphold the standards of his position or not. I will end by looking at each team's aggregate Fielding Value to show that it does a good job of explaining the runs that a team allows. Here's a look at the defensive expectations (first quartile values) by position in 2010:  Catchers and first basemen clearly have higher fielding percentages, make more putouts, and have higher ranges (make more outs per game). Third basemen and shortstops make more assists and more errors. Outfielders get far less defensive chances. It is because of these positional differences that we must compare on a position basis. Even applying the run value of the events leaves things skewed, as we can see in the 'FieldVA' column above that different positions have very different Field Value Average expectations. I chose this season because as a kid from Cincinnati, 2010 was the first good season in my Reds fandom. We made the playoffs for the first time in my life (first berth since 1995) and Joey Votto won the MVP. I thought it would be cool to see if Votto's MVP was merited and if my Player Value metric can explain the success of the Reds (and other teams) that season. Three Reds players won Gold Gloves in 2010 as well. I am eventually going to step through the different awards and look at who actually won them in 2010 compared to who should have won them, according to Player Value. Again in this post I'll just examine the Gold Gloves and Platinum Gloves, but in later posts I'll look at Silver Sluggers, Rookies of the Year, MVPs, Hank Aarons, Relievers of the Year, and Cy Youngs. I can't do hypothetical All-Stars since I don't have the data for specifically the first half of the season only, but I will also determine some First Team and Second Team honors in later posts. Here's a quick reminder of the run value weights for the relevant defensive events: Putout by a non catcher or first baseman: .33 runs Unassisted Putout by a first baseman: .33 runs Non-strikeout Putout by a catcher: .33 runs Assisted Putout by a first baseman: .2*.33 = .066 runs Strikeout Putout by a catcher: .33*.33 = .1089 runs Assist: .8*.33 = .264 runs Error: -.68 runs Double Play: .10 runs Passed Ball: -.26 runs Stolen Base allowed by catcher: -.15 runs Caught Stealing by catcher: .39 runs Note that I don't claim ultimate precision for my run value weights, so these have been rounded to 2 decimal places from the values shown in the Player Value explanation posts. GOLD GLOVES View the 2010 AL Gold Glove winners here. View the 2010 NL Gold Glove winners here. Read how the Gold Gloves are decided and the requirements here. The awards are given out based on a combo of MLB coaches voting and the SABR Defensive Index, which itself is a mix of several different defensive measures. Catchers NL Catcher Actual Winner: Yadier Molina, St. Louis Cardinals NL Catcher Player Value Winner: Miguel Olivo, Colorado Rockies
Olivo led all catchers in MLB in 2010 with a Fielding Value of 20.06. Molina finished 4th overall in MLB, and was the 3rd highest in the NL, with a Fielding Value of 16.02. Olivo had a Fielding Value Average of .3817, while Molina had a Fielding Value Average of .3913. The first quartile value for catchers is .2600. The disparity here is because the rate version of Fielding Value does not take the catcher and first base adjustments into consideration, nor does it account for comparing to a player's positional first quartile. Olivo played all 111 of his games at catcher, so he was 100% a catcher. Molina played 135 games at catcher and 7 at first base, so he was only a 95.07% catcher. Thus their positional first quartile values were slightly different, since I weight each player's quartiles based on their proportion of time played at each position. Olivo played 935 innings and Yadier played 1,145 innings. In the eyes of fielding percentage, it makes sense why Molina won. Yadi had a .9950 fielding percentage, above his positional first quartile of .9911. Olivo had a .9900 fielding percentage, actually below his positional first quartile of .9910. It is in terms of range factor that Olivo comes out on top. His range factor per game (RFG) of 7.95 and range factor per 9 innings (RF9) of 8.50 are both well above the catcher first quartile of 6.66 (sorry, folks) and 7.35. Molina's values are 6.91 vs 6.75 and 7.71 vs 7.43. So on a rate basis Molina made fewer errors than Olivo, but Olivo was making more outs than Molina. As for throwing runners out, the catcher first quartile was a 22.77% caught stealing rate. Olivo was well above this at 42.31%, but Molina was even better at 48.53%. However, Olivo was confronted with having to throw runners out more frequently; runners tried to steal on him 78 times, but on Yadi just 68 times. The rate basis matters, but so too does how often you threw guys out at that rate. Throwing out 90% of 1,000 runners is better than throwing out 95% of 100 runners. Those are the more traditional catcher fielding metrics; how about the metrics that Fielding Value actually considers? Olivo made .878 putouts per inning, .066 assists per inning, .01 errors per inning, .01 double plays per inning, allowed .011 passed balls per inning, and had .083 runners attempt to steal on him per inning. Molina's values are .788 PO/Inn, .069 A/Inn, .004 E/Inn, .007 DP/Inn, .011 PB/Inn, and .059 CSopps/Inn. So sure, Molina on a rate basis was throwing more guys out and making fewer errors. But on a per opportunity basis, Olivo was making more outs and having to try to throw more guys out, which he still did at a high rate. Recall that we adjust catchers putouts that are via strikeouts. We assume this is the case for 93% of their putouts, and we give them credit for .33 of the value for these strikeout putouts. The non-strikeout putouts (the other 7%) get the full regular value of a putout. The final values come out that Olivo threw out 15.24 more runners than his positional first quartile, allowed 6.43 fewer runners to steal on him, allowed 6.36 more passed balls, made 5.01 more double plays, recorded 4.59 more errors, had 19.25 more assists, had 92.31 more strikeout putouts, and had 6.95 more non-strikeout putouts. Molina threw out 18.28 more runners, allowed 7.63 less steals, allowed 2.77 more passed balls, made 2.67 more double plays, recorded .31 fewer errors, had 25.73 more assists, had 8.63 more strikeout putouts, .65 more non-strikeout putouts, and .43 more assisted putouts and .05 more unassisted putouts for his time at first base. As an example calculation for Olivo, that would be: 15.24*.39 - 6.43*-.15 + 6.36*-.26 + 5.01*.10 + 4.59*-.68 + 19.25*.8*.33 + 92.31*.33*.33 + 6.95*.33 = 20.07. This is slightly off due to rounding. Nick Hundley had the most putouts above the catcher first quartile in the NL, but Olivo was still near the top while Yadi was near the middle. Yadi did have the most assists, but Olivo was also towards the top. Yadi also had the most caught stealings, but Olivo was 2nd. Olivo was towards the top for double plays, Yadi wasn't. Yadi was on the lower end of errors, while Olivo was on the higher end. In considering all of these with their run value weights, it's Miguel Olivo that comes out on top. Baseball Reference WAR had Molina at an Rfield of 20 in 2010, with Olivo at 11. FanGraphs had Molina with 26 Defensive Runs Saved (DRS) and 26.4 framing runs. Molina had the highest DRS among NL catchers in 2010. They had Olivo at 10 DRS and -3.4 framing runs. So those metrics tend to prefer Molina as the Gold Glove system did. I'll again highlight that Molina was not graded poorly by Fielding Value; he was the 3rd best defensive catcher in the NL. Shoutout to Jonathan Lucroy of the Milwaukee Brewers, who finished 2nd in the NL with a Fielding Value of 18.24. The advanced metrics liked him more; just 4 Rfield, but 22 DRS and 28.3 framing (highest in NL in 2010). The worst defensive catcher in the NL was Ryan Doumit of the Pittsburgh Pirates, who had a Fielding Value of -18.25. The advanced metrics give him an Rfield of -11, -15 DRS (worst in NL), and -20.6 framing (worst in NL). Overall compared to the other advanced defensive metrics, I believe my Fielding Value has tracked well. AL Catcher Actual Winner: Joe Mauer, Minnesota Twins AL Catcher Player Value Winner: Jose Molina, Toronto Blue Jays
So Yadi doesn't get his Gold Glove, but his brother Jose does. Jose Molina led all AL catchers and was 3rd in MLB overall with a Fielding Value of 16.24, just above his brother Yadier. Their brother Bengie also fared pretty well, with a Fielding Value of 9.56. The Molinas could field! Joe Mauer, on the other hand, had a Fielding Value of just -6.30, one of the worst in the AL and MLB overall. Molina's Fielding Value Average was .4199, and Mauer's was just .2427. The first quartile value for catchers is .2600. I'll note that Jose Molina technically wouldn't qualify for the Gold Glove under its minimum playing requirements, as he only played in 56 games. However, the Fielding Value metric does take innings played into consideration; Molina was so defensively great during those 56 games that he was more than able to make up for the 100+ games that he didn't appear in. If we want to be super technical and live and die by the Gold Glove's requirements, then the highest qualifying AL catcher would be Gerald Laird of the Detroit Tigers, who had a Fielding Value of 7.65. Qualifications aside, Bengie Molina would be the 2nd highest AL catcher; he split that season with the Giants and the Rangers, so his 57 games in the AL also wouldn't have been enough. Jose appeared in 56 games at catcher and 1 game as the DH, so he was 98% a catcher. Mauer played in 112 games at catcher and 23 games at DH, so he was 83% a catcher. Note that since DHs don't field, they won't alter the fielding side of our positional first quartiles. Solely defensively speaking, both Jose and Joe were 100% catchers. Jose played about 445 innings, and Mauer played about 952 innings. Both Joe Mauer and Jose Molina had a .996 fielding percentage compared to the positional first quartile of .991. Jose had an RFG of 8.11 and an RF9 of 9.19. Joe's values were 6.52 and 6.90, both below the first quartile values of 6.66 (sorry again, folks) and 7.35. Joe threw out 26.39% of runners, compared to the first quartile mark of 22.77%, but Jose was much better at 44.12%. Given the disparity in innings played, we'll focus on their per inning values. Molina had .938 PO/Inn, .083 A/Inn, .004 E/Inn, .007 DP/Inn, .011 PB/Inn, and .076 CSopps/Inn. Mauer had .731 PO/Inn, .036 A/Inn, .003 E/Inn, .003 DP/Inn, .004 PB/Inn, and also .076 CSopps/Inn. So Mauer is making fewer errors and allowing less passed balls, which certainly are good things, but these don't make up for the superior ability of Molina to make outs overall. Overall compared to the level of a first quartile catcher, Molina gave you 16.67 more assists, .1 less errors, 1.1 more double plays, 3.27 more passed balls, 3.42 fewer stolen bases, 7.26 more caught stealings, 68.59 more strikeout putouts, and 5.16 more non-strikeout putouts. Mauer gave you 6.51 fewer assists, 1.49 less errors, 1.06 less double plays, .3 more passed balls, 5.52 more stolen bases, 2.6 more caught stealings, 35.91 less strikeout putouts, and 2.7 less non-strikeout putouts. Jose Molina had an Rfield of 4, a DRS of 11, and 22.8 framing, the highest in the AL in 2010. Joe Mauer had an Rfield of 3, a DRS of 3, and 5.5 framing. These advanced metrics agree with me that Molina was the better fielder than Mauer. The AL catcher with the highest DRS was Matt Wieters of the Orioles, with 15. My metric didn't like Wieters as much, giving him -1.46 Fielding Value. The worst defensive catcher in the AL was Jorge Posada of the New York Yankees, with a Fielding Value of -7.63. Posada had an Rfield of -14. His DRS of -30 and framing of -23.3 were worst in the AL and MLB overall. First Basemen NL First Base Actual Winner: Albert Pujols, St.Louis Cardinals NL First Base Player Value Winner: Albert Pujols, St.Louis Cardinals  Not much to debate here, we got this one right! Albert had a Fielding Value of 39.50, the highest among first basemen in the NL and MLB, and the highest of any player at any position in 2010. This sounds uncharacteristic of Pujols, but he truly was a great fielder this season. He had a Fielding Value Average of .3946, compared the first basemen quartile of .3393. Pujols' closest competitor was Aubrey Huff of the San Francisco Giants, who had a Fielding Value of 19.92, the 3rd highest among MLB first basemen. But since the actual award winner aligns with who Fielding Value prefers, I won't drag this out and compare Pujols to Huff at length. I will note that Huff only played first 56% of the time, spending 26% of his time in left field and 19% of his time in right field. Albert played about 1,381 innings in 157 games all at first base, making him 100% a first basemen. His .998 fielding percentage was above the first quartile of .9923. His RFG of 10.29 and RF9 of 10.53 were above the first quartiles of 8.56 and 9.11. His efforts led to 168.3 more assisted putouts, 18.7 more unassisted putouts, 71.52 more assists, .27 less errors, and 31.51 more double plays than the first quartile first basemen. Pujols had an Rfield of 8, a DRS of 6, and an Ultimate Zone Rating (UZR) of 1.8. Those last two values ranked 8th and 16th in MLB. Ike Davis of the New York Mets had the highest DRS in the NL at 13, and the highest UZR in the NL at 10.4. His Fielding Value is 13.49, good for 3rd best in the NL. The worst defensive first baseman in the NL was Gaby Sanchez of the Florida Marlins, with a Fielding Value of -11.12. Sanchez had an Rfield of -10, a DRS of -10, and an UZR of 0.7. His DRS was 6th worst in the NL and MLB. Prince Fielder of the Milwaukee Brewers had the worst DRS in the NL and MLB, with -17. He was the 2nd worst in the NL and 3rd worst in MLB with a Fielding Value of -4.64. Ryan Howard of the Philadelphia Phillies had the worst UZR in the NL at -12.4, with a mediocre Fielding Value of 2.50. AL First Base Actual Winner: Mark Teixeira, New York Yankees AL First Base Player Value Winner: Michael Cuddyer, Minnesota Twins
Cuddyer was 2nd best among MLB first basemen overall and the highest in the AL with a Fielding Value of 21.89. Teixeira was somewhat middle of the pack with a Fielding Value of 7.18, about 8th best in the AL. Cuddyer had a Fielding Value Average of .2287 (compared to his quartile of .2083) and Teixeira had a Fielding Value Average of .3429, compared to the first base quartile of .3393. It can be argued that Cuddyer shouldn't be crowned because he only played 50.3% of his 167 game appearances at first base, or even that his values are somewhat skewed by his fielding diversity, as he played in right field about 40% of the time and at third base another 8% of the time. If that's your stance, then feel free to consider Lyle Overbay of the Toronto Blue Jays as your true 'should have' first base winner. He had a Fielding Value of 16.53 for the 4th most in MLB and was 100% a first basemen. Teixeira was a first baseman 94% of the time and a DH the other 6%, so that won't effect his fielding results any. Cuddyer had a .994 fielding percentage compared to his quartile of .9853. Teixeira had a .998 fielding percentage compared to his quartile of .9923. Cuddyer's RFG is 5.70 vs 5.28 and his RF9 is 6.18 vs 5.65, while Teixeira's RFG is 8.77 vs 8.56 and his RF9 is 9.11 vs 9.11. Cuddyer played 4,160 innings in the field, while Teixeira 3,875. Since both players have pretty different first quartile comparisons, I won't dive into their per inning values. In aggregate compared to their first quartiles, Cuddyer got you 54.47 more putouts while he wasn't a first baseman, 49.62 more assisted putouts as a first baseman, 5.51 more unassisted putouts as a first baseman, 3.68 less assists, 1.76 more errors, and 9.95 more double plays. Teixeira got you 34.14 more assisted putouts, 3.79 more unassisted putouts, .03 more assists, 1 less error, and 29.89 more double plays. Teixeira had an Rfield of 6, a DRS of 6 (4th highest in AL), and an UZR of -1.6. Cuddyer had an Rfield of -20, a DRS of -8, and an UZR of -6.7. So these metrics disagree pretty strongly with Fielding Value on Cuddyer; in fact, his DRS and UZR were worst in the AL among first basemen. Daric Barton of the Oakland Athletics had the highest DRS in the AL at 19, and the highest UZR in the AL at 11.8. Fielding Value liked Barton pretty well, scoring him at 12.13 for the 4th highest in the AL. The worst defensive first baseman in the AL was Mike Napoli of the Los Angeles Angels of Anaheim, with a Fielding Value of -6.96. His Rfield was -6, his DRS was 0, and his UZR was 0.7. Paul Konerko of the Chicago White Sox had the worst DRS in the AL at -12, and the worst UZR in the AL and MLB at -14. I actually had Konerko faring pretty well with a Fielding Value of 9.72. Second Basemen NL Second Base Actual Winner: Brandon Phillips, Cincinnati Reds NL Second Base Player Value Winner: Clint Barmes, Colorado Rockies
As a Reds fan it hurt to see BP not come out on top, but he still did pretty well. Barmes led the NL and was 3rd in MLB with a Fielding Value of 20.67. Phillips was 4th in the NL with a Fielding Value of 15.91. Clint had a Fielding Value Average of .1854 against his quartile of .1616, while BP had a Fielding Value Average of .1819 against the second base quartile of .1700. Clint spent about 65% of his time at second and about 35% of his time at shortstop. BP was 100% a second basemen. Clint played about 995 innings, and BP played 1,311 innings. Clint's fielding percentage comparisons are .982 vs .9751, while BP's are .996 vs .9803. Clint's RFG and RF9 comparison are 4.06 vs 4.13 and 4.99 vs 4.47, whereas Brandon's are 4.61 vs 4.29 and 4.81 vs 4.66. The traditional stats clearly favor Brandon, so it's no shocker that he won. After comparing their per inning values to their quartile's per inning values and then multiplying by their innings played, we see that Barmes would have gotten you 23.76 more putouts, 45.59 more assists, 3.10 more errors, and 28.96 more double plays. Phillips would have gotten you 7.36 more putouts, 38.69 more assists, 3.4 less errors, and 9.56 more double plays. Phillips gets you less errors, but Barmes gets you more outs. Barmes basically only appeared worse on a rate basis because of the time he spent playing shortstop. Barmes had an Rfield of 13, but FanGraphs calculates their metrics differently for guys at each position. As a second baseman, he had a DRS of 3 and an UZR of -.9, which are pretty unimpressive. But as a shortstop, he had a DRS of 8 and an UZR of 4.5. Phillips had an Rfield of 10, a DRS of 11, and an UZR of 8.2. So Fielding Value and Rfield at least agree on these players. Chase Utley had the highest DRS in the NL at 17 and the highest UZR in the NL and MLB at 10.4. Utley's Fielding Value was 18.27, good for 3rd best in the NL. The worst defensive second baseman in the NL was Adam Kennedy of the Washington Nationals, with a Fielding Value of -14.01. His Rfield was 0, his DRS was -1 and his UZR was 2. Skip Schumaker had the worst DRS in the NL at -16 and the UZR in the NL at -14.4. Fielding Value disagrees very strongly, scoring him at 20.36 for the 2nd best in the NL and 3rd best in MLB. Schumaker's fielding percentage is below the first quartile, but his range factors are well above the first quartiles. AL Second Base Actual Winner: Robinson Cano, New York Yankees AL Second Base Player Value Winner: Robinson Cano, New York Yankees  Hey, our second case of complete agreement! Cano led the AL and all of MLB second basemen with a Fielding Value of 28.81. This was good for the 5th highest across all positions in both leagues. His Fielding Value Average was .1898, compared to the second base first quartile of .1700. Cano appeared in 158 games at second and in 2 games as a DH, making him about 99% a second baseman and just 1% a DH. He played in about 1,393 innings. He boasted a .996 fielding percentage compared to the first quartile of .9803, with a 4.89 vs 4.29 RFG comparison and a 4.99 vs 4.66 RF9 comparison. In total Cano got you 50.18 more putouts, 27.81 more assists, 3.8 less errors, and 23.19 more double plays. It is no surprise that he won the Gold Glove. Cano had an Rfield of 16, a DRS of 18 (highest in the AL and MLB), and a UZR of -.5. The highest UZR in the AL was Orlando Hudson of the Minnesota Twins at 8.7. Hudson's Fielding Value was 26.63, the 2nd highest in the AL and MLB. The worse defensive second baseman in the AL was Chone Figgins of the Seattle Mariners, with a Fielding Value of -12.85. He had an Rfield of -10, a DRS of -7, and an UZR of -11.1 (worst in the AL). The worst DRS in the AL was Mike Aviles of the Kansas City Royals at -8, who actually had a decent Fielding Value of 10.2 Third Basemen NL Third Base Actual Winner: Scott Rolen, Cincinnati Reds NL Third Base Player Value Winner: Placido Polanco, Philladelphi Phillies
Alas it appears that I've done another Reds player dirty. Polanco led the NL and MLB with a Fielding Value of 22.02. Rolen still fared well and finished 2nd in the NL with a Fielding Value of 16.67. Polanco's Fielding Value Average was .1139 vs a first quartile of .0916 and Rolen's was .1026 vs .0839. Rolen was 100% a third baseman, while Polanco played third about 91% of the time and second the other 9% of the time. Polanco played 1,157 innings and Rolen played 1,074 innings. Polanco had a fielding percentage of .988 compared to his first quartile of .9545, a RFG of 2.95 vs 2.50, and an RF9 of 3.1 vs 2.68. Rolen had comparisons of .977 vs .952 for fielding percentage, 2.63 vs 2.33 for RFG, and 2.87 vs 2.48 for RF9. Compared to their first quartiles, Polanco would have gotten you 12.52 more putouts, 50.27 more assists, 4.98 less errors, and 12.28 more double plays. Rolen would have gotten you 12.72 more putouts, 40.13 more assists, 1.65 less errors, and 7.61 more double plays. Polanco had an Rfield of 11, a DRS of 7, and an UZR of 11.4 (third highest in NL). Rolen had an Rfield of 10, a DRS of 10, and an UZR of 10 (fourth highest in NL). Chase Headley had the highest DRS in the NL at 16, and the highest UZR in the NL at 16.5. Fielding Value doesn't think much of him, rating him at -2.53. The worst defensive third baseman in the NL was Jorge Cantu of the Florida Marlins (primarily, for 97 games) and the Texas Rangers (for 30 games), with a Fielding Value of -29.49. Cantu also was actually the worst fielder across all positions and both leagues in 2010. He had an Rfield of -13 with the Marlins and -2 with the Rangers. He had a DRS of -13 and an UZR of -9.2, both third worst in the NL. Aramis Ramirez of the Chicago Cubs had the worst DRS in the NL at -15, and had the third worst Fielding Value in the NL at -12.76. David Wright of the New York Mets had the worst UZR in the NL at -11, but was favorably seen by Fielding Value with a rating of 13.11, the third best in the NL. If we want to be strict and only focus on players that played entirely in the NL in 2010, then Chris Johnson of the Houston Astros was the worst with a Fielding Value of -17.67. AL Third Base Actual Winner: Evan Longoria, Tamba Bay Rays AL Third Base Player Value Winner: Jose Lopez, Seattle Mariners
Lopez led the AL and was 2nd in MLB with a Fielding Value of 21.81. Longoria was still viewed favorably, finishing 5th in the AL with a Fielding Value of 15.13. Lopez had a Fielding Value Average of .1056 and Longoria had a Fielding Value Average of .0962. Both guys were 100% third basemen, where the first quartile Fielding Value Average was .0839. Lopez played about 1,253 innings and Longoria played about 1,331 innings. Lopez's fielding percentage was .960 and Longoria's was .966, both compared to the third base first quartile of .952. Lopez's RFG and RF9 were 3.02 and 3.08 while Longoria's were 2.67 and 2.73, with the first quartile values being 2.33 and 2.48. Lopez would have gotten you 25.03 more putouts, 66.72 more assists, 6.75 more errors, and 5.22 more double plays. Longoria would have gotten you 39.92 more putouts, 4.83 more assists, 2.05 more erros, and 20.74 more double plays. Lopez had an Rfield of 10, a DRS of 11 (4th best in AL) and an UZR of 8.7 (also 4th best in AL). Longoria had an Rfield of 20, a DRS of 17 (2nd best in the AL and MLB), and an UZR of 12.1 (2nd best in the AL and 4th best in MLB). The highest DRS in the AL was Adrian Beltre of the Boston Red Sox with 20, who had a Fielding Value of 15.38 (4th best in AL). The highest UZR in the AL was Kevin Kouzmanoff of the Oakland Athletics with 15.3, who had a Fielding Value of 10.16. The worst defensive third baseman in the AL was Wilson Betemit of the Kansas City Royals, with a Fielding Value of -11.95. I'll note again that Jorge Cantu was worse and spent part of the season in the AL with the Rangers, but most of the year he was in the NL with the Marlins. Betemit had an Rfield of -15, a DRS of -13 (worst in the AL, 5th worst in MLB), and an UZR of -10.1 (worst in the AL, 2nd worst in MLB). Shortstops NL Shortstop Actual Winner: Troy Tulowitzki, Colorado Rockies NL Shortstop Player Value Winner: Troy Tulowitzki, Colorado Rockies  Another point of total agreement! Tulo led the NL and all of MLB at SS with a Fielding Value of 35.48. This was good for the 2nd most across all positions and both leagues, behind only Pujols. His Fielding Value Average was .1889 compared to the positional first quartile of .1475. Tulowitzki played in 1,065 innings and was 100% a shortstop in his 122 games. He had a .984 fielding percentage vs the shortstop first quartile of .9658, a RFG of 4.91 vs 3.86, and an RF9 of 5.06 vs 4.16. Tulo would have given you 42.83 more putouts, 62.70 more assists, 1.43 less errors, and 38.23 more double plays. Tulowitzki had an Rfield of 19, a DRS of 16 (2nd/3rd highest in NL), and an UZR of 6.6 (4th highest in NL). The highest DRS in MLB was Alex Gonzalez, who split time that season between the Toronto Blue Jays (AL, 85 games) and the Atlanta Braves (NL, 72 games). Gonzalez had a DRS of 26, and Fielding Value rates him at 11.31. The highest DRS by a solely NL player was Brendan Ryan of the St. Louis Cardinals at 24, who had a Fielding Value of 28.89 (2nd highest in the NL, 3rd highest in MLB). Ryan also had the highest UZR in the NL and MLB at 13.3. The worst defensive shortstop in the NL was Edgar Renteria of the San Francisco Giants, with a Fielding Value of -7.02. This was 5th worst in MLB at short overall. His Rfield was -2, his DRS was -2, and his UZR was 1.8. Hanley Ramirez of the Florida Marlins had the worst DRS in the NL at -17 and the worst UZR in the NL at -9.5. His Fielding Value was -6.86, 2nd worst in the NL. AL Shortstop Actual Winner: Derek Jeter, New York Yankees AL Shortstop Player Value Winner: Alexei Ramirez, Chicago White Sox
Ah, the classic 'Jeter was an overrated fielder' discussion' Maybe at least one of his 5 career Gold Gloves will be deserving, but that's not the case for this year. Ramirez led the AL and was 2nd in MLB at SS with a Fielding Value of 30.13. Jeter had a Fielding Value of -9.73, 3rd worst in the AL and MLB! Both these guys were 100% shortstops, where the first quartile Fielding Value Average was .1475. Ramirez had a Fielding Value Average of .1773, and Jeter's was .1425. Ramirez had the 3rd highest Fielding Value across all positions and leagues, behind Pujols and Tulowitzki. Jeter played about 1,304 innings and Ramirez played about 1,377. The shortstop first quartile fielding percentage was .9658, Jeter's was .989, and Ramirez's was .974. But in terms of RFG and RF9, the first quartile values were 3.86 and 4.16, Ramirez had values of 4.79 and 4.89, and Jeter had values of 3.62 and 3.78. Ramirez would have gotten you 31.61 more putouts, 78.51 more assists, 5.22 more errors, and 25.28 more double plays. Jeter would have gotten you 23.86 less putouts, 33.2 less assists, 7.99 less errors, and 14.72 more double plays. Jeter was great at making the routine plays (avoiding errors) but not so much at making plays (having good range). Ramirez had an Rfield of 20, a DRS of 20 (highest in the AL, 3rd most in MLB), and an UZR of 10.5 (highest in AL, 2nd most in MLB). Jeter had an Rfield of -9, a DRS of -5, and an UZR of -4.4. The aforementioned Alex Gonzalez would have been the closest in terms of DRS and UZR. Cliff Pennington of the Oakland Athletics had the next highest Fielding Value in the AL at 24.28. The worst defensive shortstop in the AL was Marco Scutaro of the Boston Red Sox, with a Fielding Value of -21.54. His Rfield was 0, his DRS was -2, and his UZR was -4. Yuniesky Betancourt had the worst DRS and UZR in the AL and in MLB at -23 and -11.5, respectively. Fielding Value disagrees very strongly, rating him at 15.84, the 3rd or 4th most in the AL depending on how you view Gonzalez. Just looking at his baseline stats of fielding percentage, RFG, and RF9, and comparing them to the first quartile, Betancourt is well above the quartile in each, so I'm inclined to believe Fielding Value has him right. Outfielders NL Outfield Actual Winner #1: Michael Bourn, Houston Astros NL Outfield Actual Winner #2: Carlos Gonzalez, Colorado Rockies NL Outfield Actual Winner #3: Shane Victorino, Philadelphia Phillies NL Outfield Player Value Winner #1: Jay Bruce, Cincinnati Reds (Best RF) NL Outfield Player Value Winner #2: Angel Pagan, New York Mets (Best CF) NL Outfield Player Value Winner #3: Andres Torres, San Francisco Giants NL Leftfield Player Value Winner: Gerardo Parra, Arizona Diamondbacks
The outfield Gold Gloves are a little weird in that they aren't position specific. They don't go to the best defensive LF/CF/RF, but rather to the 3 best outfielders overall, which normally results in all centerfielders. I find this to be unfair to the quality corner outfielders. Each position has its own offensive and defensive expectations; a right fielder that can exceed those expectations by a greater amount than a center fielder should be rewarded. Sure, the center fielder is probably the better defender, but he's also more easily replaced by any other center fielder; the right fielder would have unique fielding talent. Thus, I don't compare all outfielders to some overall outfielder first quartile, because then we'd just get a bunch of centerfielders being the best fielders and a bunch of corner outfielders being the best hitters. Rather, I compare each outfield position to its own positional first quartile, and then aggregate the comparisons across all outfield positions. So I don't reward the 3 Gold Gloves to the best LF, best CF, and best RF. That's because the 2nd best CF may still have a greater difference above the first quartile than say the best LF, for example. That all said, Jay Bruce led all right fielders and outfielders in the NL and MLB with a Fielding Value of 27.58. Hey, I've given the Reds a Gold Glove after taking 2 away! Angel Pagan led all center fielders in the NL with a Fielding Value of 18.48. Andres Torres was 2nd among NL center fielders with a Fielding Value of 16.33. Gerardo Parra was the best defensive left fielder in the NL with a Fielding Value of 16.03, but he doesn't get a Gold Glove. Michael Bourn had a Fielding Value of 10.89, Carlos Gonzalez had a Fielding Value of -4.42, and Shane Victorino had a Fielding Value of 6. So the NL was 0 for 3 on getting the Gold Gloves right, according to Fielding Value. 'Cargo' was a pretty diverse outfielder, spending about 39% of his time in LF, 36% in CF, and 25% in RF. Victorino and Bourn were 100% center fielders, and Bruce was 100% a right fielder. Pagan was diverse too, with a 18%/61%/21% split between LF/CF/RF, and so too was Torres, with a 23%/51%/26% split. Gerardo Parra had a 64%/6%/30% split. Now let's fire out some fielding percentage, RFG, and RF9 comparisons to first quartiles, for each player, in that order: Bruce .992 vs .9835, 2.40 vs 1.85, and 2.63 vs 2.02 Pagan .987 vs .9848, 2.45 vs 2.13, and 2.71 vs 2.29 Torres .997 vs .9845, 1.96 vs 2.06, and 2.58 vs 2.23 Bourn .992 vs .986, 2.66 vs 2.38, and 2.78 vs 2.54 Victorino .995 vs .986, 2.59 vs 2.38, and 2.38 vs 2.65 Gonzalez .996 vs .9838, 1.66 vs 1.94, and 1.96 vs 2.11 And now let's fire out some putouts, assists, errors, and double plays above/below the first quartiles, for each player, in that order: Bruce +83.95 PO, +1.82 A, +0.89 E, +0 DP Pagan +56.65 PO, +6.37 A, +3.04 E, +1.78 DP Torres +44.56 PO, +3.58 A, -0.74 E, +1.76 DP Bourn +30.44 PO, +5.35 A, +1.12 E, +2 DP Victorino +10.44 PO, +8.18 A, +0 E, +4 DP Gonzalez -18.56 PO, +4.05 A, -0.83 E, +0.75 DP And lastly, let's fire out some Rfield, DRS, and UZR values for each player, in that order: Bruce 17 Rfield, 16 DRS, 19.6 UZR Pagan 21 Rfield, 19 DRS, 16.1 UZR Torres 17 Rfield, 14 DRS, 21.7 UZR (highest in the NL) Bourn 30 Rfield, 28 DRS (highest in the NL), 19.8 UZR Victorino 1 Rfield, 1 DRS, 1.3 UZR Gonzalez 2 Rfield, 1 DRS, -1.5 UZR The worst defensive outfielders in the NL were Carlos Lee of the Houston Astros with a Fielding Value of -19, Colby Rasmus of the St. Louis Cardinals with a Fielding Value of -17.57, and Matt Kemp of the Los Angeles Dodgers with a Fielding Value of -15.56. Here are their Rfield, DRS, and UZR values: Lee -17 Rfield, -16 DRS, -17.7 UZR (2nd worst in the NL) Rasmus -6 Rfield, -5 DRS, -6 UZR Kemp -37 Rfield, -33 DRS (worst in the NL and MLB), -25.8 UZR (worst in the NL and MLB) AL Outfield Actual Winner #1: Ichiro Suzuki, Seattle Mariners AL Outfield Actual Winner #2: Franklin Gutierrez, Seattle Mariners AL Outfield Actual Winner #3: Carl Crawford, Tampa Bay Rays AL Outfield Player Value Winner #1: Carl Crawford, Tampa Bay Rays (Best LF) AL Outfield Player Value Winner #2: Franklin Gutierrez, Seattle Mariners (Best CF) AL Outfield Player Value Winner #3: Adam Jones, Baltimore Orioles AL Rightfield Player Value Winner: Nelson Cruz, Texas Rangers
The AL fared better, getting 2 out of the 3 Gold Gloves correct according to Fielding Value. Crawford led all left fielders in the AL and MLB and led all outfielders in the AL with a Fielding Value of 23.28. Gutierrez led all center fielders in the AL and MLB with a Fielding Value of 20.99. Adam Jones was 2nd among AL center fielders with a Fielding Value of 20.54. Nelson Cruz doesn't get a Gold Glove, but he did lead the AL among right fielders with a Fielding Value 17.75. Ichiro gets his 10th and last career Gold Glove stripped, falling behind Cruz to finish 2nd in the AL among right fielders with a Fielding Value of 15.37. Crawford was a 98% LF and 2% DH. Gutierrez was a 97% CF and 3% DH. Jones was 100% a CF. Cruz was a 13% LF, 85% RF, and 3% DH. Ichiro was a 99% RF and a 1% DH. Here are their fielding percentage, RFG, and RF9 comparisons: Crawford .994 vs .9823, 2.13 vs 1.61, 2.24 vs 1.76 Gutierrez 1.000 vs .986, 2.84 vs 2.38, 2.92 vs 2.54 Jones .984 vs .986, 2.91 vs 2.38, 3.01 vs 2.54 Ichiro .989 vs .9835, 2.26 vs 1.85, 2.30 vs 2.02 Cruz .981 vs .9832, 2.34 vs 1.81, 2.56 vs 1.99 I went ahead and included Cruz since having a now-prominent DH rating higher than the legendary Ichiro is interesting, and since the AL got 2 players right already we have less other players to compare to. Here are their above/below first quartile putouts, assists, errors, and double plays comparisons: Crawford +69.33 PO, +2.66 A, +0.44 E, +0 DP Gutierrez +60.13 PO, -0.85 A, -2.02 E, +0 DP Jones +63.32 PO, +9.11 A, +4.95 E, +6 DP Ichiro +49.02 PO, +0.90 A, +1.51 E, -0.18 DP Cruz +61.46 PO, -0.73 A, +3.50 E, +0.36 DP Here are their values for Rfield, DRS, and UZR: Crawford 8 Rfield, 8 DRS, 17.9 UZR Gutierrez 0 Rfield, -2 DRS, 5.9 UZR Jones -8 Rfield, -6 DRS, -3.8 UZR Ichiro -1 Rfield, -1 DRS, 14.1 UZR Crus 3 Rfield, 1 DRS, 10.1 UZR Not much agreement with Fielding Value here, it seems. Brett Gardner had the highest DRS in the AL and MLB at 33, and the highest UZR in the AL and MLB at 24.8. Fielding Value rates him at 13.13. The worst defensive outfielders in the AL were Carlos Quentin of the Chicago White Sox with a Fielding Value of -7.85, Grady Sizemore of the Cleveland Indians with a Fielding Value of -4.01, and Michael Brantley of the Cleveland Indians with a Fielding Value of -3.22. I'll note that Willie Bloomquist rated at -5.14 and played 72 games in the AL that season with the Royals, and 11 games in the NL with the Reds. There were a good number of inferior NL outfielders that weren't mentioned previously that fared worse than these worst AL outfielders. Here are our 3 worst AL outfielders Rfield, DRS, and UZR values: Quentin -24 Rfield, -23 DRS (worst in the AL), -25.2 UZR (worst in the AL) Sizemore -3 Rfield, -3 DRS, -1 UZR Brantley -15 Rfield, -13 DRS, -9 UZR Pitchers NL Pitcher Actual Winner: Bronson Arroyo, Cincinnati Reds NL Pitcher Player Value Winner: R.A. Dickey, New York Mets
Golly, I've done it again! Yet another Red stripped of a Gold Glove. Dickey led all pitchers in the NL and MLB with a Fielding Value of 10.89. Arroyo still fared pretty well with a Fielding Value of 5.83. If we wanted to reward the best defensive NL reliever, that would go to Evan Meek of the Pittsburgh Pirates with a Fielding Value of 7.89. Dickey was a 96% SP and 4% RP, while Arroyo was 100% a SP. Dickey was in the field for about 174 innings, and Arroyo was in the field for about 216 innings. Dickey had a Fielding Value Average of .1174 compared to a first quartile of .0499, while Arroyo's was .0773 vs .0503. Here are their fielding percentage, RFG, and RF9 first quartile comparisons: Dickey 1.000 vs .9384, 2.26 vs 1.01, 3.15 vs 1.53 Arroyo 1.000 vs .9388, 1.48 vs 1.05, 2.04 vs 1.54 Here are their putouts, assists, errors, and double plays above/below their first quartiles: Dickey +10.06 PO, +24.49 A, -0.73 E, +3.16 DP Arroyo +9.31 PO, +6.58 A, -0.93 E, +3.92 DP Pitcher's don't have UZR incorporated into their FanGraphs WAR, and their Baseball Reference Rfields are always set to 0. Both Dickey and Arroyo had DRS values of 8. Evan Meek had a DRS of 2. Jake Westbrook had a DRS of 12 and played 12 games with the Cardinals, but spent most of the season (21 games) with the Indians in the AL. Jon Garland of the San Diego Padres led the NL with a DRS of 9. Westbrook's Fielding Value while in the NL was 6.95, and Garland's was 8 (4th highest). The worst defensive pitcher in the NL was Travis Wood of the Cincinnati Reds with a Fielding Value of -3.35. He had a DRS of 1. The worst defensive reliever in the NL was Ryota Igarashi of the New York Mets with a Fielding Value of -1.4, who also had a DRS of 1. Tim Lincecum of the San Francisco Giants had the worst DRS in the NL at -6, and had a Fielding Value of -2.85 (3rd worst in NL). AL Pitcher Actual Winner: Mark Buehrle, Chicago White Sox AL Pitcher Player Value Winner: Fausto Carmona/Roberto Hernandez, Cleveland Indians
The Pitcher Formerly Known As Fausto Carmona, and since revealed to be named Roberto Hernandez, led the AL with a Fielding Value of 9.60. Buehrle fared pretty well too with a Fielding Value of 6.66 (thrice in one post, yeesh). Both these guys were 100% starters. They also both pitched about 210 innings. Hernandez had a Fielding Value Average of .0921, and Buehrle's was .0803. The first quartile for AL starters was .0434. The best defensive AL reliever was Jamey Wright of the Cleveland Indians and Seattle Mariners, who had a Fielding Value of 4.34. Here are the fielding percentage, RFG, and RF9 comparisons: Buehrle 1.0000 vs .9383, 1.52 vs 0.87, 2.14 vs 1.29 Hernandez .9680 vs .9383, 1.85 vs 0.87, 2.61 vs 1.29 Here are the putouts, assists, errors, and double plays above/below comparisons: Buehrle -4.38 PO, 29.02 A, -0.22 E, 2.99 DP Hernandez 13.62 PO, 22.02 A, 1.78 E, 4.99 DP Buehrle led the AL and MLB with a DRS of 12, tied with the aforementioned Jake Westbrook. Westbrook's Fielding Value while in the AL was only 2.26, however. Hernandez had a DRS of 2. Jamey Wright had a DRS of 0. The worst defensive pitcher in the AL was Colby Lewis of the Texas Rangers, with a Fielding Value of -4.47. He had a DRS of -5. Jeremy Bonderman of the Detroit Tigers had the worst DRS in the AL and MLB at -8, but his Fielding Value wasn't nearly as bad at -0.87. GOLD GLOVE SUMMARY Now that we've gone through each position and each league, here's a quick summary of the players that should have won the Gold Glove at each position, based on Fielding Value: AL C - Jose Molina, Blue Jays 1B - Michael Cuddyer, Twins 2B - Robinson Cano (actual winner), Yankees 3B - Jose Lopez, Mariners SS - Alexei Ramirez, White Sox OF - Franklin Gutierrez (actual winner), Mariners OF - Carl Crawford (actual winner), Rays OF - Adam Jones, Orioles P - Fausto Carmona/Roberto Hernandez, Indians NL C - Miguel Olivo, Rockies 1B - Albert Pujols (actual winner), Cardinals 2B - Clint Barmes, Rockies 3B - Placido Polanco, Phillies SS - Troy Tulowitzki (actual winner), Rockies OF - Jay Bruce, Reds OF - Angel Pagan, Mets OF - Andres Torres, Giants P - R.A. Dickey, Mets The AL got 3 of their 9 right, and the NL got 2 of their 9 right. The Mariners led the AL with 2 winners and the Rockies led the NL with 3 winners. PLATINUM GLOVES The Platinum Glove is supposed to be awarded to the best defensive player in each league. You can view past winners here. Only players that also won a Gold Glove are eligible, and the winner is determined via a fan vote. Since the award began in 2011, we don't have an actual player to compare to for the 2010 season. NL Player Value Winner: Albert Pujols, St. Louis Cardinals, First Base AL Player Value Winner: Alexei Ramirez, Chicago White Sox, Shortstop As previously mentioned, Pujols led all positions in the MLB with a Fielding Value of 39.50. Alexei Ramirez led all positions in the AL with a Fielding Value of 30.13. Michael Bourn had the highest DRS in the NL among all positions at 28 and the highest UZR in the NL among all positions at 19.8, and as previously mentioned had a Fielding Value of 10.89. Brett Gardner had the highest DRS in the AL among all positions at 25 and the highest UZR in the AL among all positions at 25.8, and as previously mentioned had a Fielding Value of 13.13. I find my metric to be more positionally diverse, as a first baseman and a shortstop won. The advanced metrics seem to be more biased (at least on the sample size of the 2010 season), with the top 2 players both being outfielders. FIELDING VALUE BY POSITION Maybe you've seen the results and think that the metric is flawed since Albert Pujols rated the highest. Surely a first baseman can't be the best defender in the MLB! Well, think again. As explained at the beginning, it's how you compare to everyone else at your position that makes you valuable. To be valuable is to be uniquely good, not good in comparisons that don't matter. If a player has grown up playing baseball and has been groomed into being a shortstop it does not matter AT ALL if he is a better defender than his team's first baseman. It does not matter AT ALL that shortstop is generally a more difficult position to defend. All that matters is that the player is a shortstop and that therefore there are expectations of his defensive ability. There is a pool of available MLB shortstops across the league, and all we care about is how our shortstop is doing compared to everyone else. If I have the worst defensive shortstop in the league and he can't make up for it with his bat, he's got to go. If I have the best defensive first baseman in the league and he can adequately hit, I'll keep him around. The shortstop to first base comparison is of no consequence to my decision; if I swapped the players, my first baseman would probably be the greatest hitting shortstop the world has known and the worst defensive shortstop in history, while my shortstop would be a very poor hitting first baseman and likely not a great defensive one either given the uniqueness of the position. I hope I got my point across and I really can't emphasize this enough; relative to position is all that matters. Let's check out some boxplots of Fielding Value, by position:  If anything, center fielders and shortstops have more spread and thus more potential to set themselves apart. But for the most part, players at each position have a similar opportunity to be among the best defenders or among the worst defenders at their position. Let's view some summary statistics of Fielding Value, by position:  Note that these values are among all players, not just starters. Guys that don't play much or that are truly about first quartile quality are going to be closer to 0. Guys that play often and are among the bottom 25% are going to have larger negative values. Guys that play often and are not among the bottom 25% are likely to have positive values. So there isn't a universal bad/decent/good scale that we can use for Fielding Value, but players with Fielding Values less than their position's FirstQuart value above are poor defenders, players with Fielding Values around their position's Median value above are average/typical defenders, and players with Fielding Values greater than their position's ThirdQuart value above are good defenders. If your Fielding Value is close to your position's Max value above, you're in elite, Gold Glove territory. If your Fielding Value is close to your position's Min value above... hopefully you can hit or are considering a position or career change. FIELDING VALUE BY TEAM How did Fielding Value do in explaining which teams were the best defensively in 2010? Let's take a look at boxplots of Fielding Value by team:  Looks like the Tiger were pretty good at fielding, despite having no Gold Glove winners. The Mariners look pretty good, as do the Reds, the Orioles, and the Twins. Some teams have a few outstanding players but maybe not as good as medians, while other teams have higher medians but no superstars. Let's take a look at the summary statistics of Fielding Value by team in 2010: 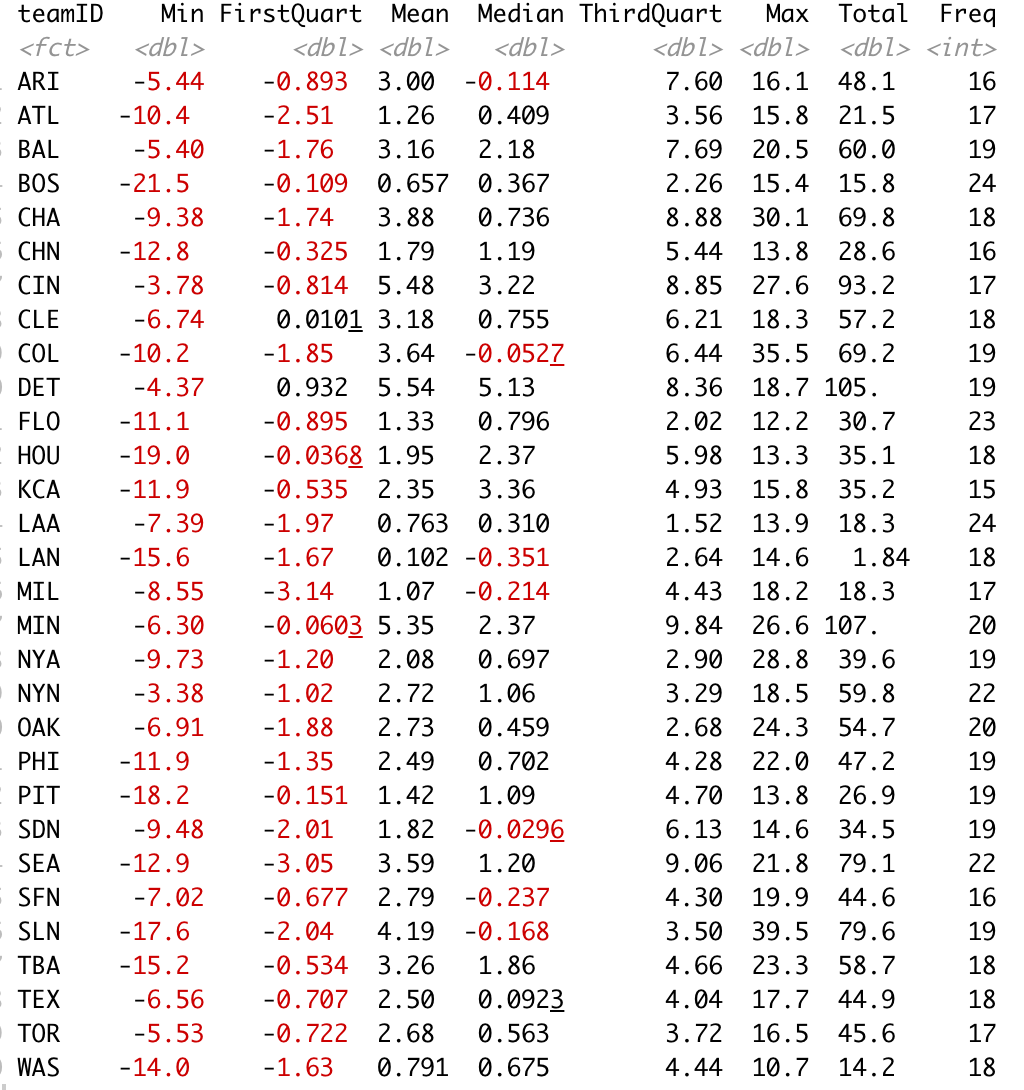 A lot to take in, but we get some useful pieces of info, and some not. The Reds have a high average and total, and were good in 2010, going 91-71 and winning their division. The Twins have a high average and total, and were also good in 2010, going 94-68 and winning their division. But the Tigers have a high average and total and finished .500 and 3rd in their division. The Rangers and Giants don't look too impressive, but they both went to the World Series. The Nationals and Pirates have low totals and both finished last in their divisions. The Mariners have a low average and finished last in their division. So we can make some conclusions, but nothing too definitive. Of course, fielding is only one piece of the equation. Maybe once we add in batting, pitching, and baserunning, we'll get a clearer picture. I'll also note that the totals above are only for players that played their entire seasons with 1 team. Guys that switched teams got thrown out. Here's a plot of runs allowed by team in 2010:  Of course, some of runs allowed are due to pitching, not fielding, but we get a little context here as well. Reds had a high total Fielding Value and are on the lower end of runs allowed. Pirates had a low total Fielding Value and are on the higher end of runs allowed. But Braves and Padres had low total Fielding Values and also low runs allowed, meaning they likely had stellar pitching.
Thank you for reading and I hope you've found this first application of Fielding Value interesting. I plan to do a similar thing (but in much less detail) for the other years. First, however, I will continue the application of Player Value on the 2010 season. Next up will be using Batting Value to determine the 2010 Silver Sluggers, and then I'll use Total Player Value to determine our MVPs, RoYs, and 1st team/2nd team honors, as well as Pitching Value to determine our Cy Youngs and Relievers of the Year. As always, let me know your thoughts in the comments below. Now I normally like to share my Excel files and R code, but if I did that then you'd get a sneak peak into our leaders in other areas. For now you'll have to wait, but I'll share everything once I've completed the run through of the 2010 season. Statting Lineup Newsletter Signup Form: If you'd like to receive email updates for each new post that I make, sign up for the Statting Lineup newsletter using the link below: https://weebly.us18.list-manage.com/subscribe?u=ab653f474b2ced9091eb248b1&id=3a60f3b85f
0 Comments
Leave a Reply. |
Statting Lineup Newsletter Signup Form:
|