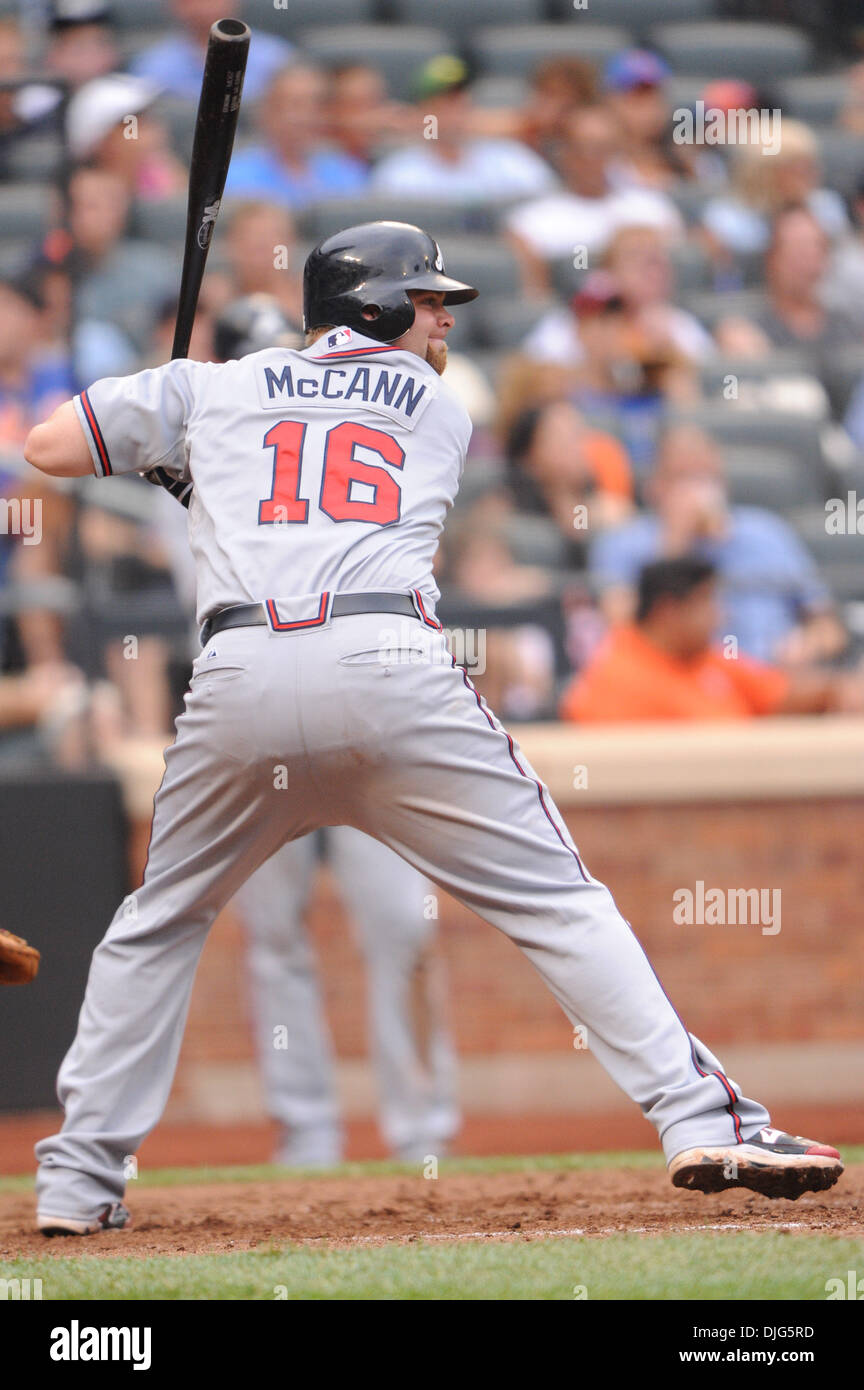
An Application of My New Player Value Metric on the 2010 Season: Batting Value and Silver Sluggers9/18/2022 In my last post, I used the Fielding Value portion of my new Player Value metric to determine which players should have won a Gold Glove in 2010, as well as which two players were deserving of the Platinum Glove, had the award existed then. You can read about my Player Value metric here and an important addendum to the metric here. As a quick summary of the metric, each player gets credited and docked for the run-value of each event they achieve, from hitting a home run to striking out. These values are applied on a 'per opportunity' basis, such as per plate appearance or per inning. These are then compared to a player's positional first quartile value. If you hit fewer HR per PA than your position's first quartile, that means you are in the bottom 25% of home run hitters at your position, for example. We multiply the differences by a player's total # of opportunities to credit players that are able to stay healthy and play more. In this post, I will use the Batting Value portion of my Player Value metric to determine which players should have won a Silver Slugger, as well as which two players should have won the Hank Aaron Award in each league. Then I'll look at how Batting Value varies by position to show that it is not biased towards or against any particular position. Any player that is an elite hitter at their position has the chance to add the same amount of value. This is because of the inherent offensive expectations of each position. I don't reward guys that play positions that are more prone to product offensively like first base, right field, or DH because it is expected that guys that play those positions are good at offense. Each additional event that a player makes is basically worth the same, regardless of your position. Here's a look at the offensive expectations (first quartile values) by position in 2010:  First basemen, third basemen, corner outfielders, and designated hitters clearly tend to do more offensively. To compare a player to a league-wide average or first quartile would obviously benefit him if he played one of these positions, and hurt him if he played a different position like shortstop. Because of this, we compare players to their positional first quartile, and we weight each player's first quartile values depending on their proportion of games played at each position. So a 100% second baseman gets different first quartile values than a 60% second baseman that also plays 40% of his games at first. Here's a quick reminder of the run value weights for the relevant offensive events: Single: .30 runs Double: .58 runs Triple: .91 runs Home Run: 1.29 runs Unintentional Walk: .22 runs Intentional Walk: .17 runs Hit By Pitch: .24 runs Sacrifice Bunt: -.22 runs Sacrifice Fly: -.10 runs Strikeout: -.34 runs Groundball Double Play: -.75 runs Other Out: -.33 runs Note that I don't claim ultimate precision for my run value weights, so these have been rounded to 2 decimal places from the values shown in the Player Value explanation posts. Also recall that stolen bases and caught stealings are placed into Baserunning Value, a separate portion of total Player Value. SILVER SLUGGERS View the 2010 NL Silver Slugger winners here. View the 2010 AL Silver Slugger winners here. Read about the award and how it is decided here. The idea of the award is for it to go to the best hitting player at each position in each league. However, they only look at batting average, home runs, RBI, and total bases when deciding which players are the "best hitters". It's been around since 1980 and is voted on by MLB managers and coaches. Catchers NL Catcher Actual Winner: Brian McCann, Atlanta Braves NL Catcher Player Value Winner: Geovany Soto, Chicago Cubs
A pretty close call here. Soto led MLB and the NL with a Batting Value of 20.35, while McCann finished 3rd in MLB and 2nd in the NL with a Batting Value of 17.34. Both players spent about 99% of their time at catcher, and about 1% as the DH. Soto had a Batting Value Average of -.0444, while McCann had a Batting Value Average of -.0662. I know the negative values for Batting Value Average is a little tricky to interpret, but it makes sense in the context of a game where being successful roughly only 1/3 of the time is considered doing a good job. A player with a positive Batting Value Average is truly defying the laws of baseball and contributing more as a batter than they are causing harm. For the most part, a player should just seek to have a less negative Batting Value Average, meaning contributing more relative to their peers. A player with a positive Batting Value Average has done alarmingly well. Here are their batting rate values compared to their first quartiles, in the order of batting average, on-base percentage, slugging percentage, OPS, and wOBA: Soto: .280 vs .248, .393 vs .309, .497 vs .344, .890 vs .671, .387 vs .300 McCann: .269 vs .249, .375 vs .309, .453 vs .345, .828 vs .672, .362 vs .300 So Soto generally had higher rate values than McCann, while also having lower first quartile values than McCann since he spent slightly more time at catcher than at DH. Not surprisingly, DH's generally are better hitters than catchers. Here are some of their traditional batting counting stats: Soto: 387 PA, 54 1B, 19 2B, 0 3B, 17 HR, 53 RBI, 58 uBB, 4 IBB, 0 HBP, 83 SO, 0 SH, 3 SF, 5 GIDP McCann: 566 PA, 83 1B, 25 2B, 0 3B, 21 HR, 77 RBI, 64 uBB, 10 IBB, 9 HBP, 98 SO, 0 SH, 4 SF, 12 GIDP McCann has more of most events types given his more plate appearances, but some things like doubles, homers, and unintentional walks are pretty close considering the nearly 200 additional plate appearances that McCann had. In considering how a first quartile catcher would have fared had they played as often, here is how above and below they were in the different offensive events: Soto: 1.77 less singles, 4.75 more doubles, .01 less triples, 12.09 more homers, 35.68 more unintentional walks, 42.31 more strikeouts, 2.69 more intentional walks, 1.93 less hit by pitches, 0 more sac bunts, .90 more sac flies, 2.78 less groundball double plays, and 21.46 less other outs McCann: 1.48 more singles, 4.14 more doubles, .01 less triples, 13.77 more homers, 31.27 more unintentional walks, 38.28 more strikeouts, 8.09 more intentional walks, 6.19 more hit by pitches, 0 more sac bunts, .93 more sac flies, .64 more groundball double plays, 1.81 more other outs Baseball Reference has Soto with an Rbat of 19 in 2010, and McCann with an Rbat of 18. FanGraphs has Soto at a wRAA of 20.5, the 2nd most in MLB and highest in the NL. They have McCann with a wRAA of 18.4, the 4th most in MLB and 2nd highest in the NL. My metric thus agrees with Rbat and wRAA that Soto was a better offensive player than McCann. The worst offensive catcher in the NL was Ivan Rodriguez of the Washington Nationals, with a Batting Value of -22.32. It was a tough penultimate season for the Hall of Famer, as Pudge's Rbat was -13 and his wRAA was -13.1, the 9th worst in MLB and 2nd worst in the NL. Koyie Hill of the Cubs had the worst wRAA in the NL at -14.8, and I had his Batting Value at -15.26. AL Catcher Actual Winner: Joe Mauer, Minnesota Twins AL Catcher Player Value Winner: Joe Mauer, Minnesota Twins  This award was handed out correctly, as Mauer led the AL and was 2nd in MLB among catchers with a Batting Value of 17.40. The next highest in the AL was Victor Martinez of the Boston Red Sox, who had a Batting Value of 11.34. Mauer spent about 83% of his time at catcher and the remaining 13% at DH, while Martinez played catcher 86% of the time, first base 11% of the time, and DH 3% of the time. Mauer had a Batting Value Average of -.0622 compared to a first quartile of -.1169, while Martinez had a Batting Value Average of -.0726 vs a first quartile of 0.1206. Here are how Mauer and Martinez compared against their first quartiles in terms of AVG, OBP, SLG, OPS, and wOBA: Mauer: .327 vs .252, .402 vs .317, .469 vs .359, .871 vs .695, .377 vs .309 Martinez: .302 vs .248, .400 vs .309, .447 vs .343, .847 vs .670, .368 vs .299 Here are how Mauer and Martinez compare in terms of some traditional counting batting stats: Mauer: 584 PA,114 1B, 43 2B, 1 3B, 9 HR, 75 RBI, 51 uBB, 14 IBB, 3 HBP, 0 SH, 6 SF, 53 SO, 19 GIDP Martinez: 538 PA, 96 1B, 32 2B, 1 3B, 20 HR, 79 RBI, 35 uBB, 5 IBB, 0 HBP, 0 SH, 5 SF, 52 SO, 17 GIDP Here are how Mauer and Martinez compare relative to their first quartiles overall: Mauer: +31.59 1B, +20.75 2B, +.85 3B, -.11 HR, +14.37 uBB, -15.21 SO, +11.89 IBB, +.25 HBP, +0 SH, +2.79 SF, +7.83 GIDP, +27.28 other Outs Martinez: +19.53 1B, +11.93 2B, +.97 3B, +11.98 HR, +1.78 uBB, -8.38 SO, +2.98 IBB, -2.57 HBP, +0 SH, +2.06 SF, +6.52 GIDP, +47.95 other Outs Mauer's Rbat was 26, while Martinez's Rbat was 15. Mauer had a wRAA of 26.1, the highest in MLB and the AL. Martinez had a wRAA of 18.6, the 3rd most in MLB and 2nd most in the AL. The worst offensive catcher in the AL was Jason Kendall of the Kansas City Royals, with a Batting Value of -18.59. It was a tough final season for Kendall, who had an Rbat of -19 and a wRAA of -16, the 3rd worst in MLB and the AL. Jeff Mathis of the Angels had the worst wRAA at -17.7, and I had his Batting Value at -17.32 for the 4th worst in MLB and 3rd worst in the AL. First Basemen NL First Base Actual Winner: Albert Pujols, St. Louis Cardinals NL First Base Player Value Winner: Joey Votto, Cincinnati Reds
Votto led MLB and the NL with a Batting Value of 41.30. Across all positions, Votto had the 2nd largest Batting Value in MLB and the largest in the NL. Pujols had a Batting Value of 36.42, good for 3rd in MLB and 2nd in the NL at first base. Both players were 100% first basemen, and the position's first quartile Batting Value Average was -.0906. Votto had a Batting Value Average of -.0092, and Pujols had a Batting Value Average of -.0209. Here are their AVG, OBP, SLG, OPS, and wOBA first quartile comparisons: Votto: .324 vs .250, .424 vs .332, .600 vs .406, 1.024 vs .749, .438 vs .332 Pujols: .312 vs .250, .414 vs .332, .596 vs .406, 1.011 vs .749, .419 vs .332 Here are their traditional counting batting stats: Votto: 648 PA, 102 1B, 36 2B, 2 3B, 37 HR, 113 RBI, 83 uBB, 8 IBB, 7 HBP, 0 SH, 3 SF, 125 SO, 11 GIDP Pujols: 700 PA, 101 1B, 39 2B, 1 3B, 42 HR, 118 RBI, 65 uBB, 38 IBB, 4 HBP, 0 SH, 6 SF, 76 SO, 23 GIDP Here are their comparisons relative to their firrst quartiles: Votto: +17.84 1B, +10.42 2B, +2 3B, +18.07 HR, +25.67 uBB, +24.7 SO, +3.73 IBB, +4.76 HBP, +0 SH, -.73 SF, +.78 GIDP, -18.97 other Outs Pujols: +10.08 1B, +11.36 2B, +1 3B, +21.55 HR, +3.07 uBB, -32.35 SO, +33.38 IBB, +1.58 HBP, +0 SH, +1.97 SF, +11.96 GIDP, +31.73 other Outs Votto had an Rbat of 56, and Pujols had an Rbat of 54. Votto had a wRAA of 60.6, the most in MLB and in the NL. Pujols had a wRAA of 54.6, the 3rd most in MLB and 2nd most in the NL. The worst offensive first baseman in the NL was Garrett Jones of the Pittsburgh Pirates, with a Batting Value of -23.15. He had an Rbat of -4 and a wRAA of -3.1. The lowest wRAA in the NL was Jeff Clement of the Pirates at -8, who I had at a Batting Value of -10.45. AL First Base Actual Winner: Miguel Cabrera, Detroit Tigers AL First Base Player Value Winner: Miguel Cabrera, Detroit Tigers  Another Silver Slugger awarded correctly, as Miggy led the AL and finished 2nd in MLB with a Batting Value of 40.38. This was good for 3rd most in MLB and 2nd most in the AL across all positions. His closest competitor at first base was Paul Konerko of the Chicago White Sox, who had a Batting Value of 31.04. Cabrera had a 99%/1% split between time at first base and DH, while Konerko had an about 85%/15% split. Cabrera had a Batting Value Average of -.0105 compared to a first quartile of -.0904, while Konerko had a Batting Value Average of -.0226 vs a first quartile of -.0877. Here are their AVG, OBP, SLG, OPS, and wOBA first quartile comparisons: Cabrera: .328 vs .250, .420 vs .332, .622 vs .406, 1.042 vs .749, .431 vs .332 Konerko: .312 vs .253, .393 vs .336, .584 vs .411, .977 vs .760, .417 vs .336 Here are their traditional counting batting stats: Cabrera: 648 PA, 96 1B, 45 2B, 1 3B, 38 HR, 126 RBI, 57 uBB, 32 IBB, 3 HBP, 0 SH, 8 SF, 95 SO, 17 GIDP Konerko: 631 PA, 101 1B, 30 2B, 1 3B, 39 HR, 111 RBI, 65 uBB, 7 IBB, 5 HBP, 0 SH, 6 SF, 110 SO, 9 GIDP Here are their comparisons relative to their first quartiles: Cabrera: +11.87 1B, +19.37 2B, +.99 3B, +19.06 HR, -.33 uBB, -5.49 SO, +27.74 IBB, +.76 HBP, +0 SH, +4.27 SF, +6.79 GIDP, +3.25 other Out Konerko: +19.46 1B, +4.57 2B, +.85 3B, +20.43 HR, +9.15 uBB, +10.16 SO, +3 IBB, +2.84 HBP, +0 SH, +2.36 SF, -.79 GIDP, +14.19 other Out Cabrera had an Rbat of 55, and Konerko had an Rbat of 48. Cabrera had a wRAA of 57.1, the 2nd most in MLB and most in the AL. Konerko had a wRAA of 4784, the 4th most in MLB and 2nd most in the AL. The worst offensive first baseman in the AL was Casey Kotchman of the Seattle Mariners with a Batting Value of -30.82. Kotchman also had the worst wRAA in MLB and the AL at -18.5. He had the 3rd worst Batting Value in MLB across all positions. Second Basemen NL Second Base Actual Winner: Dan Uggla, Florida Marlins NL Second Base Player Value Winner: Dan Uggla, Florida Marlins  This one was also rewarded correctly, as Uggla led the NL and was 2nd in MLB with a Batting Value of 33.34. Rickie Weeks of the Milwaukee Brewers was the next closest, finishing 3rd in MLB and 2nd in the NL with a Batting Value of 30.16. Uggla was 100% a second baseman, while Weeks spent 99% of his time at second and was a DH 1% of the time. Uggla had a Batting Value Average of -.0516 vs a first quartile of -.1112, while Weeks had a Batting Value Average of -.0609 vs a first quartile of -.1109. Here are their AVG, OBP, SLG, OPS, and wOBA first quartile comparisons: Uggla: .287 vs .267, .369 vs .329, .508 vs .374, .877 vs .699, .382 vs .311 Weeks: .269 vs .267, .366 vs .329, .464 vs .375, .830 vs .699, .368 vs .311 Here are their traditional counting batting stats: Uggla: 674 PA, 105 1B, 31 2B, 0 3B, 33 HR, 105 RBI, 76 uBB, 2 IBB, 2 HBP, 0 SH, 5 SF, 149 SO, 9 GIDP Weeks: 754 PA, 110 1B, 32 2B, 4 3B, 29 HR, 83 RBI, 76 uBB, 0 IBB, 25 HBP, 0 SH, 2 SF, 184 SO, 5 GIDP Here are their comparisons relative to their first quartiles: Uggla: +.6 1B, +4.06 2B, -1.31 3B, +26.1 HR, +32.25 uBB, +71.98 SO, +1.75 IBB, -2.21 HBP, -1.51 SH, +2.04 SF, +.06 GIDP, -48.03 other Outs Weeks: -6.66 1B, +1.84 2B, +2.54 3B, +21.19 HR, +26.94 uBB, +97.53 SO, -.3 IBB, +20.3 HBP, -1.68 SH, -1.32 SF, -5.01 GIDP, -59.41 other Outs Uggla had an Rbat of 27, while Weeks had an Rbat of 22. Uggla had a wRAA of 32.7, the 2nd most in MLB and most in the NL. Weeks had a wRAA of 28.1, the 4th most in MLB and 3rd most in the NL. In between them was Kelly Johnson of the Dbacks with a wRAA of 30.8, who I had with a Batting Value of 28.34 (4th most in MLB, 3rd most in the NL). The worst offensive second baseman in the NL was Ryan Theriot of the Chicago Cubs and the Los Angeles Dodgers, with a Batting Value of -18.04. He played 96 games with the Cubs and 54 with the Dodgers. He had an Rbat of -11 and a wRAA of -17.7, the 2nd most in MLB and most in the NL. AL Second Base Actual Winner: Robinson Cano, New York Yankees AL Second Base Player Value Winner: Robinson Cano, New York Yankees  This one was right on the money, as Cano led all of MLB and the AL with a Batting Value of 35.99. His closest competitor was Dustin Pedroia of the Boston Red Sox, with a Batting Value of 14.53. Cano was about a 99% second baseman and 1% DH, while Pedroia was 100% a second baseman. Cano had a Batting Value Average of -.0489 vs a first quartile of -.1107, and Pedroia had a Batting Value Average of -.0597 vs a first quartile of -.1112. Here are their AVG, OBP, SLG, OPS, and wOBA first quartile comparisons: Cano: .319 vs .267, .381 vs .329, .534 vs .375, .914 vs .700, .391 vs .311 Pedroia: .288 vs .267, .367 vs .329, .493 vs .374, .860 vs .699, .373 vs .311 Here are their traditional counting batting stats: Cano: 696 PA, 127 1B, 41 2B, 3 3B, 29 HR, 109 RBI, 43 uBB, 14 IBB, 8 HBP, 0 SH, 5 SF, 77 SO, 19 GIDP Pedroia: 351 PA, 50 1B, 24 2B, 1 3B, 12 HR, 41 RBI, 36 uBB, 1 IBB, 3 HBP, 2 SH, 4 SF, 83 SO, 4 GIDP Here are their comparisons relative to their first quartiles: Cano: +19.45 1B, +13.14 2B, +1.65 3B, +21.7 HR, -2.39 uBB, -3.08 SO, +13.71 IBB, +3.67 HBP, -1.54 SH, +1.93 SF, +9.76 GIDP, +10.68 other Outs Pedroia: -4.37 1B, +9.97 2B, +.32 3B, +8.41 HR, +13.22, -2.11 SO, +.87 IBB, +1.81 HBP, +1.21 SH, +4.46 SF, +2.34 GIDP, +8.55 other Outs Cano had an Rbat of 33, while Pedroia had an Rbat of 10. Cano had a wRAA of 39, the most in MLB and in the AL. Pedroia had a wRAA of 14.7, the 2nd most in the AL. The worst offensive second baseman in the AL was Luis Valbuena of the Cleveland Indians, with a Batting Value of -17.9. He had an Rbat of -18 and a wRAA of -18.7, the worst in MLB and in the AL. Third Basemen NL Third Base Actual Winner: Ryan Zimmerman, Washington Nationals NL Third Base Player Value Winner: Ryan Zimmerman, Washington Nationals  This one was also awarded correctly, as Zimmerman led MLB and the NL with a Batting Value of 22.07. The next most in the NL was David Wright of the New York Mets, who had a Batting Value of 17.23. Both guys were about 99% third basemen and 1% DHs. Zimmerman had a Batting Value Average of -.0505 vs a first quartile of -.1068, while Wright had a Batting Value Average of -.0614 vs a first quartile of -.1069. Here are their AVG, OBP, SLG, OPS, and wOBA first quartile comparisons: Zimmerman: .307 vs .247, .388 vs .320, .510 vs .397, .899 vs .721, .390 vs .316 Wright: .283 vs .247, .354 vs .320, .503 vs .397, .856 vs .721, .366 vs .316 Here are their traditional counting batting stats: Zimmerman: 603 PA, 104 1B, 32 2B, 0 3B, 25 HR, 85 RBI, 63 uBB, 6 IBB, 4 HBP, 0 SH, 5 SF, 98 SO, 16 GIDP Wright: 670 PA, 98 1B, 36 2B, 3 3B, 29 HR, 103 RBI, 60 uBB, 9 IBB, 2 HBP, 0 SH, 12 SF, 161 SO, 12 GIDP Here are their comparisons relative to their first quartiles: Zimmerman: +19.78 1B, +5.52 2B, -1.09 3B, +12.14 HR, +30.99 uBB, +20.11 SO, +4.41 IBB, +2.49 HBP, +0 SH, +0 SF, +4.02 GIDP, +.15 other Outs Wright: +4.42 1B, +6.58 2B, +1.79 3B, +14.71 HR, +24.45 uBB, +74.49 SO, +7.23 IBB, +.33 HBP, +0 SH, +6.44 SF, -1.31 GIDP, -29.64 other Outs Zimmerman had an Rbat of 31, and Wright had an Rbat of 22. Zimmerman had a wRAA of 33.1, the 2nd most in MLB and most in the NL. Wright had a wRAA of 24.1, good for 4th most in MLB and 2nd most in the NL. The worse offensive third baseman in the NL was Pedro Feliz of the Houston Astros and St. Louis Cardinals, with a Batting Value of -36.14. In his final season, Feliz played 97 games with the Astros and 40 games with the Cardinals. He had an Rbat of -10 and a wRAA of -29.5, the worst in MLB and in the NL. His Batting Value was the 2nd worst in MLB across all positions. AL Third Base Actual Winner: Adrian Beltre, Boston Red Sox AL Third Base Player Value Winner: Adrian Beltre, Boston Red Sox  And yet another award given out correctly! Silver Sluggers are turning out pretty well. Beltre came 2nd in MLB and led the AL with a Batting Value of 20.78. Finishing just behind him was Evan Longoria of the Tampa Bay Rays with a Batting Value of 20.35. Both players were 100% third basemen, where the positional first quartile Batting Value Average was -.1071. Beltre had a Batting Value Average of -.0549 and Longoria had a Batting Value Average of -.0565. Here are their AVG, OBP, SLG, OPS, and wOBA first quartile comparisons: Beltre: .321 vs .247, .365 vs .320, .553 vs .396, .919 vs .720, .391 vs .316 Longoria: .294 vs .247, .372 vs .320, .507 vs .396, .879 vs .720, .375 vs .316 Here are their traditional counting batting stats: Beltre: 641 PA, 110 1B, 49 2B, 2 3B, 28 HR, 102 RBI, 30 uBB, 10 IBB, 5 HBP, 0 SH, 7 SF, 82 SO, 25 GIDP Longoria: 661 PA, 96 1B, 46 2B, 5 3B, 22 HR, 104 RBI, 60 uBB, 12 IBB, 5 HBP, 0 SH, 10 SF, 124 SO, 15 GIDP Here are their comparisons relative to their first quartiles: Beltre: +20.41 1B, +20.85 2B, +.84 3B, +14.37 HR, -3.86 uBB, -.57 SO, +8.32 IBB, +3.4 HBP, +0 SH, +1.67 SF, +12.24 GIDP, +27.17 other Outs Longoria: +3.61 1B, +16.98 2B, +3.81 3B, +7.95 HR, +25.08 uBB, +38.85 SO, +10.27 IBB, +3.35 HBP, +0 SH, +4.5 SF, +1.84 GIDP, -8.12 other Outs Beltre had an Rbat of 29, and Longoria had an Rbat of 30. Beltre had a wRAA of 35.8, the most in MLB and in the AL. Longoria had a wRAA of 28.8, the 3rd most in MLB and 2nd most in the AL. The worst offensive third baseman in the AL was Jose Lopez of Seattle Mariners, with a Batting Value of -38.26. In fact, Lopez had the worst Batting Value in MLB across all positions. You may recall from my last post that Lopez had the highest Fielding Value among AL third basemen, but his terrible batting was more than enough to make him a poor third baseman overall. Lopez had an Rbat of -22, and a wRAA of -25.6, the 3rd worst in MLB and 2nd worst in the AL. Brandon Wood of the Angels had the worst wRAA in the AL at -28.7, and I had his Batting Value at -28.37 for 3rd worst in MLB and 2nd worst in the AL. Shortstops NL Shortstop Actual Winner: Troy Tulowitzki, Colorado Rockies NL Shortstop Player Value Winner: Troy Tulowitzki, Colorado Rockies  This Silver Slugger was also given out correctly, as Tulo led MLB and the NL with a Batting Value of 39.75. Hanley Ramirez of the Florida Marlins finished 2nd in MLB and the NL with a Batting Value of 32.78. Both players were 100% shortstops, where the first quartile Batting Value Average was -.1261. Tulowtizki had a Batting Value Average of -.0405 and Ramirez had a Batting Value Average of -.0627. Here are their AVG, OBP, SLG, OPS, and wOBA first quartile comparisons: Tulowitzki: .315 vs .250, .381 vs .294, .568 vs .326, .949 vs .652, .406 vs .294 Ramirez: .300 vs .250, .378 vs .294, .475 vs .326, .853 vs .652, .369 vs .294 Here are their traditional counting batting stats: Tulowitzki: 529 PA, 86 1B, 32 2B, 3 3B, 27 HR, 95 RBI, 44 uBB, 4 IBB, 5 HBP, 1 SH, 5 SF, 78 SO, 17 GIDP Ramirez: 619 PA, 112 1B, 28 2B, 2 3B, 21 HR, 76 RBI, 52 uBB, 12 IBB, 7 HBP, 0 SH, 5 SF, 93 SO, 14 GIDP Here are their comparisons relative to their first quartiles: Tulowitzki: +.37 1B, +13.25 2B, +1.37 3B, +23.27 HR, +20.48 uBB, +14.62 SO, +3.14 IBB, +2.84 HBP, -1.48 SH, +2.86 SF, +10.49 GIDP, -23.57 other Outs Ramirez: +11.8 1B, +6.06 2B, +.1 3B, +16.63 HR, +24.47 uBB, +18.84 SO, +10.99 IBB, +4.47 HBP, -2.9 SH, +2.5 SF, +6.39 GIDP, -20.2 other Outs Tulowitzki had an Rbat of 24, and Hanley Ramirez had an Rbat of 20. Tulo had a wRAA of 36.1, the most in MLB and in the NL. Ramirez had a wRAA of 23.9, the 2nd most in MLB and in the NL. The worst offensive shortstop in the NL was Brendan Ryan of the St. Louis Cardinals, with a Batting Value of -15.71. Like Jose Lopez, Ryan was also an elite defender and terrible hitter, but fortunately unlike Lopez, Ryan's fielding at least outweighs his batting. Ryan had an Rbat of -26 and a wRAA of -25.6, the 3rd worst in MLB and worst in the NL. AL Shortstop Actual Winner: Alexei Ramirez, Chicago White Sox AL Shortstop Player Value Winner: Alexei Ramirez, Chicago White Sox  This makes for 7 awards in a row handed out correctly! Alexei Ramirez led the AL with a Batting Value of 8.87, but finished 6th in MLB overall. Among the other NL shortstops that were superior batters are Stephen Drew of the Dbacks, Rafael Furcal of the Dodgers, and Jose Reyes of the Mets. The next highest in the AL was technically Alex Gonzalez, but he had a near 50/50 split between the Blue Jays and the Braves in 2010. The next highest solely AL player was Marco Scutaro of the Boston Red Sox, with a Batting Value of 6.84. If you'll recall from my last post, interestingly enough Ramirez was also the best fielding shortstop in the AL, while Scutaro was the worst. Ramirez was 100% a shortstop, while Scutaro was 89% a shortstop and 11% a second baseman. Ramirez had a Batting Value Average of -.1015 vs a first quartile of -.1261, and Scutaro had a Batting Value Average of -.1042 vs a first quartile of -.1245. Here are their AVG, OBP, SLG, OPS, and wOBA first quartile comparisons: Ramirez: .282 vs .250, .313 vs .294, .431 vs .326, .744 vs .652, .324 vs .294 Scutaro: .275 vs .252, .333 vs .298, .388 vs .331, .721 vs .657, .321 vs .296 Here are their traditional counting batting stats: Ramirez: 626 PA, 116 1B, 29 2B, 2 3B, 18 HR, 70 RBI, 25 uBB, 2 IBB, 2 HBP, 7 SH, 5 SF, 82 SO, 12 GIDP Scutaro: 695 PA, 125 1B, 38 2B, 0 3B, 11 HR, 56 RBI, 52 uBB, 1 IBB, 3 HBP, 4 SH, 3 SF, 71 SO, 14 GIDP Here are their comparisons relative to their first quartiles: Ramirez: +14.67 1B, +6.82 2B, +.07 3B, +13.58 HR, -2.84 uBB, +7 SO, +.98 IBB, -.56 HBP, +4.07 SH, +2.47 SF, +4.3 GIDP, +29.48 other Outs Scutaro: +13.02 1B, +13.03 2B, -2.05 3B, +5.86 HR, +19.56 uBB, -11.85 SO, -.04 IBB, +0 HBP, +.93 SH, +.17 SF, +4.38 GIDP, +45.83 other Outs Ramirez had an Rbat of 0 and Scutaro had an Rbat of -5. Ramirez had a wRAA of 1.7, which is highest in the AL among mainly shortstops but just 10th most in MLB. Jed Lowrie of the A's comes out higher at 11.8, but he didn't spend at least 50% of his time at any one position so I have him down as a utility guy. Scutaro had a wRAA of 0.1. The worst offensive shortstop in the AL was Cesar Izturis of the Baltimore Orioles, with a Batting Value of -22.86. He had an Rbat of -30 and a wRAA of -29.7, the worst in MLB and in the AL. Outfielders NL Outfield Actual Winner #1: Carlos Gonzalez, Colorado Rockies NL Outfield Actual Winner #2: Matt Holliday, St. Louis Cardinals NL Outfield Actual Winner #3: Ryan Braun, Milwaukee Brewers NL Outfield Player Value Winner #1: Carlos Gonzalez, Colorado Rockies NL Outfield Player Value Winner #2: Matt Holliday, St. Louis Cardinals (Best LF) NL Outfield Player Value Winner #3: Colby Rasmus, St. Louis Cardinals (Best CF) NL Rightfield Player Value Winner: Jayson Werth, Philadelphia Phillies
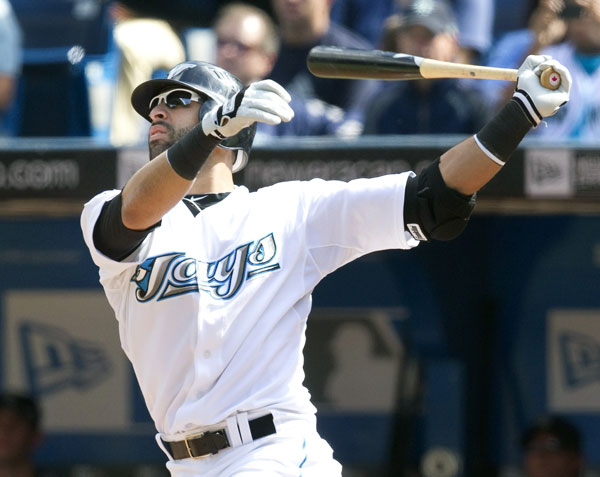
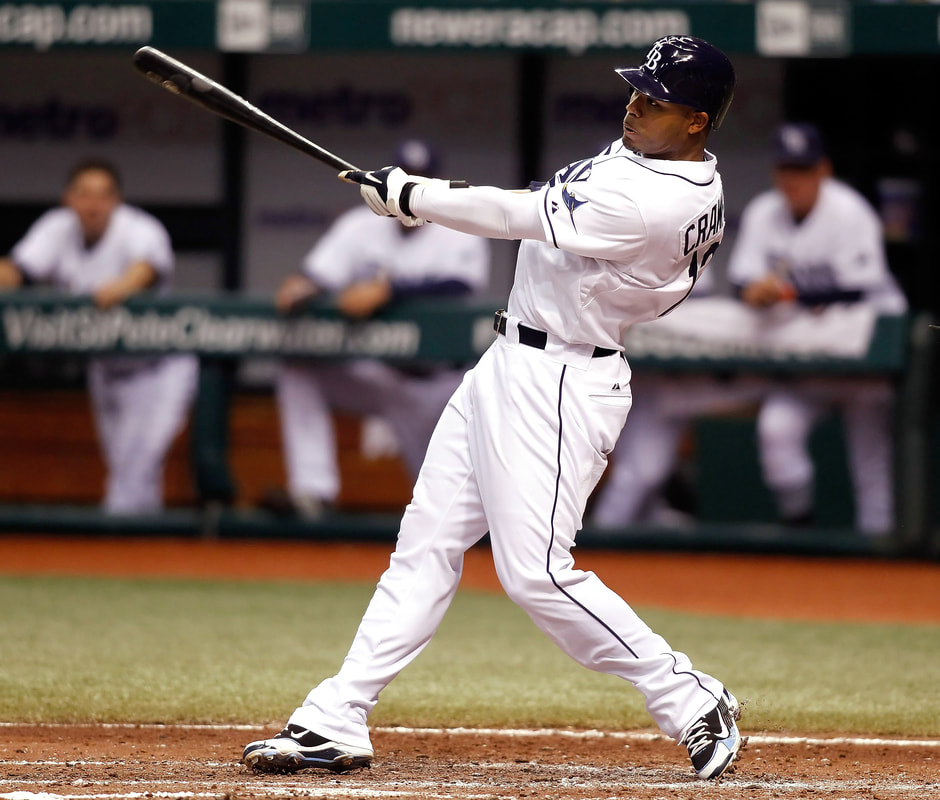
Got 2 out of the 3 outfield Silver Sluggers correct. Cargo led the NL and finished 3rd in MLB among outfielders with a Batting Value of 40.02. Cardinals teammates Holliday and Rasmus finished 2nd and 3rd in the NL and 4th and 5th in MLB with Batting Values of 33.73 and 24.74, respectively. Braun had a Batting Value of 20.47, which was 4th in MLB and 2nd in the NL among left fielders. Werth had a Batting Value of 22.2, the 2nd most in MLB and most in the NL among right fielders. Here are their AVG, OBP, SLG, OPS, wOBA, and Batting Value Average first quartile comparisons: Gonzalez: .336 vs .257, .376 vs .329, .598 vs .390, .974 vs .726, .413 vs .323, -.0281 vs -.1016 Holliday: .312 vs .262, .390 vs .332, .532 vs .386, .922 vs .730, .397 vs .324, -.0423 vs -.0996 Rasmus: .276 vs .249, .361 vs .319, .498 vs .364, .859 vs .680, .369 vs .307, -.0577 vs -.1149 Braun: .304 vs .262, .365 vs .332, .501 vs .386, .866 vs .730, .378 vs .324, -.0624 vs -.0996 Werth: .296 vs .259, .388 vs .338, .532 vs .427, .921 vs .775, .396 vs .339, -.0402 vs -.0888 Here are their traditional counting batting stats: Gonzalez: 636 PA, 120 1B, 34 2B, 9 3B, 34 HR, 117 RBI, 32 uBB, 8 IBB, 2 HBP, 0 SH, 7 SF, 135 SO, 9 GIDP Holliday: 675 PA, 112 1B, 45 2B, 1 3B, 28 HR, 103 RBI, 59 uBB, 10 IBB, 8 HBP, 0 SH, 2 SF, 93 SO, 13 GIDP Rasmus: 534 PA, 74 1B, 28 2B, 3 3B, 23 HR, 66 RBI, 54 uBB, 9 IBB, 1 HBP, 2 SH, 4 SF, 148 SO, 5 GIDP Braun: 684 PA, 117 1B, 45 2B, 1 3B, 25 HR, 103 RBI, 55 uBB, 1 IBB, 6 HBP, 0 SH, 3 SF, 105 SO, 17 GIDP Werth: 652 PA, 89 1B, 46 2B, 2 3B, 27 HR, 85 RBI, 76 uBB, 6 IBB, 7 HBP, 0 SH, 9 SF, 147 SO, 11 GIDP Here are their comparisons relative to their first quartiles: Gonzalez: +30.79 1B, +8.67 2B, +6.48 3B, +24.07 HR, -9.63 uBB, +41.77 SO, +6.73 IBB, -.41 HBP, -.35 SH, +4.63 SF, +1.49 GIDP, -16.92 other Outs Holliday: +14.16 1B, +16.59 2B, -.78 3B, +19.07 HR, +15.71 uBB, -.46 SO, +8.92 IBB, +4.91 HBP, +0 SH, -.94 SF, +5.81 GIDP, +18.4 other Outs Rasmus: +1.3 1B, +10.01 2B, +.02 3B, +18.19 HR, +19.88 uBB, +69.12 SO, +8.14 IBB, -1.02 HBP, +1.2 SH, +2.41 SF, +.04 GIDP, -41.16 other Outs Braun: +17.86 1B, +16.21 2B, -.81 3B, +15.95 HR, +11.13 uBB, +10.29 SO, -.09 IBB, +2.87 HBP, +0 SH, +.02 SF, +9.71 GIDP, +19.6 other Outs Werth: -1.18 1B, +17.48 2B, -.55 3B, +9.67 HR, +30.7 uBB, +44.6 SO, +4.04 IBB, +5.24 HBP, -.13 SH, +6.55 SF, +.4 GIDP, -23.72 other Outs Gonzalez had an Rbat of 36 and a wRAA of 46.8, the 3rd most in MLB and most in the NL among outfielders. Holliday had an Rbat of 39 and a wRAA of 41.2, the 4th most in MLB and 2nd most in the NL. Rasmus had an Rbat of 20 and a wRAA of 20.4. Braun had an Rbat of 30 and a wRAA of 31.3, the 4th most in the NL. Werth had an Rbat of 34 and a wRAA of 39, the 3rd most in the NL. So the other advanced metrics treat outfielders more uniformly since they get compared to league averages across all positions. My Batting Value metric rewards Rasmus more by acknowledging that his level of offensive production was rare and unique among centerfielders. However, do recall that Rasmus had the 2nd worst Fielding Value in the NL among outfielders. The worst offensive outfielders in the NL were Jeff Francoeur of the New York Mets with a Batting Value of -21.89, Garrett Anderson of the Los Angeles Dodgers with a Batting Value of -17.25, and Carlos Lee of the Houston Astros with a Batting Value of -16.21. Francouer spent some time with the Rangers (15 games), but spent the vast majority of the year in the NL with the Mets (124 games). He had an Rbat of -13 and a wRAA of -10.6, the 5th worst in the NL. Anderson had an Rbat of -14 in his final season and a wRAA of -15, the 2nd worst in MLB and in the NL. Lee has the unique distinction of being among the 3 worst outfielders in the NL in terms of both Fielding Value and Batting Value. He had an Rbat of -9 and a wRAA of -5.9. Nyjer Morgan of the Washington Nationals had the worst wRAA in MLB and in the NL at -15.3, and I had his Batting Value at -11.66. AL Outfield Actual Winner #1: Josh Hamilton, Texas Rangers AL Outfield Actual Winner #2: Carl Crawford, Tampa Bay Rays AL Outfield Actual Winner #3: Jose Bautista, Toronto Blue Jays AL Outfield Player Value Winner #1: Josh Hamilton, Texas Rangers (Best LF) AL Outfield Player Value Winner #2: Jose Bautista, Toronto Blue Jays (Best RF) AL Outfield Player Value Winner #3: Carl Crawford, Tampa Bay Rays AL Centerfield Player Value Winner: Vernon Wells, Toronto Blue Jays
Hamilton led MLB and the AL outfielders with a Batting Value of 48.48. He also led MLB across all positions. Bautista finished 2nd in MLB and the AL among outfielders with a Batting Value of 40.29, good for 4th in MLB and 2nd in the AL across all positions. Crawford finished 3rd best in the AL among outfielders with a Batting Value of 21.10, so we have quite a disparity between the top 2 and the rest. Wells led all AL centerfielders with a Batting Value of 21.08, but was barely surpassed by Crawford among all outfield positions. That means we got all 3 of the AL outfielders right! Here are their AVG, OBP, SLG, OPS, wOBA, and Batting Value Average first quartile comparisons: Hamilton: .359 vs .259, .411 vs .331, .633 vs .384, 1.044 vs .724, .445 vs .322, -.0085 vs -.1016 Bautista: .260 vs .257, .378 vs .334, .617 vs .425, .995 vs .768, .422 vs .336, -.0160 vs -.0913 Crawford: .307 vs .262, .356 vs .333, .495 vs .387, .851 vs .731, .369 vs .324, -.0598 vs -.0993 Wells: .273 vs .250, .331 vs .320, .515 vs .365, .847 vs .683, .363 vs .308, -.0707 vs -.1141 Here are their traditional counting batting stats: Hamilton: 571 PA, 111 1B, 40 2B, 3 3B, 32 HR, 100 RBI, 38 uBB, 5 IBB, 5 HBP, 1 SH, 4 SF, 95 SO, 11 GIDP Bautista: 683 PA, 56 1B, 35 2B, 3 3B, 54 HR, 124 RBI, 98 uBB, 2 IBB, 10 HBP, 0 SH, 4 SF, 116 SO, 10 GIDP Crawford: 657 PA, 122 1B, 30 2B, 13 3B, 19 HR, 90 RBI, 43 uBB, 3 IBB, 3 HBP, 3 SH, 5 SF, 104 SO, 2 GIDP Wells: 646 PA, 83 1B, 44 2B, 3 3B, 31 HR, 88 RBI, 45 uBB, 5 IBB, 3 HBP, 0 SH, 3 SF, 84 SO, 18 GIDP Here are their comparisons relative to their first quartiles: Hamilton: +30.55 1B, +17.17 2B, +1.08 3B, +24.29 HR, +.24 uBB, +12.63 SO, +3.93 IBB, +2.57 HBP, +.76 SH, +1.66 SF, +4.97 GIDP, -12.3 other Outs Bautista: -38.65, +4.47 2B, +.94 3B, +35.62 HR, +52.94 uBB, +13.48 SO, -.15 IBB, +8.25 HBP, -.01 SH, +.44 SF, -2.27 GIDP, +24.86 other Outs Crawford: +26.94 1B, +2.32 2B, +11.27 3B, +10.15 HR, +.64 uBB, +12.69 SO, +1.92 IBB, +.01 HBP, +3 SH, +2.12 SF, -5.03 GIDP, +32.54 other Outs Wells: -4.83 1B, +22.1 2B, -.55 3B, +24.92 HR, +3.43 uBB, -11.77 SO, +3.92 IBB, +.56 HBP, -.95 SH, +1.05 SF, +11.94 GIDP, +56.49 other Outs Hamilton had an Rbat of 51 and a wRAA of 56.8, the most in MLB and the AL. Bautista also had an Rbat of 51 and a wRAA of 55.1, the 2nd most in MLB and the AL. Crawford had an Rbat of 28 and a wRAA of 25.2. Wells had an Rbat of 19 and a wRAA of 21.9. Shin-Soo Choo and Nick Swisher rated better than Crawford and Wells in terms of wRAA at 33.6 and 29.5, respectively. I had Choo still faring pretty well with a Batting Value of 13.43, but Swisher not as much at 6.46. The worst offensive outfielders in the AL were Juan Pierre of the Chicago White Sox with a Batting Value of -19.95, Trevor Crowe of the Cleveland Indians with a Batting Value of -18.50, and Ichiro Suzuki of the Seattle Mariners with a Batting Value of -15.38. Ichiro! What! But he batted .315! Sure, but his slugging, OPS, wOBA, and Batting Value Average are all worse than the first quartile. Ichiro gets a lot of hits, but the vast majority of them are singles, and he doesn't walk very often. His teammate Franklin Gutierrez had the worst wRAA in the AL at -15.43, and had a Batting Value of -10.17. Pierre had the 2nd worst wRAA in the AL at -11.1. Pitchers and Designated Hitters NL Pitcher Actual Winner: Yovani Gollardo, Milwaukee Brewers NL Pitcher Player Value Winner: Yovani Gollardo, Milwaukee Brewers 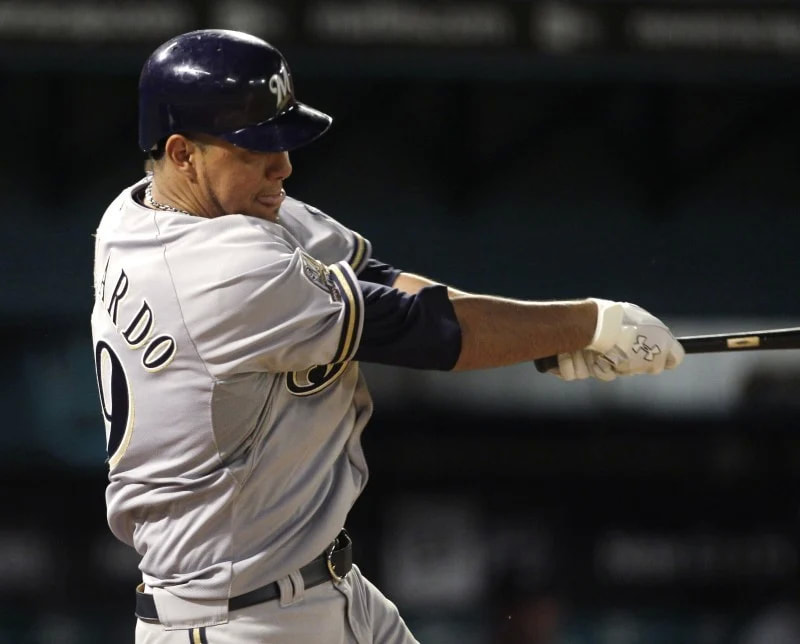 Nowadays the hitting ability of a pitcher no longer really matters, but in 2010 pitchers in the NL still hit and could provide value in that manner. Gallardo led all NL pitchers with a Batting Value of 9.07, and was properly identified as the best hitting pitcher in the league. The next best was Dan Haren of the Arizona Diamondbacks, who had a Batting Value of 7.90. Starters get more plate appearances so they have more opportunities to increase their Batting Value. The best hitting relief pitcher was Gustavo Chacin of the Houston Astros with a Batting Value of 1.29. Pitchers in the AL can still provide Batting Value when on the road against NL teams, but the amounts generally aren't consequential so I won't dive into those. No Silver Slugger award is given to AL pitchers. Here are their AVG, OBP, SLG, OPS, wOBA, and Batting Value Average first quartile comparisons: Gallardo: .254 vs .104, .329 vs .127, .508 vs .113, .837 vs .246, .631 vs .650, -.940 vs -1.162 Haren: .364 vs .104, .375 vs .127, .527 vs .113, .902 vs .246, .996 vs .650, -.993 vs -1.162 An .837 OPS for a pitcher is certainly something to marvel at, but granted that he did this in only 72 plate appearances. Shohei Ohtani had a .965 OPS in 2021 with 639 plate appearances. According to Stathead, Gallardo's season ranks as the 65th best pitcher season in terms of OPS among pitchers with at least 70 plate appearances. Haren's OPS was even better, but he had even fewer plate appearances with just 57. Here are their traditional counting batting stats: Gallardo: 72 PA, 8 1B, 4 2B, 0 3B, 4 HR, 10 RBI, 5 uBB, 0 IBB, 2 HBP, 2 SH, 0 SF, 17 SO, 0 GIDP Haren: 57 PA, 13 1B, 6 2B, 0 3B, 1 HR, 7 RBI, 1 uBB, 0 IBB, 0 HBP, 1 SH, 0 SF, 9 SO, 0 GIDP Gallardo had the most homers by a pitcher in MLB in 2010, and nobody else even had more than 1. Haren had the most doubles, but Gallardo was tied for 3rd. Given the smallness of their counting stats, I won't dive into how they compare above/below their first quartiles for the different stats. Both Gallardo and Haren had an Rbat of 3. Haren actually led with a wRAA of 3.3, with Gallardo in 2nd at 2.5. The worst offensive pitcher in the NL was Clayton Kershaw of the Los Angeles Dodgers, with a Batting Value of -7.32. Kershaw was the 6th best NL pitcher at pitching in 2010, but his poor batting actually puts him behind Gallardo in terms of overall value. Even in small quantities, every additional hit/walk/etc that a team can get is valuable. Kershaw had an Rbat of -13 and a wRAA of -15.4, also the worst in the NL. AL Designated Hitter Actual Winner: Vladimir Guerrero, Texas Rangers AL Designated Hitter Player Value Winner: Jim Thome, Minnesota Twins
This one hurt to see. Vladimir Guerrero is my favorite player and the reason my favorite number is 27. And on the surface he had a great penultimate season in his lone year with the Rangers, hitting 29 homers and batting .300. He won his 9th Silver Slugger and appeared in his 8th All-Star game, and finished 11th in MVP voting. But his Batting Value was just -3.40. Thome had a notably superior Batting Value of 20.04. As was the case for all seasons prior to 2022, there was no DH in the NL in 2010. Here are their AVG, OBP, SLG, OPS, wOBA, and Batting Value Average first quartile comparisons: Vlad: .300 vs .270, .345 vs .353, .496 vs .438, .841 vs .816, .363 vs .356, -.0719 vs -.0736 Thome: .283 vs .271, .412 va .355, .627 vs .438, 1.039 vs .820, .439 vs .358, -.0070 vs -.0719 We can see that where Vlad gains over Thome in batting average, he quickly gets outgained in terms of on-base percentage. My man liked to hit and would swing at anything thrown his way. Walking wasn't his forte, and neither was mine. Here are their traditional counting batting stats: Vlad: 643 PA, 121 1B, 27 2B, 1 3B, 29 HR, 115 RBI, 30 uBB, 5 IBB, 9 HBP, 0 SH, 6 SF, 60 SO, 19 GIDP Thome: 340 PA, 35 1B, 16 2B, 2 3B, 25 HR, 59 RBI, 56 uBB, 4 IBB, 2 HBP, 0 SH, 2 SF, 82 SO, 8 GIDP Here are their comparisons relative to their first quartiles: Vlad: +39.18 1B, -1.78 2B, -.16 3B, +9.5 HR, -25.59 uBB, -52.21 SO, +1.99 IBB, +6.93 HBP, +0 SH, +2.37 SF, +9.7 GIDP, +99.53 other Outs Thome: -7.71 1B, +.8 2B, +1.47 3B, +14.6 HR, +25.83 uBB, +21.86 SO, +2.34 IBB, +.88 HBP, +0 SH, +0 SF, +3.2 GIDP, -15.99 other Outs Like was the problem with Ichiro, Vlad didn't walk enough. He did have some power, but he also grounded into too many double plays. He also had a decent knack for getting plunked, something I can relate to in my high school playing days as well. Thome had an Rbat of 32 and a wRAA of 32, the highest among DHs. Vlad had an Rbat of 14 and a wRAA of 21.9, the 4th best among DHs. So the assertion that Thome was better than Vlad and was the best hitting DH isn't unique. The worst offensive designated hitter in the AL was Adam Lind of the Toronto Blue Jays, with a Batting Value of -23.64. He had an Rbat of -12 and a wRAA of -5.6, the 6th worst among DHs. Ken Griffey Jr. of the Seattle Mariners had the worst wRAA among DHs at -9.2, and I had his Batting Value at -12.86, the 5th worst. SILVER SLUGGER SUMMARY Now that we've gone through each position and each league, here's a quick summary of the players that should have won the Silver Slugger at each position, based on Batting Value: AL C - Joe Mauer (actual winner), Twins 1B - Miguel Cabrera (actual winner), Tigers 2B - Robinson Cano (actual winner), Yankees 3B - Adrian Beltre (actual winner), Red Sox SS - Alexei Ramirez (actual winner), White Sox OF - Josh Hamilton (actual winner), Rangers OF - Carl Crawford (actual winner), Rays OF - Jose Bautista (actual winner), Blue Jays DH - Jim Thome, Twins NL C - Geovany Soto, Cubs 1B - Joey Votto, Reds 2B - Dan Uggla (actual winner), Marlins 3B - Ryan Zimmerman (actual winner), Nationals SS - Troy Tulowitzki (actual winner), Rockies OF - Carlos Gonzalez (actual winner), Rockies OF - Matt Holliday (actual winner), Cardinals OF - Colby Rasmus, Cardinals P - Yovanni Gallardo (actual winner), Brewers The AL got 8 of their 9 right, and the NL got 6 of their 9 right. We were much better at giving the Silver Sluggers out correctly than we were the Gold Gloves! HANK AARON AWARD The Hank Aaron award is given to the best overall offensive player in the AL and the NL. It is decided between a mix of a fan vote and a panel of Hall of Famers, and was first created in 1999. You can view past winners here. Below are the winners in 2010 compared to which players should have won based on their Batting Value: NL Actual Winner: Joey Votto, Cincinnati Reds, First Base NL Player Value Winner: Joey Votto, Cincinnati Reds, First Base Somehow we correctly identified Votto as the best offensive player in the entire National League but failed to realize that he was the best offensive first baseman in the NL. Granted that the Silver Slugger and Hank Aaron Award don't have the same built-in layering that the Gold Glove and Platinum Glove do, but this result was still odd. AL Actual Winner: Jose Bautista, Toronto Blue Jays, Right Field AL Player Value Winner: Josh Hamilton, Texas Rangers, Left Field Hamilton would be voted the MVP in 2010, and it certainly wasn't for his fielding prowess, so it's odd that Bautista was declared the superior hitter. Sharing of the spoils, I suppose. BATTING VALUE BY POSITION Like I did for the Fielding Value post, I'll now show that Batting Value isn't particularly biased or skewed towards certain positions. Any guy at any position that leads his position in batting can be among the league leaders. A shortstop that gives you +10 home runs over the positional first quartile is just as valuable as a first baseman that does the same thing, even if the first baseman hit 40 homers and the shortstop only hit 20. Here are the boxplots of Batting Value by position:  Most positions have pretty similar spreads, with perhaps the exception of catchers. This is likely because they tend to get fewer plate appearances, as the first quartile values by position from earlier showed. Okay, those are the visuals. But what are the actual values? Here are some summary statistics of Batting Value by position:  Note that the pitcher values are the values of all pitchers, starters and relievers, in both leagues. In reality, I divide pitchers into 4 groups: AL SP, AL RP, NL SP, and NL RP. The values above are also among all players, not just starters. Thought would have it that since a team's Batting Value correlates well with its runs scored per game, then the teams that have players with the most Batting Value should be the ones that scored the most runs. These also may be the teams that win the most, since run differential per game correlates well with winning percentage (wins per game). Here are the boxplots of Batting Value by team in 2010:  Looks like the Reds had a higher median than most teams, and we know they were good in 2010. The Mariners appear to have a lower median than most teams, and they were bad in 2010. And here are summary statistics of Batting Value by team in 2010:  Sure enough, the Reds had the highest median Batting Value and went 91-71 and won their division, while the Mariners had the lowest median Batting Value and went 61-101 and came last in their division. Pirates, Orioles, Nationals, and Diamondbacks all had lower median Batting Values and all came last in their divisions. But this isn't perfect, as the Padres had a low median too and won their division. Yankees, Phillies, Braves, and Giants join the Reds as teams with higher medians and good records. The Rockies, however, had a higher median but were barely above .500. Let's cap it off by viewing the runs scored by team in 2010:  You'll notice a strong correlation between a team's median Batting Value and its runs scored. Reds, Phillies, Yankees, Rays all towards the top, and Mariners, Pirates, Orioles, Astros, and Nationals all towards the bottom.
So, in conclusion, why use Batting Value and thus Player Value?
Thank you all for reading and let me know your thoughts on the comments below. Also be sure to sign up for my newsletter using the link below to get updates for each post. We've done Fielding Value and Batting Value for 2010, so the last step in the 2010 example rollout of Player Value is Pitching Value and total Player Value. In the next post I plan to go over which players should have won the MVP, Cy Young, Reliever of the Year, and Rookie of the Year in each league. I'll also list out some 1st team and 2nd team honors. Statting Lineup Newsletter Signup Form: If you'd like to receive email updates for each new post that I make, sign up for the Statting Lineup newsletter using the link below: https://weebly.us18.list-manage.com/subscribe?u=ab653f474b2ced9091eb248b1&id=3a60f3b85f
0 Comments
Leave a Reply. |
Statting Lineup Newsletter Signup Form:
|