|
Everyone's favorite time of the year has arrived, with the 2024 BBWAA Hall of Fame Ballot announced and the results set to be shared on January 23rd. As always, I will analyze each player on the ballot using my own opinions backed by statistical arguments. I will also share how each player fares in terms of my Player Value metric (which I'm still working on long-term to further refine), as well as the fate that my Hall of Fame model predicts for each player. You can read about the current version of my Player Value metric here, as well as its addendum here. Different rankings using Player Value can also be found here. Player Value exists to function as a simplified version of WAR (Wins Above Replacement) with a slightly different implementation. Players are still judged based on the run-value of the events they produce in terms of batting, fielding, baserunning, and pitching. The current version of Player Value has more simplified statistical splits than is preferable. Rather than comparing players to a hypothetical replacement level, they are compared to their positional 25th percentile, which I believe eliminates the need for a positional adjustment. You can read my paper on my Hall of Fame predictive model here. I created this model for a project in one of my statistics classes during my senior year of college. I was encouraged to enter my model into a larger competition and it finished in 2nd place. The model does NOT look at previous vote totals to make its predictions; rather, it looks at the career accolades and statistical accomplishments of players that have (or haven't) been inducted into the Hall of Fame and uses that knowledge to evaluate future players. The final model is actually a combination of 4 different sub-models, so it's possible for a sub-model to believe a player is a Hall of Famer but the overall model to not. Note that the Hall of Fame model does not currently predict pitchers. I plan to eventually revamp my Hall of Fame model as well, but my priority is still working on refining Player Value. As I've noted before, there are 2 ways to run players through the Hall of Fame model. One is using the initial dataset, meaning the model is not aware of any inductees from 2022 or 2023, so the last Hall of Famers that it's aware of are Ted Simmons, Derek Jeter, and Larry Walker from the 2020 class that was inducted in 2021 due to COVID. The other way is to use an updated dataset, informing the model of any inductees (and non-inductees) from the last few years. Under this approach, the model now knows that guys like David Ortiz, Gil Hodges, and Scott Rolen are Hall of Famers, while players like Ryan Howard, Prince Fielder, and Jeff Kent are not. Generally this approach has the advantage of having more complete and recent data, but has declined in accuracy from the initial model. Without getting into the nitty gritty of predictive modeling, AUC is a measure of model accuracy and the closer it is to 1, the better. The initial dataset resulted in the model having an AUC of .9817, while the updated dataset gave the model an AUC of .9246. Since the initial dataset is still the more accurate one, that is the model whose prediction results I will be mainly sharing. However, if the updated model (or sub-models) think that any player should be inducted that the initial model didn't, then I'll be sure to mention that for each player as well. With the background aside, let's start taking a look each of the players on the ballot. I will order the players starting with who I would vote for, then who I would maybe vote for or be ok with being inducted, and lastly who I don't think should be inducted. Players I Would Vote For If I Had A BBWAA Ballot: Adrian Beltre, 3B (1998-2018) Texas Rangers, Los Angeles Dodgers, Seattle Mariners, Boston Red Sox  I think unsurprisingly, Beltre is the one absolute, certified Hall of Fame lock on this year's ballot. Starting on the most traditional side of things, his 3,166 career hits rank 18th all-time. I believe that not using PEDs and obtaining 3,000 hits is an automatic qualifier for Hall of Fame induction. Of the 33 players in history with at least 3,000 hits, 26 are in the Hall of Fame. Of the 7 not in Cooperstown, one is hit king Pete Rose, who is banned from baseball. Four of those are players that have not had their Hall of Fame candidacy voted on yet, in Beltre, Albert Pujols, Ichiro Suzuki, and Miguel Cabrera. The remaining two are PED users Alex Rodriguez and Rafael Palmeiro. Additionally, Beltre's 477 career home runs rank 31st all-time. I also believe that not using PEDs and obtaining 500 home runs is an automatic qualifier for Hall of Fame induction. Of the 28 players in history with at least 500 home runs, 19 are in the Hall of Fame. From the 9 players that aren't, 2 haven't had their cases voted on yet (Pujols, Cabrera). The remaining 7 all used PEDs (Rodriguez, Palmeiro, Sammy Sosa, Mark McGwire, Manny Ramirez, Gary Sheffield). While Beltre failed to reach this iconic mark, he came very close. Only 2 players have more homers than him and also aren't in the 500 home run club, and both are now Hall of Famers (Lou Gehrig and Fred McGriff). In terms of accolades, Beltre appears to have gotten the short end of the stick compared to what his numbers suggest he deserved. However, his award accomplishments are still fairly impressive. His 5 Gold Gloves rank 8th among third basemen, tied with Ken Boyer, Doug Rader, and Hall of Famer Ron Santo. Of the 7 players with more Gold Gloves at third base, 3 are in the Hall of Fame (Robinson, Schmidt, Rolen), and one is still active (Nolan Arenado). Beltre's 4 Silver Sluggers rank 4th among third basemen, tied with Jose Ramirez and Matt Williams. Of the 3 players with more Silver Sluggers at third base, 2 are in the Hall of Fame (Boggs, Schmidt), and one is still active (Arenado). Beltre's 4 All-Star games are tied for 33rd among third basemen, with 10 other players such as Sal Bando, Al Rosen, and Kris Bryant. Even just by looking at awards we see that Beltre's combination of offensive and defensive skill was unique and only topped in history by the likes of Mike Schmidt and Nolan Arenado. On the more advanced statistical side, Beltre's career WAR of 93.5 ranks very favorably as the 3rd highest among third basemen in history, only behind Hall of Famers Schmidt and Eddie Mathews. Across all positions, his WAR ranks 40th all-time, behind 35 Hall of Famers, 3 PED users (Bonds, A-Rod, Clemens) and the yet-to-be-voted-on Pujols. On the offensive side of WAR, Beltre's career Rbat of 257 ranks 10th among primarily third basemen all-time, behind 6 Hall of Famers and John McGraw, who may have been inducted as a player if he hadn't already been inducted as a manager. On the defensive side of WAR, Beltre's career Rfield of 216 ranks 2nd among primarily third basemen all-time, only behind Hall of Famer Brooks Robinson. In terms of Player Value, Beltre ranks 13th all-time among third basemen at 374.03. That puts him behind 9 Hall of Famers and 3 third basemen that Player Value thinks are underrated in Darrell Evans, Harlond Clift, and Willie Kamm. I have 931 primarily third basemen by games played from 1912-2021, putting Beltre in the top 1.4%. While his Batting Value of 143.67 does not rank in the top 25 (38th), his Fielding Value of 226.73 ranks 6th all-time among third basemen. Even though Player Value thinks that Beltre gained most of his value with his glove, it doesn't think he was ever actually the best defensive third baseman in his league, giving him 0 Gold Gloves. It agrees with his 4 Silver Sluggers, but thinks he should have been a 6 time ALl-Star instead. Unsurprisingly, the Hall of Fame model predicts Beltre as a Hall of Famer, giving him a 65.22% probability. While 2 of the sub-models predicted Beltre as a Hall of Famer (FDA and SVM), 2 of them did not (GLM and NNet), giving him probabilities of 46.73% and 45.10%, respectively. The updated model gives Beltre a slightly higher probability at 71.40%, and also wins over the support of the NNet sub-model. Verdict: I hope I've been able to make it clear how blatantly obvious it is that Adrian Beltre belongs in the Hall of Fame as one of the greatest third basemen, both offensive and defensively, in the history of baseball. He should be a first-ballot inductee and receive a very high percentage of the vote. Todd Helton, 1B (1997-2013) Colorado Rockies  Helton was very, very close to being inducted on last year's ballot, receiving 72.2% of the 75% needed. I supported Helton's case last year and part of my argument then was his similarity to recently inducted Hall of Famers Edgar Martinez and Larry Walker. You can check out this comparison on Stathead and see that all 3 of these players have 2000+ hits, 300+ home runs, 470+ doubles, 1250+ RBI, and slash lines above .300/.400/.515/.930. Amongst this trio, Helton has the most hits, RBI, and highest batting average. Another similar Hall of Famer that nearly fits those criteria is Jeff Bagwell, whose .297 career batting average falls slightly lower. In fact, just 13 players in baseball history have meet these criteria. Among them are 11 Hall of Famers in Martinez, Walker, Babe Ruth, Stan Musial, Rogers Hornsby, Ted Williams, Lou Gehrig, Mel Ott, Chipper Jones, and Frank Thomas. The only non-Hall of Famers are Helton and PED user Manny Ramirez. Helton is clearly one of the more impressive offensive players in history. Helton fares decently on the accolade side with 5 All-Star appearances, 4 Silver Sluggers, and 3 Gold Gloves. His 5 All-Star games are only tied for 33rd most all-time among first basemen, but other recent first base inductees like Thomas, Bagwell, and Jim Thome also sit at 5 or less All-Star games. While the Silver Slugger is a fairly new award (since 1980), Helton is tied with obvious future Hall of Famer Albert Pujols for the 2nd most all-time among first basemen. Ahead of them with 5 is the still active (and potentially future Hall of Famer) Paul Goldschmidt. Helton's career WAR of 61.8 ranks 17th all-time among first basemen. Ahead of him are 11 Hall of Famers, 2 future Hall of Famers in Pujols and Miguel Cabrera, 2 PED users in Rafael Palmeiro and Mark McGwire, and another potential future Hall of Famer in Joey Votto. A likely underrated aspect of Helton's game was his defense, as his Rfield ranks as the 9th most by a primarily first baseman in history. Other first base comparisons include ranking 13th in hits (behind 11 HOFers, Pujols/Cabrera, and Palmeiro), ranking 4th in doubles (behind HOFer David Ortiz and Pujols/Cabrera), ranking 8th in OBP (behind 7 HOFers and Ferris Fain), ranking 14th in slugging (behind 10 HOFers, Pujols, McGwire, and Carlos Delgado), and ranking 11th in OPS (behind 9 HOFers and McGwire). Player Value is particularly fond of Todd Helton, rating him as the 4th best first baseman from 1912-2021 with a Player Value of 699.13. While I don't believe that to be true, the metric is accurate enough in other areas to certainly at least suggest that Helton's value is vastly underrated. I have 894 first basemen based on games played during that span, putting Helton in the top 0.4%. Based solely on value provided at first base, Helton ranks 3rd. His Batting Value of 375.52 ranks 9th, behind 8 Hall of Famers. What really is the kicker is that Helton's Fielding Value of 329.22 ranks as the highest among all first basemen from 1912-2021. Player Value thinks that Todd Helton is clearly a Hall of Famer, if not one of the better players in history. On the accolade front, Player Value thinks Helton should have been a 6 time All-Star, won 5 Silver Sluggers, and won 5 Gold Gloves. Like last year, the Hall of Fame model predicts Helton as a Hall of Famer and this year gives him a probability of 73.03%. All 4 of the sub-models believe that Helton is worthy of induction. The updated model still predicts Helton as a Hall of Famer, but gives him a lower probability at 62.89% and he also loses support from 2 of the sub-models (FDA and GLM). Verdict: I think we allow the impact of playing for the Rockies, as well as our notions of what a typical first baseman looks like, to blur our perception of how valuable of a player Helton was. While Coors allowed him to hit more homers and therefore have a higher slugging and OPS when at home, the same wasn't true for 50% of Helton's career when playing on the road. Furthermore, much of his value wasn't from being a typical slugging first baseman with unconquerable power. Rather, Helton added value offensively by walking and getting on base a lot, as well as by hitting many doubles. He also added a great deal of value defensively with his glove. I think Helton is clearly deserving of induction. Andruw Jones, CF (1996-2012) Atlanta Braves, New York Yankees, Chicago White Sox, Texas Rangers, Los Angeles Dodgers  Jones is another player whose induction I supported last year and will carry over this year. My traditional argument for him is pretty simple. We've previously discussed my 500 home run automatic qualifying rule, and Jones got fairly close with 434 career homers, ranking 48th all-time. Between him and the soon to be effective Hall of Fame line of 477 homers once Beltre gets inducted are 17 other players. Of those 17, 8 are in the Hall of Fame (Musial, Stargell, Chipper Jones, Winfield, Yaz, Guerreo, Bagwell, Dawson). Also ahead of him is likely future Hall of Famer Carlos Beltran. The other 8 players were all more one-dimensional home run hitter types such as Adam Dunn, Dave Kingman, and Nelson Cruz. So while Andruw Jones' homers aren't quite enough to get him in on their own, they are very close. What puts him over the top is that he was also a terrific defender, winning 10 Gold Gloves in centerfield during his career. Only 5 other players have won 10 or more Gold Gloves in the outfield, and it's quite the list with 4 Hall of Famers (Clemente, Mays, Kaline, Griffey Jr.) and a future Hall of Famer in Ichiro Suzuki. Given these 2 feats, I don't see how anyone thinks Andruw Jones doesn't deserve to be in Cooperstown. Jones' career WAR of 62.7 ranks 14th among centerfielders, behind 10 Hall of Famers, Beltran, Mike Trout, and Kenny Lofton. His Rfield of 273 ranks 1st among primarily centerfielders in history, aligning with his many Gold Gloves. Those 434 homers rank 6th among centerfielders, behind 4 Hall of Famers (Mays, Mantle, Dawson, Griffery Jr.) and Beltran. Jones was a 5 time All-Star and finished 2nd in 2005 NL MVP voting after leading the NL with 51 homers and 128 RBI, but in terms of his Hall of Fame case it really comes down to his home run totals and defensive ability. Jones' Player Value of 334.01 ranks 16th all-time among centerfielders from 1912-2021. Ahead of him are 10 Hall of Famers, Beltran, the still active Mike Trout, and players that were denied induction in Jim Edmonds, Bernie Williams, Fred Lynn. I personally am fine with all 3 of those players getting inducted. I have 920 primarily centerfielders based on games played during this span, putting Jones in the top 1.7%. Most of Jones' value comes from his Fielding Value of 156.89, which ranks 9th all-time among centerfielders from 1912-2021. Above him there are 4 Hall of Famers (Ashburn, Carey, Speaker, Mays), as well as other defensive greats like 6-time Gold Glove winner Dwayne Murphy and 8-time Gold Glove winner Paul Blair. Jones' Batting Value of 177.86 ranks 33rd among centerfielders from 1912-2021, between the likes of Lenny Dykstra and Jim Wynn. In terms of accolades, Player Value thinks Jones should have been a 7 time All-Star but that he should have only won 4 Gold Gloves. The Hall of Fame model does NOT predict Jones as a Hall of Famer, giving him a probability of just 25.02%. However, the FDA sub-model does believe Jones to be a Hall of Famer, with a probability of 69.68%, though this is the least accurate in terms of AUC of the initial 4 sub-models. One of the most important variables to the FDA sub-model is the difference between a player's Range Factor per game (RF/G) and the average RF/G at their position during their career. Jones had a career RF/G of 2.49, meaning he made about 2.49 outs per game, while the average player with his positional mix during his career had an RF/G of 2.22. That gives Jones a difference of +0.27, which ranks 1st among all players on the 2024 ballot that I ran through the model. Of the 264 players in the dataset I used for the model only 14 of them had a higher RF/G diff than Jones, including 11 Hall of Famers, hence his support from the initial version of the FDA sub-model. The updated model gives Jones an ever lower probability of 9.50% and has none of the sub-models supporting him. Verdict: I think it's pretty clear that Jones is among the game's greatest centerfielders, and that the Hall of Fame has had an issue inducting qualified centerfielders unless they were absolutely inner-circle players like Ken Griffey Jr. But Jones' case for Cooperstown is really as simple as the fact that he hit a whole bunch of home runs at an important defensive position while also being one of the best defenders at that position in history. Carlos Beltran, CF (1998-2017) New York Mets, Kansas City Royals, New York Yankees, St. Louis Cardinals, Houston Astros, Texas Rangers, San Francisco Giants  I supported Beltran's induction last year despite his involvement in the 2017 Houston Astros' sign-stealing scandal. I discussed that in more detail last year and won't rehash that any more here. I think that statistically Beltran is an obvious Hall of Famer and the only reason he wasn't inducted his first time around last year was because of the sign-stealing scandal. We've covered the near 500 home run argument with Beltre and Jones already, and the same is true for Beltran. His 435 career home runs sit just above Jones for the 47th most all-time and the 5th most among centerfielders, behind 4 Hall of Famers as mentioned above under Jones' section. While Beltran does not have the Gold Gloves or defensive ability of Jones, he was the more dynamic offensive player. His 2,725 career hits are also close to my 3,000 hit automatic qualifier that I mentioned for Beltre. Beltran ranks 62nd all-time in hits, and 9th all-time among centerfielders, behind 5 Hall of Famers. Beltran's offensive profile is very similar to that of Hall of Famer Andre Dawson, who racked up 2,774 hits in his career and slugged 438 homers while also playing in the outfield. Beltran is one of just 13 primarily outfielders in history with at least 2,700 hits and at least 400 home runs. That list consists of 11 Hall of Famers, PED user Barry Bonds, and Beltran. When we restrict that to just primarily centerfielders, Beltran is one of just 3 players in history, along with Hall of Famers Willie Mays and Ken Griffey Jr. Beltran was fairly decorated with 9 All-Star games, which ranks 7th among centerfielders behind 5 Hall of Famers and Mike Trout. He's tied with Hall of Famer Larry Dobby, as well as Fred Lynn and Negro-Leaguer Neil Robinson. Beltran also ranks 3rd in doubles among centerfielders, behind Hall of Famers Tris Speaker and Ty Cobb. He ranks 5th in RBI among centerfielders, behind 4 Hall of Famers. Beltran's career WAR of 70.1 ranks 8th all-time among centerfielders, behind 6 Hall of Famers and Mike Trout. While 60 WAR is a good general cutoff of Hall-of-Fame-caliber WAR, there are only 11 players in history with 70+ WAR not in Cooperstown. Among them are Beltran and Beltre on this year's ballot, the still active Trout, future Hall of Famer Pujols, banned from baseball Pete Rose, and PED users Bonds, A-Rod, and Palmeiro. The remaining 3 players include underrated second basemen Lou Whitaker and Bobby Grich that many hope to be inducted by an Era Committee someday, and old-timer Bill Dahlen that played from 1891-1911. That is all to say that Beltran clearly has the WAR generally required to get inducted. Perhaps an underrated piece of Beltran's ability was his baserunning, as his 312 stolen bases aren't enough to initially amaze. However, he actually has the 4th highest stolen base percentage in history (with some playing time minimums). The 3 players ahead of him all have far fewer stolen base attempts, and Beltran is the only player in the top 15 with at least 300 stolen bases. This value is captured in his WAR, as Beltran's Rbaser of 55 ranks as the 14th most in history. Many people like to praise Barry Bonds as being the only member of the 400 home run, 400 stolen base club, but Beltran's 312 stolen bases and high percentage of success actually proved to be the more valuable combination (on the steals front, at least). Beltran's career Player Value of 416.39 ranks 10th among primarily centerfielders from 1912-2021, behind 8 Hall of Famers, Mike Trout, and Jim Edmonds. Again, with 920 centerfielders based on games played during this span, Beltran ranks in the top 1.1%. His Batting Value of 284.81 ranks 14th all-time among that same group, behind 8 Hall of Famers, Trout, Edmonds, Bernie Williams, Fred Lynn, and Andrew McCutchen. His Baserunning Value of 22.95 ranks 6th all-time among that same group. On the accolade front, Player Value thinks Beltran should have been a 7 time All-Star, 2 time Silver Slugger, and 1 time Gold Glover, as well as a 1 time Hank Aaron winner. Like last year, the Hall of Fame model predicts Beltran as a Hall of Famer, this year giving him a probability of 72.96%. Beltran also has induction support from each of the 4 sub-models. The updated model also thinks Beltran is a Hall of Famer and gives him an even larger probability of 83.57%, with each of the 4 sub-models still supporting him. One important note is that players not inducted for non-statistical reasons, such as the character clause (Pete Rose) or PED issues (Mark McGwire), were excluded from the list of players used to create the Hall of Fame model. That is likely the reason Beltran wasn't inducted last year, but I have decided to still use the model on him since it seems that voters aren't punishing Beltran as much and that his induction is likely to occur in the coming years. Verdict: I think Beltran is clearly a Hall of Famer on the statistical side. He played a premier defensive position and held his own while also being a tremendous baserunner and a well-rounded offensive threat. His involvement in the sign-stealing scandal certainly puts a blemish on his legacy but I don't think it is enough to disqualify his induction, as no other involved players were really involved and the Astros were not stripped of their World Series title. Billy Wagner, CP (1995-2010) Houston Astros, New York Mets, Philadelphia Phillies, Atlanta Braves, Boston Red Sox  Wagner is another player that I supported last year, and received a solid 68.1% of the vote in his 8th year on the ballot. Wagner has just 2 years of eligibility on the ballot remaining, so hopefully he clear the 75% required for induction and avoids a similar fate to that of Jeff Kent last year. I've mentioned my 3,000 hits and 500 homers automatic qualifiers, and I hold similar stances (as do most people) for starting pitchers that reach 3,000 strikeouts or 300 wins. Relief pitchers don't have as much statistical history to rely on, so a standard Hall of Fame save threshold hasn't really been established. Using 600 saves (or even 500 saves) is too extreme as only 2 players have eclipsed those marks in history (Hall of Famers Mariano Rivera and Trevor Hoffman). I believe that 400 saves is a good threshold, as just 8 players have recorded that many, and most people believe that relievers aren't as valuable as other positions and therefore not as many should be in the Hall of Fame. Wagner's 422 career saves clears that mark and ranks him 6th all-time, behind Hall of Famers Rivera, Hoffman, and Lee Smith, as well as fellow ballot member Francisco Rodriguez and the denied Jeff Franco. Apart from the staggering save total, Wagner appeared in 7 All-Star games in his career, which is tied for the 5th most by a reliever. Ahead of him are 3 Hall of Famers (Rivera, Goose Gossage, Hoyt Wilhelm) and the still-active Craig Kimbrel. Wilhelm played in the late 1950s and early 1960s when there were actually 2 All-Star games per season, so he actually only had 5 unique All-Star seasons, putting him behind Wagner. Tied with Wagner at 7 All-Star games are 3 Hall of Famers (Hoffman, Smith, Rollie Fingers) and the still-active Aroldis Chapman. I think Wagner's accolades squarely put him among some Hall of Fame counterparts. After setting some minimum playing time requirements, Wagner's career ERA of 2.31 ranks 6th among relievers all-time. The top 4 are all currently active relievers whose ERA's will surely deteriorate as they log more innings over their careers; they all have less than 250 innings pitched, while Wagner sits at 903. The only reliever in history with a lower ERA and as many innings pitched as Wagner is quite literally the greatest closer of all-time and the first unanimous Hall of Fame inductee, Mariano Rivera. You can check for yourself on Stathead. Wagner's career WAR of 27.7 ranks as the 14th highest among relievers all-time. Above him are 6 Hall of Famers (Dennis Eckersley, Rivera, Wilhelm, Gossage, Smith, Hoffman). Many of the players above him also spent considerable time as starting pitchers before switching to a relief role, and the nature of pitching more innings allowed them to accumulate more value. While Wagner didn't start a single game in his career, 6 of the relievers with more WAR than him started over 100 games, and 3 started over 200 games (including Eckersley). Hall of Famers and part-time starters aside, the only relievers with more WAR than Wagner are John Hiller and Lindy McDaniel. Player Value is more generous towards Wagner, as his career Player Value of 135.82 ranks as the 4th highest among primarily relievers from 1912-2021. Ahead of him are Hall of Famers Rivera and Wilhelm, as well as Kent Tekulve. With 6,098 relievers based on games played during this span, Wagner ranks in the top 0.1%. His Pitching Value of 138.59 ranks as the 3rd highest, only behind Hall of Famers Rivera and Wilhelm. On the accolade side, Player Value thinks Wagner should have been just a 4 time All-Star, but that he should have won 2 Reliever of the Year awards, rather than only one. The Hall of Fame predictive model was not initially setup to work on pitchers, since evaluating pitchers and position players for the Hall of Fame is vastly different. Therefore I didn't run Wagner through the model this year since I haven't gotten around to setting up a pitcher version yet. Verdict: Wagner ranks very favorably among other Hall of Fame relievers in terms of career saves, All-Star games, career ERA given his innings pitched, and Player Value. I think he clearly is one of the best relievers in history and deserves to be honored for playing that role. Many people think that relievers are overrated and less of them should be inducted, given that they throw far fewer innings than starters. I counter that they play unique, important roles in often high leverage situations. If we think they weren't as valuable, why would teams be using them? He was given a role and stood out among his peers while doing so. Wagner's Player Value even ranks favorably compared to many starters, such as Hall of Famers Jack Morris and Catfish Hunter and other notable players like David Cone and Andy Pettitte. Francisco Rodriguez, CP (2002-2017) Los Angeles Angels, Milwaukee Brewers, New York Mets, Detroit Tigers, Baltimore Orioles  I supported K-Rod's induction last year and will continue to do so this year. As I mentioned under Wagner's section, I think eclipsing 400 saves is worthy of induction. At 437 saves, K-Rod ranks even higher at 4th all-time, behind 3 Hall of Famers in Rivera, Hoffman, and Smith. Nobody has as many saves as K-Rod that isn't in Cooperstown. K-Rod also holds the record for most saves in a single season, when he recorded 62 in 2008. No other closer has recorded more than 60 saves in a season. K-Rod finished 3rd in AL Cy Young voting that year and would win his 2nd Reliever of the Year award. Rodriguez's 6 All-Star games in his career puts him tied for 10th among relievers in history. We covered the relievers with 7+ All-Star games under Wagner's section, a list that is entirely comprised of 7 Hall of Famers, 2 active players, and Wagner. Tied with Rodriguez at 6 All-Star games are Hall of Famers Dennis Eckersley and Bruce Sutter, as well as other notable closers in Joe Nathan and Jonathan Papelbon. The last one is Roy Face, who benefitted from seasons with 2 All-Star games and thus only had 3 distinct All-Star seasons. I would not have been upset if Nathan or Papelbon were inducted, but did not support their induction when they appeared on the ballot in 2021. The separation between K-Rod and Nathan/Papelbon is thin, but I put K-Rod over the edge given his single season save record and the fact that he racked up about 1 more season of solid closer production, as measured by saves. K-Rod's ERA to innings pitched comparison isn't as good as Wagner's, as he ranks 9th in ERA among relievers with at least 900 innings pitched. However, his 2.86 ERA and 976 innings pitched does barely surpass Nathan's 2.87 ERA in 923 innings; Papelbon posted a lower ERA at 2.44, but only pitched 725 innings. Rodriguez's career WAR of 24.2 ranks just 25th all-time among primarily relievers, not really supporting his case for induction. However, Hall of Fame closer Bruce Sutter is right there with him at 24.1. Player Value separates these two slightly more, as K-Rod's career Player Value of 72.89 ranks 34th among primarily relievers, while Sutter's Player Value of 92.45 ranks 18th. Rodriguez's Pitching Value of 64.16 ranks 25th among primarily relievers from 1912-2021. Player Value doesn't like K-Rod on the accolade front either, thinking he should have been just a 1 time All-Star and that he shouldn't have won any Reliever of the Year awards. However, with 6,098 relievers based on games played during this span, K-Rod still ranks in the top 0.4%. Again, the Hall of Fame predictive model is not currently set up to be run on pitchers. Verdict: I may have created Player Value, but I'm going with my more traditional gut here. I think K-Rod's career saves total and single season saves record deserve proper recognition, and his career All-Star games and ERA (given his innings pitched) are good enough to deserve induction. Omar Vizquel, SS (1989-2012) Cleveland Indians, Seattle Mariners, San Francisco Giants, Chicago White Sox, Texas Rangers, Toronto Blue Jays  I'll start Vizquel's discussion by acknowledging his domestic violence and sexual harassment incidents that have greatly hindered his induction chances among the BBWAA electorate, as he declined from receiving 52.6% of the vote in 2020 to receiving just 19.5% of the vote in 2023. I discussed Vizquel's incidents in my Hall of Fame post last year, as well as similar cases with Andruw Jones and Francisco Rodriguez. I do not support any of these cases and think that they are objective examples of bad behavior. However, I do think that Hall of Fame voters should focus on evaluating the on-field baseball career of players, rather than serving as more investigative moral arbiters. There are almost certainly players already in Cooperstown that committed just as worse (if not worse) acts than Vizquel, and to my knowledge the exclusion of a player from the Hall of Fame for off-the-field reasons (outside of betting on baseball or PED usage) is a fairly recent revelation. Very similar to Andruw Jones' case (who again, also has a domestic violence past but received 58.1% of the vote in 2023), my argument for Vizquel's induction is traditional and two-sided. For Jones, it was nearly hitting 500 home runs. For Vizquel, it is nearly recording 3,000 hits. I discussed the 3,000 hit qualifier previously under Adrian Beltre's section. Vizquel's 2,877 career hits ranks 44th all-time, and we've already covered the 33 mostly Hall of Famers with 3,000 or more hits. Of the 10 players with more hits than Vizquel but not quite 3,000 hits, 9 of them are in the Hall of Fame. The other player is Barry Bonds, who would be an obvious Hall of Famer if not for his PED usage. Vizquel has the most hits of any player that isn't in the Hall of Fame, isn't an obvious future Hall of Famer (Pujols, Cabrera, Beltre, Ichiro), isn't banned from baseball (Rose), or isn't a former PED user. That in itself is a very strong Hall of Fame argument to me, but again the actual automatic qualifier is 3,000 hits, not 2,8777, so Vizquel needs a little more to get over the hump. Fortunately for Vizquel, he was also an elite fielder at a premier defensive position. His staggering 11 Gold Gloves are the 2nd most by a shortstop in history, only behind Hall of Fame defensive wizard Ozzie Smith. Vizquel is one of only 9 players in history to win 11 or more Gold Gloves, and 7 of those are in the Hall of Fame (Maddux, Kaat, Pudge, Smith, Robinson, Clemente, Mays). The other is first baseman Keith Hernandez, and it is certainly arguable that winning 11 Gold Gloves at a premier defensive position like shortstop is more impressive than winning 11 Gold Gloves at a more offensively inclined position like first base. It is also certainly arguable that Keith Hernandez should be in the Hall of Fame himself. Vizquel's career WAR of 45.6 ranks 30th all-time among primarily shortstops. The players ahead of him include 20 Hall of Famers, PED users A-Rod and Miguel Tejada, and 2 older players that many think should be inducted as well in Bill Dahlen and Jack Glasscock. WAR does not value Vizquel as much defensively as his Gold Gloves would suggest. His Rfield of 129 ranks 18th all-time among primarily shortstops, but ahead of him are 8 Hall of Famers, the aforementioned Dahlen and Glasscock, and other notable defensive gurus like Mark Belanger and Andrelton Simmons. Interestingly enough, Vizquel's career Player Value of 285.84 also ranks 30th all-time among primarily shortstops from 1912-2021. While that's behind most Hall of Famers, he sits just ahead of Hall of Famer Phil Rizzuto. With 955 primarily shortstops based on games played during this span, Vizquel ranks in the top 3.1%. His Fielding Value of 278.48 ranks 8th, with 4 Hall of Famers ahead of him. Part of the reason that Vizquel's Player Value is his "compiler" nature, where he was able to rack up hits towards his career total despite poor performance overall (Vizquel played 24 MLB seasons, until he was 45). I think this argument goes both ways. On the one hand, Vizquel got more career hits to help his Hall of Fame case, but that extra playing time also decreased his career Player Value to hurt his Hall of Fame case. On the other hand, had Vizquel retired after his age 39 season, his career hit total would suffer but his Player Value would have been about 50 higher to place him in the top 25. I plan to workshop a potential Hall of Fame version of Player Value (similar to what JAWS is to WAR) that doesn't penalize players that play poorly when they are old. The key idea here is that Vizquel's "compiling" more or less washes out, as his Cooperstown case gets helped and hurt in different ways had he not played as long. The Hall of Fame model does NOT predict Vizquel as a Hall of Famer, giving him a probability of just 21.39%. None of the 4 sub-models support his induction, though the most accurate initial sub-model in terms of AUC (SVM) gives him the highest probability at 43.40%. The updated model also doesn't think Vizquel is worthy of Cooperstown, giving him a slightly lower probability at 20.47%, with none of the updated sub-models supporting his induction either. Verdict: Vizquel has done some bad things that certainly don't deserve any praise. However, I prefer to look at Hall of Famers solely for their non-cheating on the field merits. I think Vizquel's career hits total puts him close to consideration, and that his elite fielding skills at a premier defensive position, as measured by his numerous Gold Gloves, puts him over the top. Even if he retired earlier and didn't get as many hits, he still would have won all those Gold Gloves and his Player Value would have been even higher, closer to the typical Hall of Fame range. Torii Hunter, CF/RF (1997-2015) Minnesota Twins, Los Angeles Angels, Detroit Tigers  Torii Hunter is probably the most controversial (from a playing ability perspective) player that I support for induction. I supported him last year, and he barely survived on the ballot, receiving 6.9% of the 5% needed to remain. Hunter was even lower according to the publicly released ballots, but the private ballots at the end put him over the top. You can check out the 2023 tab in the public Ballot Tracker largely ran by Ryan Thibodaux and see that there Hunter only got 6.2%. This year, as of this writing, Hunter sits at just 8 votes from 174 publicly released ballots and 11 anonymous ballots, putting him at 4.3%. While that's a lower rate as last year, only about 48% of ballots have been revealed yet. I fear that Hunter may fall off the ballot this year given the wealth of other decent candidates that other voters may prefer. As I discussed last year, my argument for Hunter is embedded in my arguments for Andruw Jones and Omar Vizquel, as well as what my argument was for the now inducted Scott Rolen. Jones hit nearly 500 home runs (434) and won 10 Gold Gloves, but had just 1,933 hits. Vizquel had nearly 3,000 hits (2,877) and won 11 Gold Gloves, but had only 80 homers. Rolen was also a defensive wizard and won 8 Gold Gloves, but his offensive skills were more balanced with 2,077 hits and 316 home runs, rather than as being power-concentrated as Jones or as contact-concentrated as Vizquel. Hunter's argument is precisely the same; he was stellar defensively and won 9 Gold Gloves, and was more than competent offensively with a balanced 2,452 hits and 353 home runs. For some reason many more people think that Jones is worthy of Cooperstown than Hunter. Hunter had 519 more hits than Jones, and 118 fewer home runs. Of those 519 extra hits, 115 of them were doubles and 3 of them were triples. If we look at the FanGraphs Guts! page to understand how valuable different types of hits are, and then reconcile that with the hit differences between Jones and Hunter, we can see that Hunter clearly comes out on top. Using those 2023 FanGraphs weights, I have Hunter at +458 value for singles, +143 for doubles, +5 for triples, and -236 for home runs, putting his total career hitting value over Jones at +370. (I know I'm ignoring other offensive events here, but that's what we have Player Value for below!). Those 9 Gold Gloves by Hunter are the 7th most by an outfielder in history. Ahead of him are Jones, future Hall of Famer Ichiro Suzuki, and 4 Hall of Famers (Clemente, Mays, Kaline, Griffey Jr.). Hunter's career WAR of 50.7 ranks 26th all-time among centerfielders, behind 14 Hall of Famers. Also ahead of him are fellow ballot members Beltran and Jones, as well as other notable players that I wouldn't mind seeing inducted in Jim Edmonds and Kenny Lofton. So WAR isn't that fond of Hunter, and that trend continues when looking at the defensive piece of WAR. Hunter's career Rfield of 33 ranks just 186th among primarily outfielders in history. If we instead look at dWAR, which gives centerfielders more credit via the positional adjustment, Hunter ranks slightly more favorably at 76th among primarily outfielders. Player Value is also not overtly fond of Hunter, as his career Player Value of 215.80 ranks just 37th among primarily centerfielders from 1912-2021. As mentioned with Jones and Beltran, there are 920 primarily centerfielders based on games played during this span, which would put Hunter in the top 4%. Defensively, Hunter's Fielding Value of 143.38 ranks 15th among centerfielders, behind 4 Hall of Famers, Jones, Jim Edmonds, Paul Blair, and Mike Cameron, to name a few. Player Value agrees that Hunter was one of the better defensive centerfielders in history, but not quite good enough to boost his overall value up in Hall of Fame territory. On the accolade front, Player Value thinks Hunter should have only been a 2 time All-Star, only won 1 Silver Slugger, and even only won 1 Gold Glove. However, it does think he should have won a Platinum Glove in that year, something that only 5 other centerfielders can claim according to Player Value. The Hall of Fame model does NOT predict Hunter as a Hall of Famer, giving him a probability of just 17.76%, with none of the 4 sub-models supporting his induction either. The updated model also doesn't support his induction, but gives him a slightly higher probability at 18.23%, though still none of the sub-models think of him as a Hall of Famer. Verdict: This is another gut call that goes against what Player Value and WAR suggest, but I can't raitonalize my support of Rolen, Jones, and Vizquel without also supporting Hunter. The advanced metrics don't like Hunter's defensive abilities as much as the other 3 or as much as his Gold Gloves suggest. I think we should use the more advanced fielding metrics to make more informed Gold Glove selections in the future, but I don't think previous Gold Glove winners should be retroactively punished for what today's prevailing numbers suggest. A Gold Glove is meant to represent the best defender at each position in each league, and the winners should be treated as such when evaluating their candidacy. Practically every outfielder that has won as many Gold Gloves as Hunter has been inducted, and Hunter was certainly more valuable offensively than the likes of guys like Paul Blair or Garry Maddox. Advanced stats be damned, I think Hunter was a terrific fielder, and here's a video of some highlights to prove that. The first thing that comes to mind when I think of Torii Hunter is robbing home runs (this article ranks him as the 2nd best ever), which could be the reason behind his unimpressive advanced defensive numbers. Fans love to see a home run robbery, but systems like Player Value are more about the quantity of outs made rather than the difficulty of individual outs made. Modern systems like Outs Above Average do consider catch difficulty, but actually don't think robbing home runs is that difficult of a play for most fielders. This home-run-robbing catch by Brandon Nimmo in 2022 was given a whopping catch probability of 70% given its hang time of 5.2 seconds and that he was 76 feet from where the ball landed at the start of the play. Catch probability just doesn't do a great job at considering the difficulty of dealing with walls and timing jumps to rob home runs, in my opinion. Joe Mauer, C/1B (2004-2018) Minnesota Twins 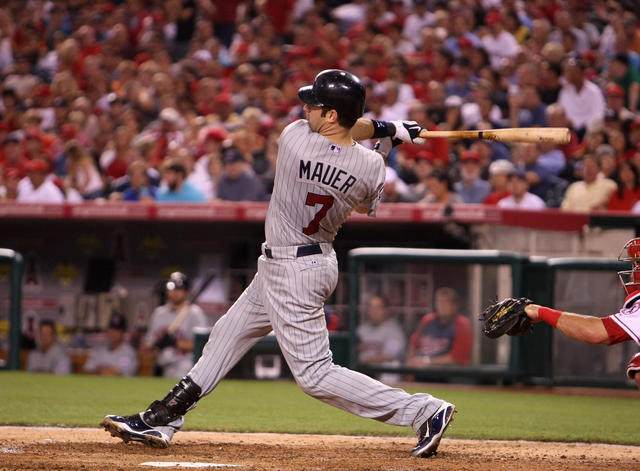 Mauer is the 2nd new addition to my hypothetical ballot this year, after the obvious inductee of Beltre. Given that Mauer was primarily a catcher, it's critical that we keep things relative to his position when developing our expectations (no catcher has ever hit 500 home runs or 3,000 hits, for example). Mauer's 2,123 career hits rank 9th all-time among catchers, behind 5 Hall of Famers, probably future Hall of Famer Yadier Molina, fellow ballot member Victor Martinez, and Jason Kendall. That's not enough to easily get him in, but it does rank him favorably towards the top. What we should note that outside of Hall of Famer Mike Piazza, none of the 8 catchers with more hits had as few plate appearances as Mauer. When it comes to contact, the man could flat out hit. His career batting average of .306 is again only topped by Piazza's .308 when it comes to catchers with more hits. After setting some playing time requirements, his batting average ranks 10th all-time among catchers, behind 6 Hall of Famers and 3 older players with significantly fewer hits that played when high batting averages were much more common. On the awards front, Mauer is one of only 12 catchers in history to win an MVP. Of the other 11 players, 7 are in the Hall of Fame, 2 should be in the Hall of Fame in my opinion (Thurman Munson and Elston Howard), 1 has yet to appear on the ballot (Buster Posey), and the odd man out is Bob O'Farrell. Mauer also won 3 batting titles by leading the league in batting average 3 times. Across all positions, this feat has been accomplished by 29 players in history. Of those 29 players, 22 are in the Hall of Fame. The exceptions are Miguel Cabrera (hasn't been on a ballot yet), Jose Altuve (still active), Pete Rose (banned from baseball), Ross Barnes & Pete Browning (both played prior to 1900), and Bill Madlock. Mauer is the only catcher in history to win at least 3 batting titles, outside of the great Negro Leagues catcher Josh Gibson. Heck, a catcher has only won the batting title 7 times in MLB history, and Mauer is responsible for 3 of those cases! He is also the only catcher to win the batting title in the AL. Reds Hall of Fame catcher Ernie Lombardi also won an MVP and 2 batting titles, and another Reds catcher Bubbles Hargrave won a batting tile in 1926. The most recent instance is Buster Posey's batting title in 2012, when he also won the MVP. Excluding the Negro Leagues, Mauer's .365 batting average in 2009 is the 4th highest in a season by a catcher in history, and he had nearly double the plate appearances than the 3 catchers ahead of him. Finishing out the awards front, Mauer's 5 Silver Sluggers are tied for the 5th most by a catcher in history (again, this award has only existed since 1980). Tied with him is Hall of Famer Gary Carter, potential future Hall of Famer Buster Posey, and another all-time great catcher in Jorge Posada. Ahead of him are Hall of Fame catchers Ivan Rodriguez and Mike Piazza, and two other great hitting catchers whose inductions I would support in Lance Parrish and Brian McCann (who will be on next year's ballot). Mauer's career WAR of 55.2 ranks 9th all-time among catchers, behind 8 Hall of Famers. He sits ahead of the average Hall of Fame catcher WAR of 53.6, making him clearly worthy of induction according to WAR. Mauer's peak was particularly impressive, as the WAR from his 7 best seasons is 39.0, which ranks 5th all-time among catchers, behind 4 Hall of Famers that you may have heard of (Carter, Bench, Piazza, Pudge). At his best, Mauer was one of the greatest catchers of all-time. Mauer's career Player Value of 212.72 is less impressive and ranks 28th among primarily catchers from 1912-2021. With 1,469 primarily catchers based on games played during this span, Mauer ranks in the 1.9%. His Batting Value of 147.60 ranks 25th. What probably hurts Mauer are his latter years as a first baseman. You can find his year by year values here by downloading the single season Minnesota Twins catcher and first base rankings. After further analysis, it was actually his latter years of still trying to catch that were his least valuable. For awards, Player Value thinks Mauer should have won 1 Hank Aaron award, 1 Gold Glove, 6 Silver Sluggers, and been a 4 time All-Star. The Hall of Fame model does NOT predict Mauer as a Hall of Famer, giving him a probability of 36.54%. However, the NNet sub-model does support his induction with a probability of 55.89%. The updated model also doesn't think Mauer is a Hall of Famer, but gives him a slightly higher probability at 40.15%. The updated NNet sub-model also likes Mauer slightly more and supports his induction, with a probability of 77.64%. Two of the variables that the NNet sub-model finds most important are All-Star games and singles, which Mauer fares decently at among his 2024 ballot peers that I've ran through the model, ranking 4th and 7th, respectively. Verdict: Mauer was clearly one of the best hitting catchers in history, and wasn't a defensive pushover either, winning 3 Gold Gloves and posting a positive career Fielding Value of 62.72. A catcher winning an MVP is a rare and impressive feat, and a catcher winning a batting title is even rarer, let alone 3. His peak according to WAR was clearly valuable enough for the Hall of Fame, and he still played long enough to post impressive career hits totals for a catcher. Chase Utley, 2B (2003-2018) Philadelphia Phillies, Los Angeles Dodgers 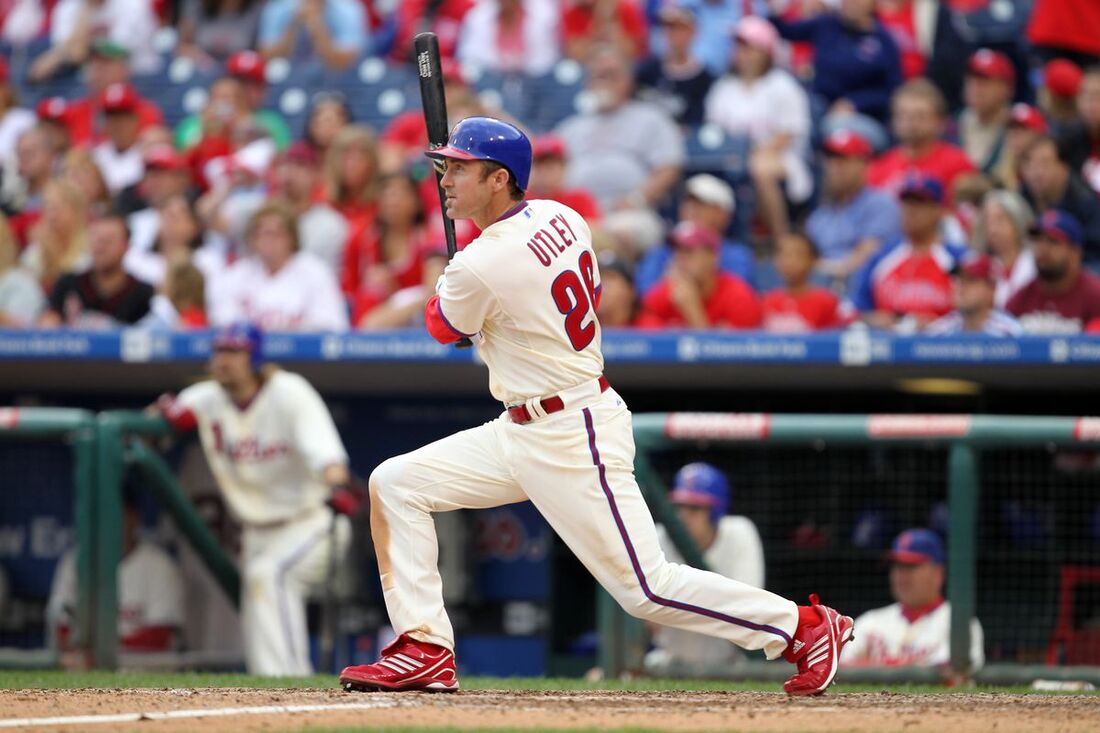 Utley rounds out my hypothetical 10 person ballot and is the 3rd newcomer this year after Beltre and Mauer. I don't think I'm as high on Utley as others, and might have trouble finding a spot for him on next year's ballot given the arrivals of Ichiro Suzuki and CC Sabathia, particularly if not many players are inducted this year. Parsing Utley out from other contemporaries like Brandon Phillips, Dustin Pedroia, and Ian Kinsler is a little difficult. As I've referenced before, Utley was a power hitting second baseman; do you know how rare that was in the National League? His 259 home runs rank 7th all-time among second basemen, behind 4 Hall of Famers, PED user Robinson Cano, and Jeff Kent. However, Kent is the all-time home run leader among second basemen and fell off the ballot last year, so according to BBWAA standards this apparently isn't good enough for induction. Utley played 16 seasons but only about 10 of those seasons were really complete, so most of his other career totals don't compare favorably to other second basemen. What will matter is how good he was during those years. Like with Carlos Beltran, I will note Utley's impressive career stolen base percentage of 87.5%, which ranks 3rd all-time after setting some minimum playing requirements. He also has about double the stolen base attempts of the 2 players ahead of him. Utley stole 154 bases and was caught just 22 times. In 2009, he stole 23 bases without being caught once. That is the 2nd most steals in a season without being caught, and stood as the record for 14 years until Trea Turner broke it this past season. In terms of awards, Utley's 4 Silver Sluggers are tied for the 4th most by a second baseman (award since 1980). Ahead of him are Hall of Famer Ryne Sandberg, the still active Jose Altuve, and PED user Robinson Cano. Tied with him are Hall of Famers Roberto Alomar and Craig Biggio, should be Hall of Famer Lou Whitaker, second baseman home run king (and should be Hall of Famer) Jeff Kent, and the longevity king Julio Franco. Utley's 6 All-Star games are tied for the 16th most by a second baseman. With the exception of the still active Altuve, PED user Cano (who hasn't appeared on the ballot yet), and Bobby Richardson, every second baseman with 7 or more All-Star games has been inducted. Players tied with Utley include should be Hall of Famer Bobby Grich and Negro League players Piper Davis, Pat Patterson, and Sammy Hughes. Also tied with him are Willie Randolph (who I wouldn't mind seeing inducted), Johnny Temple (who actually only had 4 distinct All-Star seasons), and Gil McDougald (who had an impressive but short 10 season career). Utley's career WAR of 64.5 ranks 15th all-time among second baseman, behind 10 Hall of Famers, should be Hall of Famers Whitaker and Grich, PED user Cano, and perhaps another should be Hall of Famer in Randolph. While Utley may not be the best second baseman not currently in Cooperstown, that doesn't mean he isn't worthy. Like Mauer, Utley's peak ranks even higher, as the WAR from his 7 best seasons of 49.3 ranks 9th all-time among second baseman, behind 7 Hall of Famers and PED user Cano. Utley's peak was even more impressive if we get a little narrower. From 2005 to 2009, Utley had 5 consecutive seasons of 7+ WAR, which is tied for the 4th most 7+ WAR seasons by a second baseman in history. The only 3 players with more are all Hall of Famers in Rogers Hornsby, Nap Lajoie, and Eddie Collins. The 2 players tied with him are also Hall of Famers in Joe Morgan and Charlie Gehringer. At his peak, Utley was clearly one of the best second basemen of all-time. Utley's career Player Value of 378.24 is slightly less impressive, and ranks as the 23rd most by a primarily second baseman from 1912-2021. Outside of positional comparisons, that Player Value is still very high, however. That amount would rank him 10th among left fielders or right fielders, 11th among catchers, 12th among center fielders, and 13th among third basemen. Player Value believes that some positions just have more variability in the quality of players that play them. I have 1,033 primarily second basemen based on games played during this span, which puts Utley in the top 2.2%. Utley's Batting Value of 248.88 ranks 18th among second basemen. Regarding awards, Player Value thinks Utley should have won 1 Hank Aaron award, 1 Gold Glove, 5 Silver Sluggers, and been a 7 time All-Star. The Hall of Fame model does NOT predict Utley as a Hall of Famer, giving him a probability of just 8.92%, with none of the sub-models supporting his case either. The updated model feels similarly, giving him a slightly lower probability at 8.04% and again no support from any of the sub-models. Verdict: At first glance, Utley's career numbers don't stand out as much compared to some of his peers. However, after honing in on his peak years, it's clear that Utley was one of the greatest second basemen in history, and I think that impressive peak is enough to merit his induction. Players I Think Are Close OR That I Would Vote For If More Than 10 Votes Were Allowed: Victor Martinez, C/DH/1B (2002-2018) Cleveland Indians, Detroit Tigers, Boston Red Sox Martinez is a new addition to the ballot this year that I initially had in more solid "yes" territory but have slotted down a little after some more consideration. The reason I liked Martinez was that he has solid batting numbers for a catcher. His 2,153 career hits rank 6th among catchers behind 3 Hall of Famers (both Pudges and Ted Simmons), a likely future Hall of Famer (Yadier Molina), and Jason Kendall. His 423 career doubles rank 4th, behind 2 Hall of Famers (Rodriguez, Simmons) and fellow new ballot member Joe Mauer, who appears to have decent induction odds. His 246 career home runs currently are tied for 14th, with 8 Hall of Famers ahead of him. Among players that spent at least 40% of their time at catcher and that had at least 5,000 career plate appearances, Martinez's career batting average of .295 ranks 13th, with 8 Hall of Famers ahead of him along with Mauer, Buster Posey, Joe Torre (inducted as a manager but really worthy as a player as well), and Manny Sanguillen. However, he ranks slightly worse in more accurate measurements of offensive quality like slugging percentage, OBP, and OPS. The reason I've lowered my opinion of Martinez slightly is because he wasn't entirely a catcher. He appeared in 1,973 games in his career, with 858 games as a catcher (43.5%), 869 games as a DH (44%), and 214 games as a first baseman (10.8%). So you can argue that he was really primarily a DH during his career, or at least half DH half catcher. Compared to the 5 players in the Hall of Fame that spent at least 40% of their games at DH, Martinez doesn't quite stack up, ranking last in hits, HR, RBI, OPS, and WAR. While Molitor was also about a 44% DH, Frank Thomas was about a 56% DH and spent the rest of his time at first base, another offensive heavy position. Harold Baines was about a 58% DH and spent most of his other time in right field, Edgar Martinez was about a 68% DH and spent most of his other time at third, and David Ortiz was a whopping 84% DH and spent most of his other time at first. So while Martinez may not compare as well to the current Hall of Fame DHs, most of them spent notably more time at DH and also played more offensively inclined positions when not a DH. As another point of comparison, Joe Mauer was really only about 50% catcher, 32% first baseman, and 17% DH, so comparing his career stats to other players like Ivan Rodriguez who was 95% a catcher may also be flawed in the same way. Martinez's career WAR of 32.0 ranks just 34th among catchers, but his Rbat of 176 ranks 16th behind effectively 11 Hall of Famers, 2 contemporaries in Mauer and Posey, and Gene Tenace. Martinez was basically a catcher from 2002 to 2011, during which he accumulated 24.2 of his WAR (76%), which ranks as the 3rd highest WAR by a catcher during that span, behind Mauer and Jorge Posada. If we focus on just 2004 to 2010, he ranks 2nd. If we look at the entire 2000s decade from 2000 to 2009, he ranks 6th despite not playing any games at all in 2000 or 2001 and only playing a total of 61 games in 2002 and 2003. Despite appearing in slightly more games as a DH, Martinez accumulated most of his value as a catcher and was one of the best catchers in the league while doing so. Martinez's career Player Value of 85.93 ranks just 101st among primarily catchers (by value) from 1912-2021. His career Batting Value of 102.37 ranks more favorably at 45th, but his Fielding Value of -15.47 ranks as the 16th worse. Martinez was mainly a catcher while in Cleveland and Boston, during which he posted 97.0 of his Player Value and 104.5 of his Batting Value. In Detroit he was mainly a DH, during which he posted a -11.1 Player Value and -2.2 Batting Value. Player Value agrees that Martinez should have won 2 Silver Sluggers, but thinks he should have been a 4-time All-Star rather than 5-time. With 1,469 primarily catchers during this span based on games played, Martinez would rank in the top 6.9%. By value, Martinez would rank 8th among DHs during this span, behind 2 Hall of Famers in Ortiz and Martinez. With around 152 primarily DHs based off of games played, Martinez would rank 16th, placing in the top 10.5%, behind the previously mentioned 5 Hall of Fame DHs. The Hall of Fame model does NOT predict Martinez as a Hall of Famer, giving him a probability of just 9.28%, with no support from any of the 4 sub-models. The updated model also doesn't support his case, but does give him a higher probability at 11.71%. None of the updated sub-models support Martinez for induction either. Verdict: I'm mainly a "no" for now on Martinez because I only get 10 spots. I hope he reaches the 5% necessary to keep him on the ballot for next year. According to the Ballot Tracker as of this writing, that doesn't seem to be the case given that he currently has just 1 vote out of the 185 publicly shared ballots (0.5%). This won't be my first time somewhat supporting a substantially failed candidate, as in 2022 I put Prince Fielder in this same category and he ended up receiving just 2 out of 394 votes (also 0.5%). Even in the hypothetical scenario where Martinez does make it to next year's ballot, it may be hard giving him my hypothetical vote depending on who all gets inducted this year, as next year's ballot will introduce some more solid first year candidates like Ichiro Suzuki, CC Sabathia, and several others. I think Martinez is an underrated candidate and was one of the best catchers of his time, but that others allow his later years as a DH distort that reality. Bobby Abreu, RF (1996-2014) Philadelphia Phillies, Los Angeles Angels, New York Yankees, Houston Astros, New York Mets, Los Angeles Dodgers Abreu retains his spot in my holdover list from last year. He remains a player that I don't entirely feel comfortable supporting given the fact that I never thought of him as a Hall of Famer while he was playing and I was growing up. As I noted last year, I will acknowledge that his best seasons from 1998-2004 were when I was either not alive or still quite young. The statistical case for Abreu does grow more and more on me each year, but this year I don't think he's one of the 10 most deserving players. Abreu's career WAR of 60.2 ranks 20th among primarily right fielders. Ahead of him are 14 Hall of Famers, PED user and fellow ballot member Gary Sheffield, banned from baseball Shoeless Joe Jackson, still active Mookie Betts, and 2 players that I think should be in the Hall of Fame in Dwight Evans and Reggie Smith. He sits just above Hall of Famer Vladimir Guerrero and future Hall of Famer Ichiro Suzuki. Clearly, according to WAR, Abreu is worthy. How is that the case, when his name doesn't scream stardom and his accolades only consist of 2 All-Star games, 1 Gold Glove, and 1 Silver Slugger? The answer is that Abreu produced value on ways that largely went unseen and under appreciated, such as walks. His career OBP of .395 ranks 7th among players that spent at least 50% of their time in right field and that had at least 5,000 career plate appearances. Ahead of him are 5 Hall of Famers and Elmer Valo, who had nearly 4,000 fewer plate appearances than Abreu. While Abreu wasn't necessarily devoid of power (288 career HR and 2 seasons of 30+), he did lack the power typically requested by right fielders, without making up for it with an elite glove like Ichiro or Clemente. Abreu's extra-base hit of choice were doubles, and his 574 career doubles are the 4th most by a right fielder behind 3 Hall of Famers. His 1,476 career walks also rank 4th among right fielders, behind 3 Hall of Famers. His 400 career stolen bases rank 7th among right fielders, with the 6 players ahead of him including 2 Hall of Famers and Ichiro. Abreu's career Player Value of 266.10 ranks 21st among primarily right fielders from 1912-2021. Ahead of him are 15 Hall of Famers and again the special caveats of Sheffield, Betts, Reggie Smith, and Dwight Evans, as well as an additional PED user in Sammy Sosa. Player Value groups Shoeless Joe Jackson with the left fielders. Vladimir Guerrero and Enos Slaughter have higher Player Values than Abreu despite having lower WARs, which makes me more partial to Abreu's Player Value ranking given that those 2 players are both Hall of Famers. With 992 primarily right fielders based on games played during this span, Abreu ranks in the top 2.1%. Abreu's Batting Value of 237.53 ranks 17th, behind 12 Hall of Famers, Sheffield, Smith, Evans, and Bryce Harper. His Baserunning Value of 17.06 ranks 5th, behind Ichiro, Bobby Bonds, Hall of Famer Kiki Cuyler, and Kirk Gibson. Player Value agrees that Abreu should have been a 2-time All-Star and won 1 Gold Glove, but doesn't think he should have won a Silver Slugger. The Hall of Fame model does NOT predict Abreu as a Hall of Famer, giving him a probability of 34.41%. However, the incredibly decisive FDA sub-model does support Abreu's case with a probability of 99.86%, though this is the least accurate in terms of AUC of the initial sub-models. I mentioned under Andruw Jones that this model likes the RF/G difference from positional average variable, but another variable it likes is the difference between a player's stolen bases and caught stealings. Abreu stole 400 bases in his career and was caught just 128 times, putting him at a net gain of 272. That ranks 3rd on the 2024 ballot members that I ran through the model, behind Reyes and Rollins. Of the 264 players in the initial dataset that I trained the model with, only 20 of them have a higher SB difference than Abreu, including 12 Hall of Famers. The updated model also doesn't predict Abreu as a Hall of Famer, giving him a slightly higher probability of 35.68%. Abreu loses his FDA sub-model support, but gains support from the SVM sub-model which gives him a probability of 54.09%, though the updated SVM sub-model took a big hit in accuracy with a much lower AUC of .8544, the least accurate of the updated sub-models. Abreu doesn't stand out in any of that updated sub-models 6 most important variables (AS, R, 1B, RBI, R per season, AVG), so it could just be a combination of fairing decently in several categories. Verdict: The name Bobby Abreu doesn't quite have that Hall of Fame "ring" to it, which is why I avoided placing him on my hypothetical ballot in previous years. At this point I think I am a "yes" on Abreu, and admittedly regret not having him on my ballot last year when I only used up 9 of the 10 spots. This year, however, my 10 spots are full and I'm not currently willing to place Abreu over any of the over 10 players. It has become more clear that Abreu was one of the best offensive right fielders in history and obtained that value by walking, hitting doubles, and stealing rather than hitting home runs and being a great defender like is more common for right fielders. I do think some people hype up Abreu a little too much and claim him as superior to Tony Gwynn and Vladimir Guerrero; Player Value does a good job of refuting that while still showing that Abreu is worthy of induction. Jimmy Rollins, SS (2000-2016) Philadelphia Phillies, Los Angeles Dodgers, Chicago White Sox Rollins was on my list of close players each of the last 2 seasons, and stays in that spot this year. This year I'm advocating for his long time teammate and double play partner Chase Utley to get inducted, but not him. You can view a comparison of these 2 players here. While Rollins has more hits, steals, and Gold Gloves, Utley clearly has the higher WAR along with more home runs, RBI, and better offensive rate stats across the board. Even so, these 2 guys are close and had their careers tied close enough together that inducting one and not the other may be an injustice, similar to how Alan Trammel is currently a Hall of Famer but Lou Whitaker isn't. Rollins' career WAR of 47.6 ranks 26th in history among shortstops, but the only non-Hall of Famers ahead of him are the PED using A-Rod, 19th century players Bill Dahlen and Jack Glasscock, and then Bert Campaneris and Jim Fregosi. So while Rollins isn't quite at the Hall of Fame edge for WAR, he is close. His 2,455 career hits rank 14th among shortstops, behind 10 Hall of Famers, A-Rod, Dahlen, and fellow ballot member Omar Vizquel. His 511 career doubles rank 7th among shortstops, behind 5 Hall of Famers and A-Rod. His 470 career stolen bases rank 11th among shortstops, behind 5 Hall of Famers, Dahlen, Campaneris, Maury Wills, Herman Long, and fellow ballot member Jose Reyes. His 4 Gold Gloves are tied for the 7th most by a shortstop, along with Brandon Crawford, Tony Fernandez, Andrelton Simmons, and Alan Trammel, only 1 of which is in the Hall of Fame. Ahead of this group are 3 Hall of Famers, Vizquel, Dave Concepcion, and Mark Belanger. Rollins is also one of 14 shortstops to be named MVP, along with 6 Hall of Famers and 2 PED users in A-Rod and Miguel Tejada. Looking at the 2000s decade, Rollins ranks 3rd in WAR among primarily shortstops from 2000-2009, behind Derek Jeter and Tejada, despite hardly playing in the 2000 season. Focusing instead on perhaps Rollins' peak from 2001-2012, he ranks 2nd behind only Jeter. Rollins' career Player Value of 229.21 ranks just 52nd among primarily shortstops from 1912-2021. There are 955 primarily shortstops based on games played during this span, putting Rollins in the top 5.4%. His Batting Value of 147.62 ranks 31st, while his Fielding Value of 52.60 ranks 162nd. His Baserunning Value of 28.98 ranks 6th, behind 3 Hall of Famers, Campaneris, and Wills. Player Value thinks Rollins should have just been a 1-time All-Star and that he shouldn't have won any Gold Gloves, but agrees that he deserved 1 Silver Slugger. The Hall of Fame model does NOT predict Rollins as a Hall of Famer, giving him a probability of 34.75%. However, the SVM sub-model, which was the most accurate initial sub-model in terms of AUC, does predict Rollins as a Hall of Famer with a probability of 72.69%. Two variables this sub-model likes are runs and singles, which Rollins ranks 5th and 4th in respectively among his 2024 ballot peers that I ran through the model. That sub-model also values defensive innings, which Rollins ranks 3rd in. Omar Vizquel takes the top 1-2 spos in a lot of those categories (and this was the sub-model that likes Vizquel the most), but Rollins still receives a higher probability than Vizquel due to his better stats for some of the other variables. The updated model also doesn't predict Rollins as a Hall of Famer, but has him pretty close at a probability of 46.83%. Rollins retains his support from the SVM sub-model, which gives him an even higher probability of 87.37%, though again this is now the least accurate updated sub-model in terms of AUC. That updated sub-model likes the runs scored per season variable, which Rollins ranks 2nd in behind only Reyes, with 101.19. He also gains the support of the updated NNet sub-model, which gives him a probability of 57.84%. That sub-model also likes the runs, singles, and runs per season variables. Verdict: Similar to Abreu, you can split the shortstop statistical leaders in enough ways for Rollins to have a solid argument, given that he ranks well in terms of hits, doubles, and stolen bases. Utley getting inducted may also boost his chances so that both members of the tag team can be enshrined. He also appears to have been the best shortstop in the NL during his prime, which is another good case for induction. Nontheless, I didn't see Rollins as one of the top 10 guys on the ballot this year so he doesn't get a hypothetical vote, but could in future years. I do think the fact that some similar players like Campaneris and Wills aren't inducted is something that hurts his argument. Mark Buehrle, SP (2000-2015) Chicago White Sox, Toronto Blue Jays, Miami Marlins Buehrle rounds out the list of guys that I wouldn't vote for this year but would like to see on next year's ballot. This was the same deal when I discussed his candidacy last year. He is the winner of 4 Gold Gloves, one of only 13 pitchers in history that can claim such a feat. Among the other 12 players are 6 Hall of Famers (Maddux, Kaat, Gibson, Mussina, Niekro, Palmer) and likely future Hall of Famer Zack Greinke. Buehrle lacks the starting pitcher Hall of Fame clinchers of 300 wins or 3,000 strikeouts. In fact, Buehrle failed to even reach 2,000 strikeouts, as his 1,870 career strikeouts rank just 107th among starters in history. Since the start of the expansion era in 1961, only 5 pitchers out of 54 total have managed to throw at least 3,000 innings and strike out less batters than Buehrle, which is a strong condemnation of his strike out effectiveness. Buehrle's career ERA of 3.81 is also not particularly impressive, ranking 43rd out of those same 54 pitchers. Jack Morris is the only Hall of Famer with a higher ERA (3.90) and at least 3,000 innings pitched across all of history, and Morris was a particularly controversial inductee. Buehrle's 214 career wins rank 94th among starters, but are the 11th most in the Wild Card era behind 3 Hall of Famers, 3 future Hall of Famers, and a PED user. While we may think of innings pitched as simply a measure of opportunity, they actually are a measure of success in some way since they require the pitcher getting the batter out. To that end, Buehrle has the 6th most innings pitched in the Wild Card era. Buehrle's career WAR of 59.1 ranks more favorably as the 65th highest among starters in history. While that may sound unimpressive, ahead of him are 46 Hall of Famers. Of the 18 non-Hall of Fame pitchers with a higher WAR, there are 5 pitchers that played in the 1800s, 4 pitchers that are still active and are all likely future Hall of Famers, another likely future Hall of Famer that hasn't yet appeared on the ballot in CC Sabathia, 3 PED users (Roger Clemens, Andy Pettitte, and Kevin Brown), and Curt Schilling who wasn't elected because of his character clause issues. The only remaining pitchers with a higher WAR than Buehrle that aren't in Cooperstown are Rick Reuschel, Luis Tiant, Tommy John, and David Cone, each of which I think has a solid case for induction. Even though Buehrle may not be the absolute Hall of Fame WAR border, he does rank ahead of 25 Hall of Fame pitchers (not counting Babe Ruth). During the course of his career from 2000 to 2015, Buehrle ranked 2nd in WAR behind only Hall of Famer Roy Halladay. Since 2000, he ranks 7th in WAR behind Halladay and 5 likely future Hall of Famers. Buehrle's career Player Value of 82.18 ranks just 128th among primarily starting pitchers from 1912-2021. With 2,296 primarily starters based on games played during this span, Buehrle ranks in the top 5.6%. His Fielding Value of 84.14 ranks 24th, but his Pitching Value sits at a very mediocre 12.57. Player Value thinks Buehrle should have gone to just 3 All-Star games rather than 5, and that he should have won 2 Gold Gloves rather than 4. Since Buehrle was a pitcher, the Hall of Fame model wasn't run on him. Verdict: Buehrle probably remains the one player that I remain the most torn on. If inducted, he would be an extreme Hall of Fame starting pitcher example in terms of career strikeouts and ERA. His career wins totals are alright, but his accolades are relatively lacking with no Cy Youngs and only 5 All-Star appearances. However, his innings pitched are impressive and his career WAR also suggests that he could be worthy. The fact that he ranks 2nd in WAR during his career is especially moving, but the fact that his Player Value doesn't also stand out has me not fully convinced that Buehrle is ultimately deserving. Player Value greatly prefers his contemporaries of Tim Hudson, Johan Santana, and Felix Hernandez. Players I Wouldn't Vote For Due To PED Usage But That Are Otherwise Deserving: Alex Rodriguez, SS/3B (1994-2016) New York Yankees, Seattle Mariners, Texas Rangers Statistically, A-Rod is clearly deserving of induction. We've mentioned the 500 home run and 3,000 hit marks, and he's cleared both of those easily. His 696 home runs are the 6th most all-time and the most by a primarily shortstop, while his 3,115 hits are the 23rd most all-time and the 5th most by a primarily shortstop. His 2,086 career RBI are the 4th most all-time and the most by a primarily shortstop. His career WAR of 117.5 is the 12th highest all-time and the 2nd most by a primarily shortstop. A-Rod won 10 Silver Sluggers in his career, 7 of which were as a shortstop, which is the 3rd most by a shortstop behind Hall of Famers Barry Larkin and Cap Ripken Jr. His 14 All-Star games are tied with Hall of Famers Derek Jeter and Ernie Banks for the 3rd most by a shortstop, behind Hall of Famers Ozzie Smith and Cal Ripken Jr. He is one of just 11 players in history to win at least 3 MVP awards, with 7 of the other 10 being in the Hall of Fame. The exceptions are the still-active Mike Trout, fellow PED user Barry Bonds, and Albert Pujols who has yet to appear on the ballot. A-Rod's career Player Value of 820.88 is the most by a primarily shortstop and one of the highest across all positions from 1912-2021. With 955 primarily shortstops based on games played during this span, A-Rod ranks in the top 0.1%. His Player Value as a shortstop specifically is 571.32, which ranks 6th. His Batting Value of 656.04 also ranks 1st, while his Baserunning Value of 24.26 ranks 9th. Player Value thinks A-Rod should have won 7 Hank Aaron awards, 11 Silver Sluggers, and been an 11 time All-Star. Each of those are the most by a shortstop in Player Value's redistribution of awards. The Hall of Fame model was not built to run on PED users, since their reason for lack of induction is outside of the confines of their statistical/accolade worthiness. As such, I did not run A-Rod through the model and have no results to share on that front. Verdict: As I wrote last year, I don't think A-Rod deserves induction because of his PED usage. I do think that like Bonds and Clemens, A-Rod's greatness stands out even more than his fellow otherwise-Hall-of-Fame-worthy-PED-users like Sosa, McGwire, etc., but A-Rod also cheated when the rules were more clearly defined and testing was implemented. If Bonds and Clemens aren't in, then A-Rod shouldn't be in either. Once more obvious PED users begin getting inducted, then A-Rod should get in as well. Manny Ramirez, LF/RF (1993-2011) Boston Red Sox, Cleveland Indians, Los Angeles Dodgers, Chicago White Sox, Tampa Bay Rays Statistically, Manny is also clearly deserving of induction. We've mentioned the 500 home run automatic qualifier, and Manny's 555 career home runs rank as the 15th most all-time, behind 8 Hall of Famers, 5 fellow PED users (Bonds, A-Rod, Sosa, McGwire, Palmeiro), and Pujols who hasn't appeared on a ballot yet. Manny's 1,831 career RBI rank as the 20th most all-time, again behind only Hall of Famers, fellow PED users, or obvious future Hall of Famers yet to appear on the ballot. Among primarily left fielders, Manny's home runs rank 2nd all-time behind fellow PED user Bonds, and his RBI rank 4th all-time behind Bonds and Hall of Famers Ted Williams and Carl Yastrzemski. Manny's career WAR of 69.3 ranks 8th among primarily left fielders, behind Bonds, Pete Rose, and 5 Hall of Famers. His 12 All-Star games are the 6th most among primarily left fielders, behind Bonds, Pete Rose, and 3 Hall of Famers, one of which (Minnie Minoso) benefited from some of the two All-Star game years and really only had 9 All-Star seasons, including his 2 Negro League All-Star seasons. Manny won 9 Silver Sluggers, 8 of which were as an outfielder, ranking 3rd all-time among outfielders behind Bonds and the still-active Mike Trout. His career OPS of .996 effectively ranks 3rd among primarily left fielders behind Bonds and Hall of Famer Ted Williams. In terms of his actual on the field production, Manny Ramirez is clearly the best left fielder not currently in Cooperstown. Manny's career Player Value of 445.77 ranks 6th among primarily left fielders from 1912-2021, behind Bonds and 4 Hall of Famers. With 1,101 primarily left fielders based on games played during that span, Manny ranks in the top 0.5%. His Batting Value of 485.22 ranks even better at 3rd, behind only Bonds and Hall of Famer Ted Williams. Player Value thinks the actual voters did pretty well during Manny's career, awarding him with 11 All-Star games and 9 Silver Sluggers. One poor spot on Manny's career is his defensive ability, as his Fielding Value of -32.84 ranks as the 11th worst among primarily left fielders. WAR agrees with this blemish, as his Rfield of -129 is the 2nd worst in history by someone who played at least 40% of their games in left field. Since it's the PED usage that is blocking Manny from induction, I didn't run him through the Hall of Fame model. Verdict: Again as stated last year and as is the case with A-Rod, Manny deserves to be inducted based on his stats and accolades, but I don't think he should be inducted due to his PED usage. Once inducting PED users truly becomes the norm, then Manny should be inducted. Gary Sheffield, RF/LF/3B/DH (1988-2009) Florida Marlins, Los Angeles Dodgers, Milwaukee Brewers, New York Yankees, Atlanta Braves, San Diego Padres, Detroit Tigers, New York Mets Statistically, Sheffield is also clearly deserving of induction. Again, we've mentioned that 500 home run automatic qualifier mark, and Sheffield's 509 career homers rank 27th all-time behind 18 Hall of Famers, 6 fellow PED users, and 2 players not yet on the ballot (Pujols and Cabrera). His home run total ranks 7th among primarily right fielders, behind 5 Hall of Famers and fellow PED user Sammy Sosa. His 1,702 RBI also rank 7th among right fielders, behind 6 Hall of Famers. His 2,689 career hits rank 18th among right fielders, behind 14 Hall of Famers, Dave Parker, Rusty Staub, and future Hall of Famer Ichiro Suzuki who hasn't yet appeared on the ballot. Sheffield's WAR of 60.5 ranks 19th among right fielders, behind 14 Hall of Famers, Mookie Betts (still active), Shoeless Joe Jackson (banned), Dwight Evans, and Reggie Smith. His 9 All-Star games are tied for 9th among right fielders, along with Hall of Famer Vladimir Guerrero and Rocky Colavito (who benefitted from seasons with multiple All-Star games). Every right fielder with more All-Star games is in the Hall of Fame, with the exception of Ichiro. Sheffield is one of just 5 players that spent 40% of their games in right field with over 10,000 plate appearances and an OPS above .900; joining him are inner-circle Hall of Famers in Babe Ruth, Mel Ott, Hank Aaron, and Frank Robinson. Sheffield's career Player Value of 377.14 ranks 10th among primarily right fielders from 1912-2021. Ahead of him are 8 Hall of Famers and Dwight Evans, who should also be a Hall of Famer. With 992 primarily right fielders based on games played during this span, Sheffield ranks in the top 1%. His Batting Value of 419.12 is even more impressive and ranks 6th, behind 5 Hall of Famers. Like Ramirez, Sheffield struggled defensively; his Fielding Value of -49.19 ranks dead last among right fielders. WAR agrees that Sheffield was the worst defensive right fielder in history, as his Rfield of -195 also ranks dead last among players that spent at least 40% of their games in right field. Across all positions, his Rfield ranks as the 2nd lowest in history, ahead of only Derek Jeter. Since it's the PED usage that is blocking Sheffield from induction, I didn't run him through the Hall of Fame model. Verdict: As stated last year, Sheffield statistically is worthy of Cooperstown but I don't think he should be inducted due to his PED usage. Sheffield is in his last year on the ballot and thus far has been given the benefit that final year candidates historically receive. I don't think Sheffield should be the first clear-cut PED user in the Hall of Fame, and that his induction should only occur after players like Bonds, Clemens, or A-Rod. Andy Pettitte, SP (1995-2013) New York Yankees, Houston Astros Pettitte is the one player here that I don't think is an obvious statistical Hall of Famer, but I probably would consider him worthy if not for his PED usage. He didn't reach any of the clear pitching milestones, but did amass 256 wins and 2,448 strikeouts in his career. That win total is still good for 43rd all-time, with only 8 players ahead of him not in the Hall of Fame. One of those 8 is fellow PED user Roger Clemens, and another one is the still-active Justin Verlander. Four of those 8 played mainly before 1900, when wins were much easier to come by for pitchers. The two exceptions are both compiler cases in Jamie Moyer who played for 25 years until he was 49, and Tommy John who played for 26 years until he was 46. Pettitte pitched for only 18 seasons until he was 41. That strikeout total is good for 46th all-time, but with 20 pitchers ahead of him not in the Hall of Fame. We could throw out 8 pitchers that are either still active or haven't yet appeared on a ballot, as well as the PED user Clemens, but that still leaves 11 exceptions in guys like David Cone, Curt Schilling, and Mickey Lolich. Pettitte's career ERA of 3.86 could use some work; of the 60 pitchers in the live-ball era to throw at least 3,300 innings, Pettitte ranks just 53rd. Only Jack Morris has pitched as many innings with a worse ERA and made the Hall of Fame, and he threw over 500 more innings than Pettitte. Pettitte's lack of any Cy Youngs and only being a 3-time All-Star also hurt his case. Pettitte's career Player Value of 130.34 ranks just 71st among primarily starting pitchers from 1912-2021. With 2,296 primarily starters based on games played during this span, Pettitte ranks in the top 3.1%. His Pitching Value of 100.84 ranks 68th. Player Value agrees that Pettitte never deserved a Cy Young, but thinks he should have been to 4 All-Star games. As a PED-using pitcher, Pettitte hits both the checkmarks of a player that I can't run through the Hall of Fame model, so no results to share there. Verdict: Even ignoring his PED usage, I'm not sure that Pettitte is a clear-cut Hall of Famer. What helps him, as it helped Jack Morris, is his postseason history. Pettitte's name just feels like a Hall of Famer due to being one of the "Core Four" of the Yankees' dynasty in the late 1990s and early 2000s. Two of those four are already inducted (Jeter, Rivera), and I wouldn't be opposed if Posada were inducted as well. Pettitte's 5 World Series rings are tied for the 10th most in history by a pitcher. Of the 9 pitchers with more rings, 4 are in the Hall of Fame (Ruffing, Gomez, Ford, Pennock) and a decent number of the remaining guys were mainly riding the coattails of earlier Yankees dynasties led by the likes of Gehrig, DiMaggio, Mantle, and Berra. Regardless, Pettitte's use of PEDs makes him a clear no for me until inducting PED players becomes the norm. Players With Great Careers That Don't Quite Make The Cut: David Wright, 3B (2004-2018) New York Mets David Wright had a great initial start to his career and was certainly on track for Cooperstown. Unfortunately, various injuries derailed his chances of induction and led to an early retirement. Such is the case with many players in history, and until we begin inducting the likes of all of those players (see Al Rosen, Grady Sizemore, Nomar Garciaparra, Eric Davis, etc.), I don't understand how Wright deserves to get in. I do have a softer spot for players whose careers ended abruptly due to injuries/death, such as Hall of Famers Roy Campanella, Ralph Kiner, and Kirby Puckett, and believe that others like Thurman Munson and Albert Belle (and maybe even Prince Fielder and J.R. Richard) deserve this treatment. However, this isn't the case with Wright. Wright technically played for 14 seasons but only played 10 seasons of at least 100 games, from 2005-2014. During that span Wright was a 7-time All-Star, hit 20+ homers 6 times, won 2 Silver Sluggers, won 2 Gold Gloves, and finished top 10 in MVP voting 4 times. Due to his shorter career, Wright's counting stats are pretty low at just 1,777 hits and 242 home runs. Wright's career WAR of 49.2 also ranks just 28th among primarily third basemen. Some people like to focus on peak, but that is something WAR inherently captures; a 6 year career with seasonal WARs of 10 is just as valuable as a 20 year career with seasonal WARs of 3. Even so, if we look at the WAR from Wright's best 7 seasons, it comes out as 39.5, which still ranks only 23rd among primarily third basemen. That just simply isn't high enough to argue that Wright's prime was good enough for induction. Wright's career Player Value of 239.53 ranks just 34th among primarily third basemen from 1912-2021, while his Batting Value of 185.08 ranks 25th. With 931 primarily third basemen based on games played during this span, Wright's Player Value is in the top 3.7%. Player Value thinks Wright should have been just a 5-time All-Star, and that he should have won only 1 Silver Slugger and no Gold Gloves. The Hall of Fame model does NOT predict Wright as a Hall of Famer, giving him a probability of just 5.77%. None of the 4 sub-models support his case either. The updated model also doesn't predict Wright as a Hall of Famer, but does give him a higher probability at 9.89%. Again, no support from the sub-models. Verdict: Wright's shortened career wasn't valuable enough to merit induction. His career did not end due to a singular event to give him any type of additional benefit. Unfortunately, injuries ruining careers is just how it goes sometimes, and to induct Wright would mean needing to induct many other players whose careers fell off due to injuries. Bartolo Colon, SP (1997-2018) Cleveland Indians, Los Angeles Angels, New York Mets, Oakland Athletics, Chicago White Sox, New York Yankees, Texas Rangers, Montreal Expos, Minnesota Twins, Atlanta Braves, Boston Red Sox "Big Sexy" played for many teams during his 21 season career that lasted until he was 45 years old. Due to his long career, Colon was able to put up some fairly solid counting stats with 247 career wins and 2,535 career strikeouts. That strikeout total ranks 36th all-time, and is the 15th most by a player not in the Hall of Fame. Ahead of him are 6 players that haven't yet appeared on the ballot or that are still active, as well as PED user Roger Clemens. That win total ranks slightly lower at 51st all-time, and is the 12th most by a player not in the Hall of Fame, behind Clemens and 2 players yet to be on the ballot or that are still active (Sabathia, Verlander). So while Colon is certainly up there in history, he's not quite at necessary Hall of Fame levels. A good comparison is Jamie Moyer, who had 269 wins and 2,441 strikeouts and did not get inducted after receiving just 2.4% of the vote in 2018. While Moyer was just a 1 time All-Star, Bartolo made it to 4 All-Star games and also won the Cy Young award in 2005 after leading the AL in wins. Even so, those accolades aren't quite impressive enough to deserve induction. Bartolo's career ERA of 4.12 is also too high for Hall of Fame standards; the highest ERA among current Hall of Fame pitchers with at least 100 games pitched is Jack Morris' 3.90. Colon's career WAR of 46.2 ranks just 138th among starters in history, but Hall of Famer Dizzy Dean's career WAR is right there with him. Dean stood out more in his prime, as his 7-year peak WAR of 44.1 easily surpasses Colon's 35.5. Player Value is actually not very fond of Colon at all, perhaps due to its stricter standards than WAR. Colon's career Player Value is -17.50, which is the 709th worst that I have on file from 1912-2021, or the 1,526th best if you want to look at it that way. With 2,296 primarily starters based on games played during this span, Colon is only in the top 66.5%. His career Pitching Value is -17.03 and ranks as just the 1,405th best. His career Fielding Value is 32.36, however, which ranks better at 188th. Player Value thinks Colon shouldn't have a Cy Young and that he should have only been a 3-time All-Star. Since Colon is a pitcher (and even had some PED usage), he isn't applicable for the Hall of Fame model. Verdict: Colon did win a Cy Young and put up respectable career win and strikeout totals, but his poor career ERA reveals how he just wasn't an elite enough pitcher to make it into Cooperstown and that most of his counting stats are just the result of having pitched for a long time. This is also revealed in his negative Player Value, which in those later years thinks Colon was consistently in the bottom 25% of pitchers in the league. Additionally, Colon was suspended by MLB in 2012 for using a performance-enhancing testosterone, so his PED usage makes it even clearer to me that he doesn't deserve to get in. Matt Holliday, LF (2004-2018) St. Louis Cardinals, Colorado Rockies, New York Yankees, Oakland Athletics Holliday had an impressive career that included 7 All-Star games, 4 Silver Sluggers, a near .300 career batting average (.299), an .889 career OPS, 2,096 hits, and 316 home runs. He finished 2nd in NL MVP voting in 2007 after winning the batting title and leading the league in hits, doubles, RBI, and total bases. His career WAR of 44.5 ranks 36th among left fielders, while his career hits rank 33rd, home runs rank 25th, RBI rank 24th, and OPS ranks 18th (among players with at least 1,000 PA). Holliday was one of the better hitting left fielders in history on a rate basis, and while his career totals are still solid, they don't rank high enough among his positional peers to truly stand out. Holliday's career Player Value of 270.14 ranks 24th among primarily left fielders from 1912-2021. I have 1,101 primarily left fielders in terms of games played during this span, putting Holliday in the top 2.2%. In terms of time spent actually playing left field, Holliday's Player Value of 273.90 ranks 15th, behind 8 Hall of Famers and Barry Bonds. His Batting Value of 265.57 ranks 16th, behind 8 Hall of Famers, Bonds, Manny Ramirez, Pete Rose, and Shoeless Joe Jackson. Player Value agrees that Holliday should have won 4 Silver Sluggers, but thinks he should have just been a 3-time All-Star. The Hall of Fame model does NOT predict Holliday as a Hall of Famer, giving him a probability of 14.13%, with no support from any of the sub-models either. The updated model also doesn't predict him for induction, but does give him a higher probability of 17.87%, though still with no support from the sub-models. Verdict: Holliday had a good career, but just simply wasn't Hall of Fame caliber, and to induct him would mean needing to induct many other similar-level players. His Player Value shows that he is certainly one of the best left fielders in history that isn't currently in the Hall of Fame, but there are several others ahead of him like Bob Johnson, Ken Williams, Albert Belle, Brian Downing, Willie Wilson, and Brian Giles that would need to be inducted before he has a real argument. Jose Reyes, SS (2003-2018) New York Mets, Toronto Blue Jays, Miami Marlins, Colorado Rockies "The Major League Baseball Best 50" in 2008 ranked Jose Reyes as the 4th best player in the league. He was coming off of 3 straight seasons of leading the league in steals. Unfortunately, Reyes wasn't able to maintain a solid career into his mid-to-late 30s like is typically needed for induction, much like his long-time teammate David Wright. Reyes finished with a batting title, 1 Silver Slugger, 4 All-Star seasons, 2,138 hits, 131 triples (led league 4 times), and 517 steals (led league 3 times). His career WAR of 37.4 ranks just 54th among shortstops in history, while his hits rank 30th, triples rank 8th, and stolen bases rank 9th. While his speed totals are impressive, those typically aren't good enough in isolation to get a player into Cooperstown; fellow shortstops Bert Campaneris and Maury Wills had more steals and were denied induction. Reyes' career Player Value of 165.31 ranks just 77th among primarily shortstops from 1912-2021. I have 955 primarily shortstops based on games played during this span, putting Reyes in the top 8.1%. His Batting Value of 162.73 ranks 26th, and his Baserunning Value of 27.01 ranks 7th, but he generally lacked the defensive skills necessary for a Hall of Fame shortstop (also seen in his 0 Gold Gloves and career Rfield of -71). Player Value thinks he should have won 3 Silver Sluggers, but just been a 2-time All-Star. The Hall of Fame model does NOT predict Reyes as a Hall of Famer, giving him a probability of 19.68%, with no support from any of the sub-models. The updated model is still a "no" on Reyes, but gives him a much higher probability of 44.04%. Reyes also wins over the support of the updated SVM and NNet sub-models, with probabilities of 85.20% and 68.26%, respectively. However, the updated SVM sub-model is the least accurate of the bunch. Both of these sub-models like the runs scored per season variable, which Reyes ranks 1st with 101.84 compared to this 2024 ballot peers that I ran through the model. Verdict: Reyes was an exciting player in his prime but just couldn't maintain that level of success long enough to merit induction. He is one of the better base stealers in history, especially recently, but that skill alone isn't valuable enough to support his Hall of Fame case. Brandon Phillips, 2B (2002-2018) Cincinnati Reds, Cleveland Indians, Atlanta Braves, Los Angeles Angels, Boston Red Sox BP had a solid career that consisted of winning 4 Gold Gloves, 1 Silver Slugger, and going to 3 All-Star games. He hit over 30 homers and stole over 30 bases in his 2007 season, a feat that has only been accomplished by 2 other second basemen in history (Ian Kinsler and Alfonso Soriano). Phillips had a fairly long career until he was 37, but didn't really start playing in the majors until he was 25. He finished with 2,029 hits, 368 doubles, 211 home runs, 951 RBI, and 209 steals. His career WAR of 28.4 ranks 69th among second basemen, while his hits rank 26th, doubles rank 28th, homers rank 15th, RBI rank 25th, and steals rank 49th. These are solid rankings in history, but not quite high enough for induction. Phillips' career Player Value of 133.43 ranks 87th among primarily second basemen from 1912-2021. There are 1,033 primarily second basemen based on games played during this span, putting Phillips in the top 8.4%. His Fielding Value of 147.59 ranks 52nd, and his Batting Value was fairly poor at -8.60. On the fielding front, I do think Phillips (like Torii Hunter) is probably underrated by metrics-based systems that don't consider the more intrinsic difficulty/excitement of making certain plays, such as his behind-the-back or between-the-legs plays. On the batting front, most of his negative value is probably from his later years, as he had 33.66 Batting Value with the Reds and 38.81 Batting Value during his prime from 2007 to 2012. Player Value thinks Phillips should have been just a 2 time All-Star and won only 1 Gold Glove, but agrees with his 1 Silver Slugger. The Hall of Fame model does NOT predict Phillips as a Hall of Famer, with a probability of just 3.88%, the lowest of any player on the 2024 ballot that I ran through the model. As such, none of the sub-models supported his induction either. The updated model was still a hard "no" on BP, with a marginally higher probability of 4.09%, and still no support from the sub-models. Verdict: Brandon Phillips was another exciting player that was Hall of Fame caliber in his prime from 2007 to 2012. Being a 4 or so WAR player each year for 20 seasons will almost surely get you inducted (unless you're unlucky like Lou Whitaker), but doing that for only 6 seasons doesn't make the cut. Phillips will join the likes of the Hall of Very Good and can look forward to his eventual induction into the Reds Hall of Fame. Jose Bautista, RF/3B (2004-2018) Toronto Blue Jays, Pittsburgh Pirates, New York Mets, Philadelphia Phillies, Baltimore Orioles, Atlanta Braves, Kansas City Royals, Tampa Bay Rays Jose Bautista seemingly came out of nowhere in 2010, when he led the majors in homers with 54 and finished 4th in AL MVP voting. Though he had played for several teams since 2004, I had never heard of him until his breakout season and as a kid thought the sudden increase in home runs was the result of PED usage. Bautista would have been tested for such things and no news ever arose about potential PED usage, so "Joey Bats" is truly more of a Max Muncy situation where hard work, dedication, and practice seems to have paid off. Because it took time for Bautista to reach his peak form (he was 29 years old in that 2010 season), his career numbers are not as impressive. For someone that effectively debuted at 29, he did still manage to put up some solid career totals in certain areas due to his impressive seasons from 2010 to 2015. He finished with just 1,496 hits but 344 home runs and 975 RBI, as well as being a 6-time All-Star and winning 3 Silver Sluggers. Bautista's career WAR of 36.7 ranks just 66th among right fielders in history. His 7-year peak WAR of 38.2 ranks more respectably at 26th, while his homers rank 21st. From 2010-2015, Bautista led all of MLB in homers with 227 and ranked 7th in WAR with 35.3. Bautista's career Player Value of 168.62 ranks 53rd among primarily right fielders from 1912-2021, sitting between the likes of Paul O'Neil and Roger Maris. With 992 primarily right fielders based on games played during this span, Bautista is in the top 5.3%. His Batting Value of 137.78 ranks 42nd, sitting between players like Shin-Soo Choo and Dave Parker. Player Value thinks Bautista should have won one Hank Aaron award, 4 Silver Sluggers, and been a 4-time All-Star. The Hall of Fame model does NOT predict Bautista as a Hall of Famer, giving him a probability of just 6.00%, with no support from any of the sub-models. The updated model thinks nearly the exact same way, with a probability of 6.29%. Again, no support from the sub-models. Verdict: Bautista was a Hall of Fame caliber player for the 6 season period from 2010 to 2015. That peak was not quite good enough to merit his induction on its own; he'd have needed his 2010/2011 self in particular each year for that to be the case. It took him too many seasons to reach that peak, and he wasn't able to maintain being a quality player for long enough, in order for him to accumulate any more counting stats or value needed for induction. Hall of Very Good. Adrian Gonzalez, 1B (2004-2018) Los Angeles Dodgers, San Diego Padres, Boston Red Sox, Texas Rangers, New York Mets "A-Gon" had a solid 15-year MLB career that saw him amass 2,050 hits, 440 doubles, 317 homers, 1,202 RBI, 5 All-Star games, 4 Gold Gloves, and 3 Silver Sluggers. His career WAR of 43.5 ranks 43rd among first basemen, just below recent Hall of Fame inductee Gil Hodges. He is one of only 21 primarily first basemen in history that have amassed 2000+ hits and 300+ homers, a list that includes 10 Hall of Famers, 2 PED users, and 4 players either still on the ballot, yet to be on the ballot, or still active. But also in that list are the likes of Paul Konerko, Carlos Delgado, Andres Galarraga, and Lee May. Until it becomes the norm for guys like this to be inducted, Gonzalez doesn't have a solid argument. Among first basemen his hits rank 48th, homers rank 41st, RBI rank 39th, and doubles rank 31st. None of his rate stats stand out enough to push his case further like they would for Todd Helton or Joey Votto. He was solid defensively, as his Rfield of 73 ranks 11th among primarily first basemen in history. Gonzalez's career Player Value of 229.72 ranks 50th among primarily first basemen from 1912-2021, putting him between guys like Don Mattingly and Mark Grace. There are 894 primarily first basemen based on games played during this span, putting Gonzalez in the top 5.6%. His Fielding Value of 154.73 ranks 25th, between Will Clark and Anthony Rizzo (through 2021). His Batting Value of 77.03 ranks 81st, between guys like Ryan Howard and Cody Bellinger (through 2021). Player Value does not think that Gonzalez deserved any Gold Gloves, Silver Sluggers, or All-Star appearances in his career. The Hall of Fame model does NOT predict Gonzalez as a Hall of Famer, giving him a probability of just 7.51%, with none of the sub-models predicting him for induction either. The updated model also doesn't predict Gonzalez for induction, with a slightly lower probability of 6.34% and still no support from the sub-models. Verdict: Gonzalez was a solid defensive first baseman that could adequately hit for his position. Despite appearing in 15 seasons, he only really had 10 full seasons and thus wasn't able to accrue the offensive numbers that the Hall of Fame expects from most first basemen. He was consistently solid during those 10 years, but really needed to play for about 15 or 20 true seasons at that level to be inducted, or needed more of his 10 seasons to be like his absolute peak self from 2009 to 2011. Hall of Very Good. James Shields: James Shields, SP (2006-2018) Tampa Bay Rays, Chicago White Sox, Kansas City Royals, San Diego Padres With all due respect, I do think James Shields is the lone man out on this year's ballot, and I frankly would be disappointed if even a single voter wasted one of their 10 precious votes on him rather than any of the other more deserving candidates above. Per the Ballot Tracker (as of this writing) that hasn't been the case yet for any of the voters, though a few other players have also yet to receive a vote. Shields certainly isn't the worst player to ever be on a Hall of Fame ballot; he compares well to the likes of Bronson Arroyo, Jered Weaver, and John Lackey on last year's ballot. Unfortunately, this year's ballot is pretty stacked and I don't see any way to possibly justify voting for him. Shields was just a 1 time All-Star, won 145 games, struck out 2,234 batters in his career, and had a 4.01 career ERA. None of those are really near Hall of Fame starting pitcher standards. His career WAR of 30.7 ranks as the 283rd best by a starter in history. That 1 All-Star game is tied for the 220th most, his wins rank 264th, and his ERA ranks 425th. His strikeouts do rank slightly better at 61st, with 32 Hall of Famers ahead of him, as well as about 4 more future Hall of Famers and an otherwise Hall of Famer in PED user Clemens. But there's still a long list of others ahead of him that aren't (and shouldn't be) in Cooperstown. Shields had a career Player Value of -23.68, which you can probably guess doesn't rank too well. His Pitching Value was -48.14, while his Fielding Value was 31.09. Most of his negative value comes from his last 3 seasons with the White Sox from 2016-2018, when he put up a Player Value of -58.5 and a Pitching Value of -59.5. Shields is on the Player Value single season team for the Rays for his 2011 season, and posted a Player Value of 46.49 and a Pitching Value of 26.91 while in Tampa Bay, despite his poor 2010 season. Player Value does think that Shields actually should have been a 3-time All-Star. Since Shields was a pitcher, the Hall of Fame model wasn't ran on him. Verdict: A decent 13 year career as a Major League starting pitcher, and he made over $114 million while doing so. Just not quite Hall of Fame quality. Needed to be more consistently like his 2011 self. Conclusion To summarize, here is who I would vote for on my 10-person Hall of Fame ballot:
And here are the player's I'd like to stay on the ballot to consider further next year:
Below are the probabilities from the initial and updated Hall of Fame models, as well as each of the sub-models:
You can also check out the initial dataset of players that I used for the model, as well as the updated dataset:
And for complete transparency, here is the R code that I use to run the Hall of Fame model:
The below files provides a summary of how each players ranks in terms of Player Value:
Thank you all for reading and best of luck to all of the candidates involved. Here's to hoping we get a few players inducted this go around to leave more space open for new players on the ballot next year.
0 Comments
The National Baseball Hall of Fame announced the members of the 2024 Contemporary Baseball Era Committee Ballot on October 19th. This ballot consists of 8 managers, umpires, and executives/pioneers whose primary baseball contributions came after 1980. Specifically, there are 4 managers, 2 umpires, and 2 executives. The Contemporary Baseball Era Committee will meet on December 3rd to discuss and vote on the ballot. Each of the 16 committee members may vote for up to 3 people, and a person must receive at least 75% of the votes (12 votes) to be inducted. The specific members of the committee were announced on November 27th and include several former Hall of Fame players in Jeff Bagwell, Tom Glavine, Chipper Jones, Jim Thome, and Ted Simmons. Hall of Fame manager Joe Torre and Hall of Fame executive and former MLB commissioner Bud Selig will also be on the committee. Rounding out the 16 voters are 6 executives and 3 media members and historians, including the founder of Baseball Reference, Sean Forman. In this post I will discuss each of the candidates and share my hypothetical ballot. This will be slightly different from my typical player Hall of Fame analysis where I lean more heavily on my tools of Player Value and my Hall of Fame predictive model. However, one important thing to note is that these candidates are to be considered for their entire body of baseball work, rather than their specific worth for the role they will be inducted for. For example, if Joe Torre weren't already a Hall of Famer and were on the ballot, we would consider the joint value from both his playing and managerial careers. To this end, candidates that also were players will have their impact from their playing careers analyzed below as well. Rather than regurgitating how some of my tools work in this post, you can read about my Player Value metric here and my Hall of Fame predictive model here. I will note that there are 2 ways to run players through the Hall of Fame model. One is using the initial dataset, meaning the model is not aware of any inductees from 2022 or 2023. The other way is to use an updated dataset, informing the model of any inductees from the last 2 years. Generally this has the advantage of having more complete and recent data, but has declined in accuracy from the initial model. This year, however, the updated dataset actually resulted in an overall more accurate model. Without getting into the nitty gritty of predictive modeling, AUC is a measure of model accuracy and the closer it is to 1, the better. The initial dataset resulted in the model having an AUC of .9736, while the updated dataset gave the model an AUC of .9891, which is even better than the AUC of .9817 that the model had back in 2021 when it was first created. A caveat here is that ballot member Bill White was already in the dataset as an example of a non-Hall of Fame player, as he fell off the BBWAA ballot in 1977 after 3 years on the ballot and receiving just 1% of the vote. Because of this, I had to remove Bill White from the dataset in order for the model to predict his Hall of Fame case. If not, it is akin to telling someone that 2+2=4 and then asking them what 2+2 is; they will (or at least should) always tell you that it is 4. Ok, now on to discussing the ballot members. Managers Lou Piniella Manager Stats on Baseball Reference Player Stats on Baseball Reference Lou Piniella's most significant accomplishment was winning the 1990 World Series as the manager of the Cincinnati Reds. The Reds went 91-71 in the regular season and went wire-to-wire, meaning they led the NL West for every game of the season. After beating the Pittsburgh Pirates led by Jim Leyland (who is also on this ballot) in 6 games in the NLCS, the Reds swept the Oakland Athletics in 4 games. The series was considered a major upset, as the A's had won 103 games and were the previous World Series champions. That A's team was managed by future Hall of Famer Tony La Russa and included future Hall of Famer players Rickey Henderson, Dennis Eckersley, and Harold Baines, as well as the steroid slugging likes of the "Bash Brothers", Mark McGwire and Jose Canseco. Piniella's other big accomplishment was being the manager of the 2001 Seattle Mariners that went 116-46, tying the record for most wins in a season in Major League history. That team naturally won the AL West and advanced to the ALCS, but lost in 5 games to the New York Yankees' dynasty of the period. Piniella's career record was 1835-1713 for a winning percentage of .517. Of the 22 Hall of Famer managers, Piniella would rank 13th in wins and 19th in winning percentage. While he only won the one World Series and pennant, he went to 4 total league championship series, won the division 6 times, and advanced to the postseason 7 times in his 23 season managing career. His teams exceeded 100 games once, 90 games eight times, and had a winning record in 14 of his 23 seasons. He would rank 14th in number of winning seasons and 12th in number of seasons with 90+ wins. Piniella has also won the Manager of the Year award 3 times, an accolade that has existed since 1983. Hall of Fame manager contemporaries Bobby Cox and Tony La Russa each won that award 4 times. Piniella's playing career wasn't really near Hall of Fame quality, but I do think it is important to distinguish from managers that did not play in the majors at all (such as Jim Leyland) or from managers that only played for a very short period of time (such as Sparky Anderson). Piniella enjoyed an 18-year career primarily as a leftfielder with the Yankees and Royals. He was the 1969 AL Rookie of the Year with Kansas City and was an All-Star with the Royals in 1972, the same season that he led the American League with 33 doubles. He won 2 World Series as a member of the Yankees in 1977 and 1978. His 12.4 career WAR again isn't anything special, ranking 190th among fellow leftfielders. His Player Value comes out as -20, ranking 929th out of the 1,101 players I have as primarily leftfielders from 1912-2021. Part of that lower ranking is due to players that don't play very long not being able to produce much negative value. Player Value doesn't think Piniella should have been an All-Star, but does think he should have won a Gold Glove. The updated Hall of Fame predictive model did not predict Piniella as a Hall of Fame player, giving him a probability of just 6.5%, where at least 50% is needed to be predicted as a Hall of Fame player. For reference, last year the model gave Jhonny Peralta (who fell off the BBWAA ballot) a probability of 5.9%. Piniella appeared on the BBWAA ballot in 1990 as a player and received just 0.5% of the vote, falling off the ballot. Of the committee members, it's possible Torre could vote for Piniella out of respect for his peer. They faced each other in back-to-back ALCS matchups in 2000 and 2001. As a member of the Indians, Thome squared off against Piniella in the 1995 ALCS and the 2001 ALDS. Verdict: I think Piniella deserves to be inducted. He had a long managerial career with success at multiple spots. He wasn't the best manager of his time and won't be one of the better managers in the Hall, but worst managers have been inducted in my opinion, such as Bucky Harris and Wilbert Robinson. He ranks 17th in wins all-time, got a World Series title that has been precious to Reds fans, had an iconic season in Seattle, is up there in terms of Manager of the Year awards, and is also iconic himself due to his ejection meltdowns. His playing career isn't a substantial factor, but he did have a fairly long career with decent success so it at least gives him a bit of a favorable bump. Davey Johnson Manager Stats on Baseball Reference Player Stats on Baseball Reference Davey Johnson is a more unique case in that he had both a solid playing and managing career. His biggest managerial accomplishment was managing the 1986 New York Mets to a World Series victory over the Boston Red Sox in 7 games. This is the infamous "Buckner Play", so perhaps you can argue that if Bill had made the play then Johnson would have 0 championships to bout. The Mets went 108-54 that season, winning the NL East by more than 20 games. While 1986 was Johnson's only World Series and pennant, I believe it is important to mention the success of his 1994 Cincinnati Reds before the season-ending strike took place. Many people recall the 1994 Montreal Expos, who were 74-40 and led the NL East, and believe that they would have won the World Series had the season continued. However, the Reds led the NL Central and were 66-48. It is not extreme to think that Cincinnati could have won the World Series that season either; they would make it to the NLCS the next season in 1995. Johnson's career record was 1372-1071 with 2 ties for a .562 winning percentage. His win totals aren't too impressive, ranking 19th among the 22 Hall of Fame managers, but his winning percentage ranks a much more favorable 6th. He made it to a league championship series 5 times, won the division 6 times, and made the postseason 6 times in his 17 season managerial career. His teams exceeded 100 wins twice, 90 wins seven times, and had a winning record in 13 out of 17 seasons. He would rank 10th among Hall of Fame managers in percentage of seasons with winning records. He won the Manager of the Year award 2 times. As a player, Johnson primarily played second base with the Orioles and Braves. He was a 4-time All-Star and won the Gold Glove award 3 times. He won 2 World Series as a member of the Orioles in 1966 and 1970. His 27.4 WAR ranks 73th among fellow second basemen and he is one of just 41 second basemen in history to appear in at least 4 All-Star games. Davey famously hit 43 home runs in 1973, despite never hitting more than 20 any other season of his career. While the driver of that may be mysterious, it is the 2nd most home runs in a season by a primarily second baseman in history. Johnson's Player Value of 221.43 ranks 43rd out of the 1,033 players that I have on file as playing the majority of their games at second base from 1912-2021. While that mark probably isn't quite at the level of the Hall of Fame, it isn't that far off. Player Value agrees that Johnson should have been a 4 time All-Star, but think he should have only won 1 Gold Glove. The Hall of Fame model is not as keen on Johnson as Player Value is. It doesn't predict him as a Hall of Famer, giving him a probability of just 7.3% As for potential committee member biases, Chipper Jones and Tom Glavine were both on the Braves team that beat Johnson's Reds in the 1995 NLCS, so maybe there is some respect there. Torre and Johnson squared off in the AL East in 1996 and 1997, splitting who won the division each year. Verdict: I think Johnson deserves to be inducted. He had a solid managerial career and a good playing career that I think in combination more than merit his induction. Johnson probably didn't get the slack he deserved as a manager given his success; he went 98-64 with the Orioles in 1997, won the AL East, took them to the ALCS, and was named the Manager of the Year, and was basically forced to resign after disagreements with the team's owner. He was also let go by the Reds after the shortened 1995 season when he went 85-59, won the NL Central, and took them to the NLCS. This dismissal was again largely due to owner disagreements rather than performance issues, as Reds owner Marge Schott did not like that Johnson was living with his fiancee prior to marriage. I think Johnson could have been an even better manager if some teams had given him a more extensive chance. Regardless, Johnson still ranks 10th all-time in winning percentage among managers with at least 1,000 wins, with every manager ahead of him inducted in Cooperstown. Pair that winning success with a World Seres and a great playing career and I think Johnson is worthy of induction. Jim Leyland Manager Stats on Baseball Reference It is a little difficult to pinpoint a singular best accolade for Jim Leyland. His one World Series victory came in 1997 as the manager of the Florida Marlins, who did not begin playing in Major League Baseball until 1993. That team comprised of players like Kevin Brown, Robb Nen, Moises Alou, Gary Sheffield, Bobby Bonilla, Jeff Conine, and Charles Johnson. They beat the Indians dynasty of the period in 7 games after going 92-70 and finishing 2nd in the NL East. However, in Leyland's 2nd season with the Marlins in 1998 they would go a dismal 54-108 after getting rid of the vast majority of their stars - none of the aforementioned players were on the 1998 team. Leyland would resign from his Marlins duties due to these ownership decisions. So while Leyland got his World Series with the Marlins, he was only there for 2 seasons and still had a losing record overall. Leyland would reach 2 more World Series with the Detroit Tigers, falling short of a championship in 2006 and 2012. The 2006 squad went 95-67 and finished 2nd in the AL Central but lost in 5 games to the Cardinals. On that team was a young Justin Verlander and future Hall of Famer Ivan Rodriguez, as well as the likes of Placido Polanco, Magglio Ordonez, Carlos Guillen, and Curtis Granderson to name a few. Leyland would also win his 3rd Manager of the Year award in 2006. The 2012 team went 88-74 and won the AL Central, but got swept by the Giants. That team also had Verlander and fellow pitching ace and likely future Hall of Famer Max Scherzer, as well as the powerful likes of Miguel Cabrera and Prince Fielder. Most of Leyland's career however came as the skipper of the Pittsburgh Pirates from 1986-1996, in which he never led them to a World Series appearance despite playing in the NLCS for 3 consecutive seasons from 1990 to 1992. Those teams were led by Barry Bonds, Bobby Bonilla, Jay Bell, Doug Drabek, and Andy Van Slyke. Leyland's 1,769 career wins would rank 13th among current Hall of Fame managers, but his .506 winning percentage would rate as the 4th worst. While his 1 World Series victory isn't excessively impressive, his 8 appearances in a league championship series has only been topped by Hall of Famers Tony La Russa, Bobby Cox, and Joe Torre (granted that the LCS did not exist prior to 1969). His 3 Manager of the Year awards is also impressive and is only topped by La Russa and Cox. Jim Leyland never appeared in a Major League Baseball game as a player and thus I do not have any Player Value or Hall of Fame model details to share. He was signed as a catcher by the Tigers out of high school but only ever appeared in the minor leagues. Regarding voter biases, Ted Simmons served as the general manager of the Pirates for parts of the 1992 and 1993 seasons, but ultimately resigned after suffering a heart attack. Leyland managed against Joe Torre when he was the Cardinals skipper in the 1990s and both teams were in the NL East. He also managed against the Braves in the 1991 and 1992 NLCS, when Tom Glavine was with Atlanta. His NL East matchups against the Braves would have also touched Chipper Jones in 1995 and 1996. He faced off against Jim Thome in the AL Central for portions of 2006-2011 when Thome was with the White Sox, Twins, and Indians. Verdict: Relative to the other managerial candidates, Leyland's case is at least slightly hurt due to never being a player. Leyland had a lengthy career that included winning a good number of games and making it as a semifinalist several times. However, his winning percentage and proportion of winning seasons are not as impressive compared to other Hall of Fame skippers and his ultimate lack of postseason success also raises a slight flag. Part of his poor seasons are due to ownership getting rid of players after periods of success (fire sales), such as in 1998 with the Marlins and the Pirates after 1992. Overall I would not be opposed to Leyland being inducted but think that there are 3 other people on the ballot that are more deserving. Cito Gaston Manager Stats on Baseball Reference Player Stats on Baseball Reference Cito Gaston is most well-known for managing the Toronto Blue Jays to consecutive World Series titles in 1992 and 1993. That first team included future Hall of Fame players Roberto Alomar, Dave Winfield, and Jack Morris, as well as notable players in John Olerud, Dave Stieb, Devon White, Joe Carter, Tom Henke, Mark Eichhorn, David Cone, and even Jeff Kent. The following season's squad added future Hall of Famers Paul Molitor and Rickey Henderson, as well as the likes of Dave Stewart, Tony Fernandez, and a young Carlos Delgado. That is all to say that those Blue Jays teams were absolutely stacked and there is probably a good number of managers that could have also led them to the same level of success. Outside of those 2 seasons, Gaston's Hall of Fame candidacy is lacking. He only made the playoffs in 2 more of his 12 total managerial seasons. He took over for Jimy Williams during the 1989 season and led the Blue Jays to an ALCS defeat at the hands of the mighty Oakland Athletics. He managed Toronto at the start and end of the 1991 season, where they lost in the ALCS to the eventual World Series champion Minnesota Twins. Gene Tenace served as the team's interim manager while Gaston was out with a herniated disc. Besides the stretch from 1989 to 1993, Gaston's teams were filled with mediocrity. His only other winning season was his last year during his 2nd stint with the Blue Jays, winning 85 games in 2010. Gaston's 894 wins would rank dead last compared to the other Hall of Fame managers. His .516 winning percentage would rank 19th compared to the 22 current Hall of Fame managers. His 2 seasons with 90+ wins and his 7 winning seasons would also rank last. Among contemporary Hall of Fame managers, only Dick Williams and Earl Weaver managed when the Manager of the Year award existed and failed to win one. The award began in 1983 and Weaver's last managerial season was 1986 and Williams' last was 1988; both of them had the bulk of their career's prior to the start of the award. Gaston's 2 World Series would tie him for 10th most among Hall of Fame managers, but besides that he really doesn't have much else going for him. As a player, Gaston was an All-Star in 1970, a season in which he batted .318 and hit 29 home runs. Unfortunately, that level of success did not sustain for most of Gaston's career. He failed to surpass 1,000 hits or 100 home runs and only ended up playing for 11 seasons. His WAR was only -0.8, meaning that Gaston was essentially a replacement-level player for his career. He's not even in the top 500 of primarily center fielders in history. Gaston's Player Value of -98.34 ranks as the 5th worst among the 920 primarily center fielders that I have on file from 1912-2021. Player Value doesn't think he should have been an All-Star, either. The Hall of Fame also does not predict Gaston as a Hall of Famer, giving him a probability of just 6.2%. As per committee members, Gaston played briefly with Torre on the Braves in 1967. He did not manage or have any notable matchups with any of the former Hall of Fame players on the committee. He had a brief overlap in the AL East from 1996-1997 as his first stint with the Blue Jays was ending and Torre's Yankees dynasty was beginning. If the committee instead consisted of the likes of Alomar, Henderson, Molitor, Winfield, and Morris, then Gaston may have a chance... Verdict: I do not think that Gaston deserves to be inducted. He did win the 2 World Series titles, but those rosters were pretty stacked and he failed to show much success in his managerial career otherwise. While his playing career does somewhat give him a boost, it really doesn't move the meter much at all. If manager Gaston from 1992 and 1993 or player Gaston from 1970 was more routinely the case, then he might have found himself in Cooperstown more easily. Executives Bill White Wikipedia Page Player Stats on Baseball Reference Bill White is another unique case in that he also had a near Hall of Fame playing career in addition to his role as the President of the National League from 1989 to 1994. I admit that it is difficult for me to evaluate White's worthiness on the executive front. Per Wikipedia, he was the first black executive to reach such a position, which seems to be an important feat. However, he supposedly was more of a figurehead in the position rather than someone with actual power. White is in fact the penultimate NL president, as the merger of the leagues in 1999 made the position obsolete. The Hall of Fame announcement gives White some credit for the addition of the Rockies and Marlins into the National League, as well as for the merger with the American League. I'm not sure how much of that credit he ultimately deserves, as league expansion may have been a larger scale decision made by the commissioner or all of the owners. As per the merger, that ultimately took place 5 years after White left the role. As a player, White was primarily a first baseman for the St. Louis Cardinals. He appeared in 8 All-Star games, but really only 5 distinct All-Star seasons given that two All-Star games were played each season from 1959 to 1961. Most notably, he won 7 Gold Gloves at first base in his career, which is tied with Vic Power for the 4th most in history. At the time White won his 7th Gold Glove, he was actually tied with Power for the most by a first baseman in history; George Scott, Don Mattingly, and Keith Hernandez would all pass him later. White's WAR of 38.6 ranks 50th among primarily first basemen in history. Looking specifically at the defensive side of WAR, White's Rfield of 57 ranks 21st all-time among fellow first basemen. Instead looking at Player Value, White ranks 34th all-time with a Player Value of 278.49. That's among the 894 players who played most of their games at first base that I have data for from 1912-2021. That puts White in the top 3.8%, perhaps not Hall of Fame level as a player but certainly close. On the defensive side, his Fielding Value of 161.22 ranks 23rd all-time among fellow first basemen. Interestingly, Player Value thinks White should have only been a 4 time All-Star, and that he never should have won a Gold Glove. It does think he should have won a Silver Slugger in 1962 had the award existed. White also won a World Series in 1964 with the Cardinals, the same season that he finished 3rd in NL MVP voting. Recall that White was actually close enough of a Hall of Famer that I already had him in my model's dataset as an example of a non-Hall of Famer. This is because when developing the lists I looked at things like leaders in various statistical categories and accolades at each position, such as Gold Gloves. Another source I relied on was Baseball Egg's all-time rankings at each position. White ranks 42nd according to them. The Hall of Fame model did not predict White as a Hall of Famer, giving him a probability of 10.8%, the most of the 3 former players on the ballot. For some context, last year the model gave Torii Hunter a probability of 10.5%, who received 6.9% of the vote on the 2023 BBWAA ballot. One likely committee member bias could be Bud Selig, who served as the acting MLB Commissioner from 1992 to 1998, overlapping with White's tenure as President of the National League from 1989 to 1994. White also briefly played with Torre and Simmons for the Cardinals during his last season in 1969. Verdict: I think White deserves to be inducted. He had a near Hall of Fame playing career and I think adding his role as President of the NL on top of that pushes him in. I do think other candidates on this ballot have good cases for my 3rd spot here, but ultimately think White is the most deserving of the remaining candidates. Defensive metrics may not be as keen on him as his 7 Gold Gloves suggest, but ultimately I think players should be rewarded for what those awards represent. In this case, Bill White was the best defensive first basemen in the National League for nearly a decade. Hank Peters Wikipedia Page Hank Peters was most notably the general manager of the Baltimore Orioles from 1976 to 1987, during which they won the World Series in 1983 and also won the AL pennant in 1979. Peters obviously played a part in the Orioles success of the team, but that success is also attributable to Hall of Fame manager Earl Weaver and Hall of Fame players Jim Palmer, Eddie Murray, and Cal Ripken Jr. Peters was responsible for obtaining players such as Rick Dempsey, Tippy Martinez, and Scott McGregor that were part of those pennant-winning teams. The Orioles were hardly in shambles prior to Peters' arrival though, having reached the ALCS in 1973 and 1974 and winning 90 games in 1975. He was fired after the decline of the Orioles from 1984 to 1987. The Hall of Fame's announcement article gives Peters some additional credit that he may or may not be entirely worthy of, in my opinion. It suggests that Peters played a large role in the creation of the Oakland Athletics' dynasty in the 1970s, as well as the success of the Cleveland Indians in the 1990s. Peters led the Indians from October 1987 to 1991 and was responsible for the signings of Jim Thome and Manny Ramirez. Thome was selected in the 13th round of the 1989 draft and thus I believe his success was largely more so a case of his own perseverance and determination rather than Peters discovering some diamond-in-the-rough talent. The Indians never had a winning season under Peters' leadership; their true success would come from 1995 to 2001. Albert Belle was drafted in June of 1987 prior to Peters' arrival. Kenny Lofton and Omar Vizquel were both traded to the Indians after Peters' departure. So while Peters may have played a part in developing the Indians period of success, I don't think he was the primary creator and shouldn't be recognized as that being a major accomplishment. As for the Athletics, Peters was in charge of the team's scouting and minor league system in the early 1960s while it was located in Kansas City. He served as general manager for the 1965 season, in which they finished last. Peters obviously had some role in obtaining future stars like Catfish Hunter, Rollie Fingers, Sal Bando, and Gene Tenace, but again most of the teams actual success was experienced after the fact. Additionally, other stars like Reggie Jackson and Vida Blue were drafted after Peters was with the team. As far as committee member bias goes, perhaps Jim Thome has a special place in his heart for the man that played a part in drafting him. Torre's Yankees squads went up against the Indians several times in the playoffs, so maybe he has some respect for the team that Peters helped put together. Verdict: I wouldn't be outraged if Peters were inducted but wouldn't put him on my 3 person ballot. He did have success leading the Orioles, but some of those pieces like Jim Palmer were already in place to keep things going. The Athletics and Indians both experienced success after his association with those teams, and while he does deserve some credit for their future success, there were other important players that were obtained for those winning teams that he played no part in. I don't quite think his connection to the Athletics' and Indians' success is clear-cut enough for induction, nor do I think his period with the Orioles was successful enough to merit induction. I also would rather use the limited number of votes available on worthy managers, rather than executives. Umpires Joe West Wikipedia Page Joe West was an umpire in Major League Baseball from 1976 to 2021. His 43 seasons of umpiring is the most by anyone in history. His 5,460 games umpired is likewise also the most by anyone in history. He umpired 3 All-Star games, 4 Wild Card games, 8 Division Series, 10 League Championship Series, and 6 World Series, as well as the 2009 World Baseball Classic. It is clear that West is special in being the longest serving umpire. He is one of the few umpires I have heard of because of that reason. However, I don't think West has universally been regarded as being a great umpire. Measuring such things is difficult, but recent revelations in pitch tracking data have allowed some people to create tools to do so, such as Umpire Scorecards. You may have seen these on Twitter/X, where they post an image after each game showing how each umpire fared in terms of calling strikes correctly, calling balls correctly, any pivotal missed calls, and the run favorability impact of calls towards each team. Here's the post from the last game of his career, where Joe did a decent job. Here's a post from one of Joe's not-so-good games that I found. Per Umpire Scorecards, which only has umpire grading data for Joe West from 2015-2021, he ranks in just the 11th percentile of Accuracy (90.9% accurate), in just the 5th percentile of Accuracy Above Expected, (1.32% less accurate than expected) and in just the 18th percentile of Consistency (92.8% consistent). While those are not great metrics, I will cut Joe some slack since these were the last 7 seasons of his career when he was ages 63 to 69, probably not the peak period for anyone's eyesight. Verdict: Probably deserving of induction but not someone I would put on my 3 person ballot. I think part of this is how the system is currently set up - managers, umpires, and executives/pioneers are pitted against each other for induction. For people whose main contributions are before 1980, even players are included in the fold! I personally will always prefer to induct worthy players, managers, and even executives before umpires. I think the Hall of Fame should be home to the people that directly impact the game, and that umpires would be better to have a special exhibit such as the Ford C. Frick Award for broadcasters. However, the fact of the matter is that umpires are inducted and West probably deserves it for being the longest tenured umpire. The umpire that previously held this record, Bill Klem, is one of the 10 umpires in Cooperstown. Given the tools we have today like Umpire Scorecards, I wouldn't be opposed to inducting umpires that have statistical evidence at being great at their job. Pat Hoberg, for example, ranks in the 85th percentile of Accuracy (94.1% accurate), the 97th percentile of Accuracy Above Expected (1.53% more accurate than expected), and the 92nd percentile of Consistency (93.9% consistent). He is also famous for having called a perfect game in Game 2 of the 2022 World Series. However, by the time we have enough years of data like this to use for an umpire's entire career, I fear that we may already begin switching to robot umpires and its usage will become moot. Ed Montague Wikipedia Page I had not previously heard of Ed Montague. He was a National League umpire in 1974 and from 1976-1999, and then for both the NL and the AL from 2000-2009. He was the most senior umpire at the time of his retirement and ranked 8th all-time in games umpired with 4,369 (This other Wikipedia source has him listed 13th all-time). Per the Hall of Fame's ballot announcement, he called 4 All-Star games, 4 Wild Card games, 7 Division Series, 7 League Championship Series, and 6 World Series. He is one of only 3 umpires to be the crew chief for a World Series at least 4 times. Since he retired in 2009, we don't have any Umpire Scorecards data to assess him with. Verdict: I'm not sure Montague deserves induction, and I wouldn't put him on my 3 person ballot. He does appear to be towards the top of non-Hall of Fame umpires, but he doesn't stand out from others like Gerry Davis to me to have his induction make sense or be necessary. Again, I'd rather put in a manager than an umpire any day of the week. Conclusion And that's the analysis of our ballot members! As a quick recap, from the 8 person ballot I would vote for:
Stay tuned for my next blog post where I plan to share my annual analysis of the coming year's BBWAA Hall of Fame ballot. The below file has detailed comparisons of the 20 current Hall of Fame managers and the 4 managers on this year's ballot:
The below files show the Hall of Fame model's predictions for the 4 former players on this year's ballot, using both the initial dataset and an updated dataset:
The below file has the detailed code for loading in the data for the Hall of Fame model and running it, as well as some results in the comments:
The below files show the input data for the 4 former players that the Hall of Fame model predicted, as well as the initial and updated datasets that were used to train the model:
SAXX Underwear has announced a statistical sweepstakes of sorts for the 2023 World Series. The contest involves correctly predicting the outcome of a ball-centered formula that they've created, called the Ballgorithm. The Ballgorithm relies on a lot of "ball" events in baseball, such as pitches that are called balls, passed balls, bases on balls (walks), and even 2 ball 0 strike counts. The contest will go on for each game of the 2023 World Series, starting with game 1 this Friday, October 27th. If you are able to correctly predict the Ballgorithm to the .000 decimal place, the advertisement is that you will win free SAXX underwear for life! If you read the fine print, it actually says that the "approximate retail value of 25 years’ worth of SAXX Underwear" is "$9,600 USD". So "for life" may work for some older folks out there, but I personally hope to make it past 49 so I may be running out of underwear during my lifetime. Furthermore, the Terms and Conditions explain that it isn't some constant stream of underwear shipments that you'll be receiving over 25 years, but rather the gift is defined as "(1) gift consisting of one (1) shipment of three hundred (300) Pairs of SAXX Underwear". I'm not sure how effective a pair of underwear is after sitting in a box in your basement for 25 years, but I suppose time will tell. You can enter into the Ballgorithm competition here. You will need to make a separate entry for each game of the World Series, and you must enter before the start of each game. The rules define the Ballgorithm as the "total number of balls thrown, added to the total two balls – no strike counts, multiplied by two, added to the total base on balls multiplied by four, added to the number of passed balls squared. Then divide that number by the total number of pitches thrown". That formula may be difficult to comprehend as text, so here's a more visual example of the Ballgorithm for you to digest:  In the formula above, the variables are defined as:
I've created a Ballgorithm calculator where you can enter in your guesses for the 5 input variables into cells H2-H6, and the resulting Ballgorithm amount will appear in cell H8. With the introduction and formalities aside, let's dig into predicting the Ballgorithm! I will offer a couple ways of determining the result, but there are truly infinite ways that you could set up the data to back up your answer and getting the answer right will largely still be up to our good friend Lady Luck. MLB Regular Season Data One source of data we could use to predict the Ballgorithm is that from the 2023 regular season. Baseball Reference has a "Pitching Pitches" table that shows the total number of pitches and strikes thrown in the regular season, which you can find here. The table shows the values for each team, the MLB totals, and the MLB averages. In 2023, there were a total of 718,247 pitches. The 2023 regular season consists of a total of 2,430 games, calculated as 30 teams playing 162 games each, but each game is played between 2 teams, so (30 * 162) / 2 = 2,430. With the total number of pitches and the total number of games, we can calculate the expected number of pitches per game as:
Rather, we must round each of our 5 input variables to their closest whole numbers that could actually occur in a baseball game. This means that our actual input variable values would be:
Rangers and Diamondbacks Regular Season Data Maybe we want to make a Ballgorithm estimate using the specific teams that we know will be playing in the World Series, the Texas Rangers and the Arizona Diamondbacks. The "Pitching Pitches" table from above also has the total number of pitches thrown from each of these team's regular seasons. The Rangers threw a total of 23,162 pitches, while the Diamondbacks threw a total of 23,584 pitches, making the expected number of pitches per game for these teams as:
However, we must again remember that instances like 6.27 walks can't actually happen in a real game, so we round these expected values to their nearest whole numbers to get the following updated input variable estimations:
MLB Postseason Data The regular season is one thing, but maybe we want to focus on specifically post season games from this season. We can develop a Ballgorithm estimate using data from all games in the 2023 post season thus far. Again using Stathead, you can click here to see the number of pitches thrown in each 2023 postseason game. This table shows each team game, meaning there are rows for both teams in a given game. This table has 72 rows that come from the 36 post season games that have happened so far. Adding up the number of pitches from those 36 games, there have been a total of 10,339 pitches thrown, so we can evaluate the expected number of pitches per game to be:
With each of the 5 input variables estimated, we can plug them into the Ballgorithm to get an expected output of:
However, we must again remember that instances like 287.19 pitches can't actually happen in a real game, so we round these expected values to their nearest whole numbers to get the following updated input variable estimations:
Rangers and Diamondbacks Postseason Data The last example I will go over is looking at the two teams set to play in the World Series, but only their specific post season performance. Both the Rangers and the Diamondbacks have played in 12 post season games so far. We can use Stathead to see their totals from each post season game, which you can find here. Adding these amount for all of their post season games, we get that the Rangers have thrown 1,687 pitches and 1,076 strikes, meaning 1,687 - 1,076 = 611 balls. They've also issued 38 total walks. Using this info we can obtain the following expected values per game:
However, we must again remember that instances like 100.17 balls can't actually happen in a real game, so we round these expected values to their nearest whole numbers to get the following updated input variable estimations:
Conclusion I've gone over 4 of the numerous different ways that you could come up with an estimate of the Ballgorithm. As I've tried to hint at, there really isn't one "right" answer and getting the value correct will largely be due to luck. However, you can give yourself a chance by at least selecting input values that are in the range of what is most likely to occur. Before I summarize the 4 methods I've shared above, let's take a quick look at the spread of the different input values. First up is passed balls. The expected value was basically around 0.10 across the board, so you really have to bank on 0, or maybe 1, passed balls occurring in the game. I queried some 2022 regular season data from Retrosheet and didn't find any games with more than 2 passed balls, and even those were rare instances. Next up is 2-0 counts. The expected value was around 1.5 to 1.8, so we can lean on there being 1 or 2 such plate appearances in the game. Looking at the Retrosheet data from the 2022 regular season, the fewest 2-0 counts in a game was 0 and the most was 8. I also used that data to create the following histogram of 2-0 counts by game from the 2022 regular season:  This is a right-skewed distribution and we can see that it is most likely that there will be 1 or 2 plate appearances with a 2-0 count in a game, though the broader range of 0-3 is still decently plausible. Next up are walks. The expected values are around 6.2 to 6.8, so our most likely range is assuming 6 or 7 walks in the game. From the 2022 regular season data from Retrosheet, the game with the least walks had 0 and the game with the most walks had 17. We can see that this range was true for 2023 as well by using Stathead, which you can view here. The most walks that the Rangers allowed in a game this season was 10 and the most that the Diamondbacks allowed was 9. Here's a histogram from the 2022 Retrosheet data of the walks per game:  Perhaps not my best formatting work, but we can roughly make out that the 4-7 walks range is the hot spot, but extending that to 3-8 or even 2-10 isn't too unreasonable. Last up are pitches and balls. I wasn't able to use the 2022 Retrosheet data as well for these because that datasheet is play-by-play data rather than pitch-by-pitch data, and I was having trouble reconciling the total pitch and ball counts from 2022 to their actual amounts as listed on Baseball Reference or Baseball Savant. Our expected range of balls is from around 100 to 107, and my attempts at a histogram suggest that the 90 to 110 range is most reasonable. Our expected range of pitches is from around 277 to 297, and my attempts at a histogram suggest that the 275 to 315 range is reasonable. So we've gone over Ballgorithm and the different ways we can use prior data to estimate the values. We can split the data a million ways to come up with a possible answer, but ultimately it's going to be up to luck. However, we can look at historical ranges to make an educated guess. I recommend you pick a value from my suggested ranges and then use my Ballgorithm calculator to determine the amount that you should enter into the competition for each game of the World Series. Here is a final summary of the estimates under the 4 approaches I've shared, as well as what I personally plan to use for my first entry:
Banking on 0 passed balls is probably the safest bet we will have out of any of these. The counts being between 1 and 2 seems fairly certain, but which of those is pretty up for grabs, since our actual estimate was pretty close to 1.5. The 2022 distribution was skewed right, bringing the mean/average up, so I'm going with the median as my measure for the "typical" game. I do think that post season baseball is privy to fewer pitches and balls since there are less blowouts and overall better teams. I'm sticking with the average for the number of walks. Thank you for reading and hopefully someone out there gets to experience a fantastic feeling of 300 new pairs of underwear! Also, see below if you are interested in my *very messy* Excel workbook
World Series Game 1 Update:
Eno Sarris is serving as the baseball stats expert spokesperson for the SAXX Ballgorithm competition. For Game 1, he predicted a value of 0.521, which you can view on Twitter/X here. Admittedly, Eno was much closer than I was. Combining the totals from the Rangers and Diamondbacks, the Game 1 input values and resulting Ballgorithm amount was:
World Series Game 2 Update: Eno Sarris shared the outcome of the Ballgorithm for Game 1 was 0.530, which is slightly different from the 0.525 that I had computed, so there is some disconnect into how these events are recorded by SAXX/Eno vs how Baseball Reference records them. My guess is that it is the 2-0 counts, since I get .530 if I change that amount from 1 to 2. I think Stathead only shows the 2-0 counts as the plate appearances that ended with that count, while SAXX/Eno may be using whenever that count appears, such as on a 4 pitch walk. With this in mind, we probably need to shift our guesses for the # of 2-0 counts up. Eno shared on Twitter/X that his prediction for Game 2 was 0.525, which you can view here. The actual input amounts and resulting Ballgorithm, per Baseball Reference, were:
World Series Game 3 Update: Eno shared that the actual Ballgorithm for Game 2 was 0.455, and that his prediction for Game 3 was 0.510, which you can view here. Again, this appears to be from Stathead only showing the PAs that end in a 2-0 count, rather than the all PAs where a 2-0 count occurred at some point. Here are actual input amounts and resulting Ballgorithm for Game 3 (to the best of my ability), per Baseball Reference:
World Series Game 4 Update: Eno shared that the actual Ballgorithm for Game 4 was 0.484, and that someone actually predicted it correctly, which you can view here. Unfortunately, I was late updating this again and didn't get my guess in for Game 6 in time. Hopefully the Dbacks win to force a Game 6 and allow me another guess. I've updated the Ballgorithm Calculator with the stats from Game 4, which you can view here on Baseball Reference as well. There 318 pitches, 117 balls, 0 passed balls, and 5 walks. There were 3 for sure 2-0 counts per Stathead, as there were 3 plate appearances that ended with a 2-0 count or a 3-0 count (which would have had to have been 2-0 before). This is actually the first game where I haven't been able to back into the actual number of 2-0 counts, given Eno's answer. When I use 8, I get .481, but when I use 9, I get .487. I'm not sure how Eno got to .484. For Game 5, Eno guessed a .505. Again, it was too late for me to enter my guess, but if I had to still pick one I guess I would go with .503. (I am publishing this at 9:21 PM Central time on 11/1/2023, for the record) Voting closed on 12/31/2022 for the 2023 BBWAA Hall of Fame ballot, so we are in the period of eagerly awaiting the announcement of the results on 1/24/2023. In this post I will break down the players on the 2023 Hall of Fame ballot in 3 different ways, as applicable:
For those of you that are new and unfamiliar with my Hall of Fame predictive model and my Player Value metric, I will give a brief overview of them here. If you're already aware of these or don't care about the details as much, feel free to skip ahead to the specific sections for each player instead. Note that the the predictive model can be applied in two ways:
From a predictive analytics standpoint, the initial model is more accurate. The dataset's variables were trimmed down based on their correlation with other variables and their Hall of Fame predictability, based on the data in the initial dataset. The range of values used to tune the model's parameters to their optimal values was also based upon the initial model and dataset. The initial model had an AUC of .9817. AUC stands for Area Under the Curve and is essentially just a measure of accuracy for classification models. That's what we have here, because we are classifying players as either Hall of Famers or not Hall of Famers. A 'perfect' model would have an AUC of 1, while a random guess, coin flip model would have an AUC of 0.5. The fact that the initial model's AUC is so close to 1 is a testament to its quality. From a historical and baseball standpoint, you might think of the updated model as more accurate. It is the model whose training dataset is up to date, after all. It is aware of the Hall of Fame results from last year and December, and the induction of those players should logically have an impact in its decisions of which players to approve this year. However, this updated model has a lower AUC of .9425. When I used the model to predict the players on the 2023 Era Committee ballot, updating it with the 2022 results made it worse, giving it an AUC of .9286. This means that telling the model that Oliva, Minoso, Hodges, and technically Ortiz were Hall of Famers made it worse. However, as we can see here via the since improvement in AUC, telling the model that McGriff was a Hall of Famer made it better. The model uses 5 classes of predictors:
Lastly, remember that the final model is an ensemble of 4 different submodels. So while the overall model may not predict a player as a Hall of Famer, specific submodels might. This ensemble technique results in a final model that is more accurate than any of the individual submodels. You can read about my initial creation of my Player Value metric here, as well as an important addendum here. Note however that I've been doing further research into my Player Value weights using play by play data from Retrosheet, so the ones I used in this post are slightly updated, as detailed below: Run value weights for the relevant pitching events: non-Home Run Hit: -.43 runs Home Run: -1.29 runs Unintentional Walk: -.21 runs Intentional Walk: -.05 runs Hit By Pitch: -.23 runs Sacrifice Bunt: .12 runs Sacrifice Fly: .05 runs Strikeout: .33 runs Groundball Double Play: .70 runs Other Out: .30 runs Wild Pitch: -.27 runs Balk: -.26 runs Run value weights for the relevant defensive events: Putout by a non catcher or first baseman: .30 runs Unassisted Putout by a first baseman: .30 runs Non-strikeout Putout by a catcher: .30 runs Assisted Putout by a first baseman: .2*.30 = .06 runs Strikeout Putout by a catcher: .33*.30 = .099 runs Assist: .8*.30 = .24 runs Error: -.38 runs Double Play: .11 runs Passed Ball: -.26 runs Stolen Base allowed by catcher: -.18 runs Caught Stealing by catcher: .37 runs Run value weights for the relevant offensive events: Single: .35 runs Double: .64 runs Triple: .92 runs Home Run: 1.29 runs Unintentional Walk: .21 runs Intentional Walk: .05 runs Hit By Pitch: .23 runs Sacrifice Bunt: -.12 runs Sacrifice Fly: -.05 runs Strikeout: -.33 runs Groundball Double Play: -.70 runs Other Out: -.30 runs These weights are not pulled out of thin air, but rather mathematically determined based on the historical effect that each event has on a player's probability of scoring. For hitting, this is not that dissimilar from wOBA, although I emphasis scoring probability rather than run expectancy, I utilize more baseball events in the calculation, and I use a constant weight over time based on all available data rather than a weight that changes each year based on each year's data. Overall, Player Value is basically my version of WAR that I think is simpler and more logical in its application over time. The main differences are that I don't convert runs to wins, I use the 25th percentile as the baseline rather than a theoretical replacement level, and I compare players to their position in all aspects of the game, rather than comparing them by position defensively but to the league overall offensively. Because of this, there is no need for a positional adjustment. Lastly, I compute players fielding, baserunning, and pitching components much more similar to how I compute their batting components. The other components of WAR vary greatly in how they are calculated compared to the batting component of WAR. Baseball Reference currently has listed that there have been 22,860 players in MLB history. There are currently 269 former players in the Hall of Fame. Both of these totals include players that played in the Negro Leagues. This means that just the top 1.18% of players get inducted into the Hall. This will serve as our baseline for whether a player should be a Hall of Famer according to Player Value. For position players, I will be comparing players during the span when the AL had a DH and the NL did not, from 1973-2021. There were 4,737 such position players during this span, so position players must rank in the top 57 to be worthy of the Hall. For pitchers, I'll go ahead and use that same span. From 1973-2021, there were 5,248 pitchers, so pitchers must rank in the top 62 to be worthy of the Hall. Carlos Beltran, CF (1998-2017) I've stated this before, but I think reaching 3,000 hits or 500 home runs automatically qualify a position player for Hall of Fame induction, unless they obviously used steroids. Beltran did not achieve either of these, but he came close for both, amassing 2,725 hits and 434 homers in his career. Among primarily centerfielders, that's good for the 9th most hits all-time, behind 5 Hall of Famers, and the 5th most homers all-time, behind 4 Hall of Famers. Using Stathead, we can see that across all positions, just 22 players in MLB history have reached at least 2,700 hits and 400 home runs. Of those 22, just 7 are currently not in the Hall of Fame. Two of those 7 used steroids and have been voted off the ballot (Bonds and Palmeiro), 1 used steroids and is still on the ballot (A-Rod), 3 have yet to appear on the ballot and are virtual Hall of Fame locks (Pujols, Cabrera, Beltre), and the last is Beltran. Given that Beltran didn't use steroids, I don't think I need to say much more, at least on the basis of his numbers alone. Nonetheless, I'll discuss his numbers a little more. Beltran's career WAR of 70.1 is the 8th most all-time among primarily centerfielders, behind 7 Hall of Famers and the currently active great of Mike Trout. If we look at his JAWS of 57.3, which considers both his 7-year peak WAR and his career WAR, he falls a spot to 9th, but the guy that passed him is another Hall of Famer in Duke Snider. Beltran's 1,587 RBI ranks him 5th among CF, behind 4 HoFers. His 1,582 runs scored ranks him 10th among CF, behind 6 HoFers. While his 312 career stolen bases may not seem excessively impressive to you (just 45th all-time among CF), he amassed that many while only being caught stealing 49 times. Every CF with more steals than him was caught stealing more times. Beltran was truly an excellent base stealer. He has the 4th highest career stolen base percentage of all-time across all positions, according to Baseball Reference's leaderboard qualifications. And he stole more bases than the 3 guys ahead of him on that list combined. In terms of accolades, Beltran was a 9 time All-Star, tied for the 7th most among CF behind 5 HoFers and Trout. He also won 3 Gold Gloves, 2 Silver Sluggers, and was the 1999 Rookie of the Year. He never won an MVP, but finished in the top 10 in voting twice. Beltran was also a member of the 2017 Word Series champion Houston Astros, which is the only slight source of reason to exclude him from Cooperstown. The Astros that season were of course caught up in a sign-stealing scandal that resulted in the suspensions of their GM and manager for the 2020 season (both of whom got fired), a $5 million fine, and the loss of their 1st and 2nd round draft picks in 2020 and 2021. The bench coach was determined to be the mastermind of the operation, and was suspensed for the 2020 postseason (although he also was fired, but then rehired). Beltran was also named in MLB's report, which prevented him from being the Mets' manager in 2019. I obviously do not support the Astros' actions in 2017 but do not think they are enough to exclude Beltran from Cooperstown. The punishments that the MLB dealt out were not extreme enough to me to justify a Hall of Fame exclusion. Pete Rose isn't in the Hall because he was literally banned from baseball by the commissioner. None of the Astros' players were banned, suspended, or even fined. We aren't talking about the 1919 Black Sox here. The Astros' title remains with them. And the sign-stealing doesn't appear to really be the reason why the Astros were good, either. The Astros have been a dynasty for a while now, even after the scandal has come to the public eye, winning the AL pennant in 2019 and 2021 and the World Series again this past year. They won their division in 2018 and made it to the ALCS in 2020. Beltran was in his final season and had a negative WAR in 2017, so he certainly didn't personally benefit on the field that much. Beltran, albeit a seasoned veteran, was still just a player on the team, not the ultimate leader of the team. Brian McCann supposedly asked him to stop. The hitting coach claims Beltran was a leader of the operation, while Carlos Correa claims he wasn't. I digress. I just don't think the scandal had a big enough impact on Beltran's career or the quality of the Astros as a team to merit it as a reason from preventing him getting into Cooperstown. The initial version of the Hall of Fame predictive model predicts Beltran as a Hall of Famer, giving him a 72.73% probability of being a Hall of Famer. Given that the voting approval rate is 75% though, one might believe that Beltran won't be good enough. Of course, the model isn't aware of his ties to the 2017 sign stealing scandal, so it will overpredict his probability in light of that lack of information. Some voters are certaintly docking him for his involvement. All 4 of the submodels give Beltran a greater than 50% probability of being a Hall of Famer. The updated version of the Hall of Fame predictive model also predicts Beltran as a Hall of Famer, giving him a 81.65% probability of being a Hall of Famer. This shoots him up over the 75% line, but recall that the updated model is less accurate. All 4 of the submodels give Beltran a greater than 50% probability of being a Hall of Famer. Beltran's total Player Value of 416.4 ranks 38th among position players from 1973-2021, above Darrell Evans and below Willie Randolph (perhaps two highly underrated players, as neither is in the Hall). With 4737 position players during that span, Beltran is among the top 0.80% of players, good enough to merit induction. His Batting Value of 284.8 ranks 41st, above Ellis Burks and behind Andrew McCutchen. His Fielding Value of 108.7 ranks 197th, above Mike Lowell and behind Mike Benjamin. His Baserunning Value of 23.0 also ranks 21st, above Barry Bonds and below Ron Leflore. So all you crazy Bonds fans out there that like to hype him being the only 400+ homer and 400+ stolen base guy in history, note that Beltran also had 400+ homers and his base stealing was more impressive when you consider his position and how many times he was caught stealing. Beltran had a 60+ Player Value season in 2006 when he finished 4th for the NL MVP and posted his highest WAR season of 8.2, as well as three other 50+ Player Value seasons and two other 40+ Player Value seasons. My opinion: Hall of Famer Predictive model: Hall of Famer Player Value: Hall of Famer Andruw Jones, CF (1996-2012) Jones is in his 6th year on the ballot, and I already advocated for his induction last year. He doesn't meet the 500 homer mark, but he's close with 434. That puts him just 1 home run behind Beltran for 6th most all-time among centerfielders, with 4 Hall of Famers ahead of them in Mays, Griffey Jr., Mantle, and Dawson. The rest of Jones' traditional counting stats don't stack up as well among CF given his shortened career that ended at age 35. His WAR of 62.7 ranks 14th among CF, behind 10 Hall of Famers, Trout, Beltran, and Kenny Lofton. I like all of those guys for the Hall. His JAWS of 54.6 ranks even better at 11th among CF, behind 7 Hall of Famers and the aforementioned 3 players. What really puts Jones over the top is his stellar fielding. His 10 Gold Gloves are tied for the 3rd most among outfielders with Ichiro, Al Kaline, and Ken Griffey Jr. Two of these dudes are Hall of Famers, and the other one surely will be once he reaches the ballot in 2025. The two outfielders with more Gold Gloves are Hall of Famers Roberto Clemente and Willie Mays with 12 each. WAR agrees with Jones' fielding ability as well. His Rfield of 235 is the 4th most all-time across all positions, and the most all-time among outfielders. If basically every centerfielder with as many HRs or as many Gold Gloves as Jones is in the Hall of Fame, shouldn't Jones be as well? Not to mention him rating as the greatest defensive outfielder ever, according to WAR... Jones had a domestic violence incident in 2012. Voters have used such incidents as reasons not to vote for Omar Vizquel and Francisco Rodriguez, but have been seemingly ignoring Jones', given his much higher percentage of votes received. The initial Hall of Fame predictive model does not predict Jones as a Hall of Famer, giving him a probability of just 25.01%. However, one of the four initial submodels does predict Jones as a Hall of Famer. That was the least accurate of the initial submodels though, with an AUC of .9493. The updated Hall of Fame predictive model also does not predict Jones as a Hall of Famer, giving him a probability of just 10.32%. Now, none of the four updated submodels predict Jones as a Hall of Famer. For his career, Jones had a total Player Value of 334.9, which ranks 65th among position players from 1973-2021. I have 4737 players on record for that span, meaning Jones is in the top 1.37% during the period, just slightly off Hall of Fame pace. He sits above non-Hall of Famer Buddy Bell and below Hall of Famer Tim Raines. His Batting Value of 177.9 ranks 112th, ahead of Pedro Guerrero but behind Jose Altuve. His Fielding Value of 157.8 ranks 83rd, above defensive great Mark Belanger but behind Robby Thompson (note that Belanger's first season was in 1965, so part of his value is cut off here). Jones had four impressive 40+ Player Value seasons and another 39 Player Value season. In 2005 when he finished 2nd in the NL MVP voting, his Player Value of 44.0 ranks just 9th in the NL. In 2000 when he posted his highest WAR season of 8.2 and finish 8th in the NL MVP voting, his Player Value of 47.2 (also his highest season) ranks just 10th in the NL. My opinion: Hall of Famer Predictive model: Not a Hall of Famer Player Value: Not a Hall of Famer Jeff Kent, 2B (1992-2008) Kent is in his 10th and final year on the ballot, and he was on my hypothetical ballot last year as well. His 377 home runs are the most by a second baseman in history. Cano is active (and used steroids) and ranks 2nd with 335, while players 3-6 are all in Cooperstown. The all-time catcher HR leader is Mike Piazza with 427, who is in the Hall of Fame. The all-time first base HR leader is Albert Pujols with 703, who will surely be in the Hall, and Hall of Famer Jim Thome is 2nd with 612. The all-time third base HR leader is Mike Schmidt with 548, who is in the Hall. The all-time shortstop HR leader is A-Rod with 696, who would surely be in the Hall if not for steroids, and technically still has a chance as he's still on the ballot. Hall of Famer Ernie Banks is 2nd with 512. The all-time left field HR leader is Bonds with 762, who would surely be in the Hall if not for steroids. The same is true for 2nd place Manny Ramirez at 555, who still has a shot since he's still on the ballot. Hall of Famer Ted Williams is 3rd with 521. The all-time center field HR leader is Hall of Famer Willie Mays with 660. The all-time right field HR leader is Hall of Famer Hank Aaron with 755. Every single positional HR leader that did not use steroids is in the Hall of Fame, besides Jeff Kent. Kent's 1,518 RBI ranks 3rd all-time among second basemen, behind Hall of Famers Nap Lajoie and Rogers Horsnby. His 2,461 hits are 13th all-time among second basemen, behind 10 Hall of Famers, the technically active and steroid using Cano, and the notable compiler Julio Franco (who played until he was 48). Kent's 1,320 runs scored rank 12th all-time among second basemen, behind 10 Hall of Famers and Lou Whitaker, who absolutely should be in Cooperstown. His 560 doubles rank 5th all-time among second basemen, behind 3 Hall of Famers and Cano. You get the picture. Kent was one of the best hitting second basemen ever. Defensively, Kent wasn't stellar, but not enough to jeopardize his candidacy in my opinion. He never won any Gold Gloves, and his Rfield of -42 is the 22nd worst all-time among second basemen. But Hall of Famer Joe Morgan ranks even worse with an Rfield of -48. Morgan won 5 Gold Gloves, so there is some disconnect there. Kent was the 2000 MVP, a 5 time All-Star, and a 4 time Silver Slugger. Just 15 second basemen have won an MVP in history, and 11 of them are in the Hall of Fame. The initial Hall of Fame model does not predict Kent as a Hall of Famer, giving him a probability of 20.54%. None of the four initial submodels predict him as a Hall of Famer. The updated Hall of Fame model also does not predict Kent as a Hall of Famer, giving him a probability of 14.47%. None of the four updated submodels predict him as a Hall of Famer. Kent's total Player Value of 463.8 ranks 28th among position players from 1973-2021, above Hall of Famer Larry Walker and below Hall of Famer Roberto Alomar. With 4737 players in that span, Kent ranks in the top 0.59% of players, clearly good enough for induction. His Batting Value of 324.6 ranks 31st, above Hall of Famer Jeff Bagwell and behind Lance Berkman. His Fielding Value of 148.0 disproves the notion from WAR that he was a poor defender. He ranks 96th, above Jose Molina and behind Jim Edmonds. Kent posted two 50+ Player Value seasons and four 40+ Player Value seasons. My opinion: Hall of Famer Predictive model: Not a Hall of Famer Player Value: Hall of Famer Scott Rolen, 3B (1996-2012) I would have voted for Rolen last year if I had a vote, who is now on his 6th year on the ballot. Rolen is one of the best defensive third basemen in history, as his 8 Gold Gloves rank him 4th all-time among third basemen behind Hall of Famers Brooks Robinson and Mike Schmidt, and the still active Nolan Arenado. WAR agrees too, as his Rfield of 175 ranks 12th all-time across all positions. Defense may be the driver of Rolen's case, but he certainly wasn't Mark Belanger. He hit 316 home runs, amassed 2,077 hits, and his 517 doubles rank 6th all-time among third basemen, behind 4 Hall of Famers and future Hall of Famer Adrian Beltre. His 7 All-Star appearances ties him for 12th all-time among third basemen with Hall of Famers Paul Molitor and Edgar Martinez (who both were also largely DHs), and behind 8 other Hall of Famers. WAR is also high on Rolen, as he ranks 10th among third basemen at 70.1 behind 8 Hall of Famers and Beltre. The same is true for his JAWS of 56.9. Rolen also won a Silver Slugger and was the 1997 Rookie of the Year. It is my opinion that any player that is one of the best defenders at his position in history, and is still a very competent batter, deserves a spot in Cooperstown. That logic applies to both Jones and Rolen. The initial Hall of Fame model does not predict Rolen as a Hall of Famer, giving him a probability of 14.15%. None of the four initial submodels predict him as a Hall of Famer. The updated Hall of Fame model also does not predict Rolen as a Hall of Famer, giving him a probability of 16.96%. None of the four updated submodels predict him as a Hall of Famer. Rolen's total Player Value of 410.0 ranks 40th among position players from 1973-2021, above Mark McGwire and behind Darrell Evans. With 4737 players in this span, that puts Rolen in the top 0.84% of players, good enough for induction. His Batting Value of 216.5 ranks 73rd, above Ron Cey and behind Paul Goldschmidt. His Fielding Value of 192.0 ranks 50th, above Fernando Vina and behind DJ LeMahieu. Rolen had just two 50+ Player Value seasons and one 40+ Player Value season, but four seasons in the middle to upper 30s and another four seasons in the 20s. His best was his 57.4 Player Value season in 2004, when he finished 4th for the NL MVP with a 9.2 WAR, also the highest of his career. My opinion: Hall of Famer Predictive model: Not a Hall of Famer Player Value: Hall of Famer Todd Helton, 1B (1997-2013) Helton is in his 5th year on the ballot, and would've gotten my vote last year. He has decent accolades with 5 All-Star games, 4 Silver Sluggers, and 3 Gold Gloves, but those alone aren't enough to merit his induction. What does are his career stats and his similarities to other current Hall of Famers. Two of the more recent inductions to the Hall were Edgar Martinez and Larry Walker. Let's see how Helton stacks up compared to these two Hall of Famers:
If the top 2 guys are Hall of Famers, why shouldn't Helton be? His rate stats are extremely comparable, not to mention amassing more runs scored, hits, doubles, and RBI. Martinez was primarily a DH, another position that most people think requires less defensive ability (like first base). Walker also played in Colorado for most of his career, so both him and Helton have the infamous "Coors effect". Helton did play his entire career for the Rockies, however, while Walker played just 10 seasons. OPS+ considers park effects and has Helton at 133, meaning he was still 33% above league average for his career after considering the impact of Coors. Among first basemen with at least 9000 plate appearances that ranks 13th, behind 10 Hall of Famers and future Hall of Famers Pujols and Cabrera. Helton's road OPS of .855 would rank 58th all-time among first basemen, and his overall OPS ranks 10th among first basemen behind 8 Hall of Famers and the steroid using Mark McGwire. He ranks 15th in RBI among first basemen behind 11 Hall of Famers, future Hall of Famers Albert Pujols and Miguel Cabrera, and the steroid using Rafael Palmeiro. He ranks 4th in doubles behind recent Hall of Famer David Ortiz, and then again Pujols and Cabrera. He ranks 7th in OBP among first basemen, behind 5 Hall of Famers. If Coors was such a thing for Helton, we'd be complaining about his larger HR totals. Homers aren't nearly the crux of Helton's Hall of Fame argument. A bigger part is his ability to walk and get on base, something that parks have no impact on. He ranks 12th all-time among first basemen with 1,335, behind 7 Hall of Famers, future Hall of Famer Pujols (and maybe Votto), and steroid users Palmeiro and Jason Giambi. Helton's career OBP ranks 29th all-time across all positions, behind 21 Hall of Famers, the active Mike Trout, steroid using Barry Bonds, the banned Shoeless Joe Jackson, and a few earlier generation players that had far less plate appearances than Helton. According to WAR, Helton was also one of the best defensive first basemen of all-time. His Rfield of 76 ranks 8th among players that spent at least 50% of their time at first. His WAR of 61.8 ranks 17th among first basemen, behind 11 Hall of Famers, future HoFers Pujols and Cabrera, the active Joey Votto, and the steroid users of McGwire and Palmeiro. His JAWS of 54.2 bumps him up to 15th, putting him ahead of Eddie Murray and McGwire. And for all you Reds fans out there, Helton getting inducted would just be another step in the right direction for a player like Joey Votto having a shot at induction. His career numbers will likely end up very similar to the 3 mentioned above. The initial Hall of Fame model predicts Helton as a Hall of Famer, giving him a solid probability of 72.89%. However, that would still be below the 75% approval rating needed to actually be inducted. All four of the initial submodels give Helton a greater than 50% probability of being a Hall of Famer. The updated Hall of Fame model also predicts Helton as a Hall of Famer, giving him a probability of 54.15%. While this is enough for Helton to be a "yes" to the model, it's now even further beneath the 75% voter approval required. Notably, now only two of the updated submodels give Helton a greater than 50% probability of being a Hall of Famer. Helton is simply put a Player Value darling. His WAR of 61.8 is impressive and somewhat highlights his greatness more so than his accolades or counting stats might, but his Player Value of 698.5 is even more impressive. Since the introduction of the DH in the AL in 1973 and up through 2021, that Player Value ranks him 5th among all players, behind Barry Bonds (1095.4), Alex Rodriguez (820.4), Mike Schmidt (787.9), and Rickey Henderson (767.4). Yes, you read that right: according to Player Value, Todd Helton is the best first baseman and the 5th best player overall since 1973. By comparison, Helton's WAR is only the 53rd best since 1973, and interestingly enough the top 4 WAR guys are also the top 4 Player Value guys. Helton sits above Ozzie Smith, who has 648.0 total Player Value. He truly was a tremendous fielder for a first baseman, as his Fielding Value of 328.6 ranks 3rd among all players in that span, behind Ozzie Smith (470.7) and Henderson (328.8), and above Frank White (328.6). He also was a solid hitter, as his Batting Value of 375.5 ranks 20th across all players during that span, sitting just above Albert Pujols (though probably behind him now, given Pujols' 2022 season). All batters ahead of him are either Hall of Famers, steroid users, or Mike Trout. With 4737 total position players during this 1973-2021 span, Helton's total Player Value ranks him in the top 0.1% during this period, clearly worthy of induction. And even if you decide you hate my Player Value metric and want to rely on WAR instead, he'd still be in the top 1.12% during that span. Helton posted an 80+ Player Value season in 2003, three other 70+ Player Value seasons, three other 50+ Player Value seasons, and a 39 Player Value season. In 2003 he finished 7th in the NL MVP, but based on Player Value he should have won it. In 2000 he finished 5th in the NL MVP, but also should have won it based on his Player Value of 76.2. We might think of Helton differently had he won two MVPs... My opinion: Hall of Famer Predictive model: Hall of Famer Player Value: Hall of Famer Omar Vizquel, SS (1989-2012) Vizquel is in his 6th year on the ballot and would have had my vote last year as well. He didn't reach the magical 3,000 hit mark, but was close with 2,877 hits. That's good for the 44th most all-time across all positions, and the 6th most all-time among shortstops. In terms of just SS, he's behind 4 Hall of Famers and the steroid using Alex Rodriguez. Across all positions, he's behind the gambling and banned-from-baseball Pete Rose, steroid users A-Rod, Palmeiro, and Bonds, future Hall of Famers Pujols, Cabrera, Beltre, and Suzuki, and 35 Hall of Famers. Yep, that's right - Vizquel has the most hits of any player that's been on a ballot, didn't use steroids, isn't literally banned from the sport, and hasn't been inducted. He did play 24 seasons until he was 45 years old, so he certainly had ample opportunity to compile those hits. But that's kind of just how hits occur. Of the 43 players with more hits than Vizquel, 21 of them have more plate appearances than him. But career hits aren't all that Vizquel has going for him. He was also one of the best defensive shortstops ever. He won a whopping 11 Gold Gloves, the 2nd most by a shortstop in history, and tied for the 8th most across all positions. These aren't Jeter-esque undeserving Gold Gloves, either. Vizquel's Rfield of 129 is the 55th highest in history across all positions. But Vizquel was also a shortstop, which many people believe to be the most critical position to have a good defender at. Baseball Reference's dWAR considers a player's Rfield along with WAR's positional adjustment to account for this. Vizquel's dWAR of 29.5 is the 9th most all-time across all positions, and the 7th most all-time among shortstops. Vizquel was just a 3 time All-Star, but his 1,445 runs scored rank 9th all-time among shortstops, behind 5 Hall of Famers, the steroid using A-Rod, and two archaic players in Bill Dahlen and Herman Long. According to Baseball Reference's qualifications, Vizquel is the all-time career leader in fielding percentage among shortstops, and only a single shortstop (Jeter) has played more innings in the field than him. He also has the 5th highest Total Zone Runs in history among shortstops, behind 3 Hall of Famers and the defensive great Mark Belanger. Belanger won 8 Gold Gloves and has been excluded from Cooperstown due to his lackluster hitting ability, batting a dismal .228 for his career with just 1,316 hits in an 18 year career. I find Vizquel to be much more comparable to Hall of Famer Ozzie Smith than to the defensively concentrated Belanger. Vizquel started off hot in his first year on the ballot in 2018, securing 37% of the vote. He got up to 52.6% in 2020. Since then, he's seen a decline each year despite not many more extremely qualified players showing up on the ballot, receiving just 22.9% in 2022. What happened? Many voters have been using the character clause on Vizquel. It was reported during the ballot season in 2020 that Vizquel had domestically abused his wife in 2011 and 2016. In 2021, he was named in a sexual harassment case against an autistic batboy for the AA Birmingham Barons. I find both of these actions deplorable and do not support them in any way. They are blatantly obvious wrongdoings. But in the end I feel that the makeup of the baseball Hall of Fame should be the best baseball players in history, not the players that were good but also happened to be good guys as well. While moral standards have clearly increased over time, there are surely current Hall of Famers that abused their spouses. We shouldn't celebrate these actions in anyway, and I'm all for a Hall that allows for the criticism of player's character and actions off the field in their exhibits, but in the end I think that only the most extreme of actions should be able to prohibit a player from entering the Hall based on his on the field performance. Other players on the ballot have also had domestic violence incidents but have not faced the same backlash as Vizquel, such as Andruw Jones. The initial Hall of Fame predictive model does not predict Vizquel as a Hall of Famer, giving him a probability of just 21.34%. None of the four initial submodels predict him as a Hall of Famer, although one of them gave him a probability of 43.4%. The updated Hall of Fame predictive model also does not predict Vizquel as a Hall of Famer, giving him a probability of 26.20%. Interestingly, now one of the four updated submodels predicts him as a Hall of Famer, at a probability of 52.17%. This is the most accurate of the updated submodels too, with an AUC of .9195. Vizquel's total Player Value is 285.8, which ranks 91st among position players from 1973-2021. With 4737 position players during this span, Vizquel ranks in the top 1.92%, impressive but outside of the Hall of Fame cutoff point. He sits just above Curtis Granderson and just behind Hall of Famer Jim Rice. His Batting Value of 3.43 ranks a poor 778th, above Doug Rader (who debuted in 1966 and thus has some of his value cut off) and behind the still active Daulton Varsho. This echoes the sentiments of WAR that despite Vizquel's nearly 3000 hits, he really wasn't that great of a hitter. He only amassed so many because he played until he was 45, hence why many people think of him as a "compiler". I thought Vizquel's Rbat of -244 was because we were comparing a stellar defensive shortstop to the league average across all positions, but in reality even when compared to the 25th percentile of shortstops, Vizquel's hitting doesn't hold water across his career. However, his Fielding Value of 278.5 ranks a very impressive 6th during that span, above Bobby Grich and behind Brad Ausmus. Was Vizquel's defense enough to overcome his offense? I personally still think yes, but WAR and Player Value disagree. Despite stealing 404 stolen bases, which ranks 72nd all-time, he only had a Baserunning Value of 3.9, ranking 221st during the span. Vizquel posted two 40+ Player Value seasons and one 30+ Player Value season. He had a fair amount of positive batting seasons as well, especially in his prime in the late '90s and early '00s. What hurt him were his early '90s years with the Mariners and his later seasons from 2007-2012. This begs the question: should Omar really be punished for playing from when he was 40-45? Sure it helped his counting stats, but teams chose to put him on the field. If we remove his last 6 seasons, Vizquel puts up a total Player Value of 325.9, with a Fielding Value of 253.7 and now a not as poor Batting Value of 64.8. That would rank him 68th, ahead of Tony Gwynn and behind Albert Belle, and in the top 1.44%. Still not quite at the Hall line, but solid improvement. My opinion: Hall of Famer Predictive model: Not a Hall of Famer Player Value: Not a Hall of Famer Torii Hunter, OF (1997-2015) Hunter is in his 3rd year on the ballot and received just 5.3% of the vote last year, barely enough to cover the 5% needed to remain on the ballot. I did not include him on my 10 person ballot last year (but did place him in my "close" players), as he was blocked by the 10th year candidates of Schilling, Bonds, and Clemens. According to Ryan Thibodaux and friends' Ballot Tracker of publicy released BBWAA ballot, I am far in the minority with my support of Hunter. While we're here, shoutout to Joe Haakenson who voted for 8 of the 9 guys that I would have. He voted for Wagner last year, but dropped him from his vote this year. He also voted for Jimmy Rollins and Bobby Abreu. So, given this unpopular stance, why Hunter? My arguments for Jones, Rolen, and Vizquel have all been their superb defense combined with solid offensive production. Keeping things as simple as career hits, home runs, and Gold Gloves, we have the following:
Jones was power heavy and received 41.4% of the vote last year. Vizquel was contact heavy and received 49.1% of the vote in 2021, until his character came into question and he lost some votes. Rolen was a balance of power and contact (less ABs and a higher career AVG than Jones) and received 63.2% of the vote last year. Hunter was also a balance of power and contact, but received just over 5% last year! Again, 9 Gold Gloves is no small accomplishment. Just 23 players have done that in history across all positions, and just 7 outfielders have reached that many. 15 of those 23 are in the Hall of Fame, 3 are currently on the ballot (Jones, Vizquel, and Hunter), and 2 have yet to appear on a ballot (Yadier Molina and Ichiro Suzuki). All 3 remaining non-Hall of Fame, 9 time Gold Glove winners were first basemen, a position that most people think is less important defensively. Maybe 9 Gold Gloves is too focused of a cutoff. There are 7 outfielders that won 8 Gold Gloves, and only 1 of them is in Cooperstown (Andre Dawson). Surely the 9th Gold Glove isn't that important. Paul Blair and Garry Maddox were excellent defenders, but mediocre with a bat, hence their lack of induction. Alex Gordon technically hasn't been on a ballot yet, but I'm sure he'll receive a similar fate. Barry Bonds is Hall of Fame worthy, but his steroid use is what has kept him out. Jim Edmonds and Dwight Evans are more so in the same boat as Torii Hunter. If you think those guys are Hall worthy, you ought to think that Hunter is too. Hunter played about 2/3 of his total innings at CF and about 1/3 at RF. He ranks 11th among CF in career home runs, behind 6 Hall of Famers, as well as Jones & Beltran. He has many more hits than Edmonds or Dale Murphy. His 498 doubles rank 9th among CF, behind 5 Hall of Famers and Beltran. He has many more home runs than Johnny Damon or Al Oliver. His 1,391 RBI rank 9th among CF, behind 7 Hall of Famers and Beltran. The initial Hall of Fame model does not predict Hunter as a Hall of Famer, giving him a probability of 17.77%. None of the four initial submodels predict him as a Hall of Famer. The updated Hall of Fame model also does not predict Hunter as a Hall of Famer, giving him a probability of just 10.46%. None of the four updated submodels predict him as a Hall of Famer. Hunter's total Player Value of 215.8 ranks 157th out of the 4737 position players from 1973-2021, putting him in the top 3.31% of players, not good enough to make the Cooperstown cutoff. He ranks just above Fernando Vina and just behind Shin-Soo Choo. His Batting Value of 86.3 ranks 262nd, above Jason Varitek and behind Bobby Bonds (who debuted in 1968 and thus has some of his value cut off). Player Value seems to disagree with my thoughts about the quality of Hunter's hitting; he wasn't bad, but he wasn't as good to still merit induction. His Fielding Value of 143.4 ranks 107th, above Yadier Molina and behind Johnny Damon. That's also not quite good enough to support induction. Hunter also had a Baserunning Value of -13.9, as he was particularly hurt for being a CF that lacked the speed and base stealing efficiency of some of his positional counterparts. 195 steals while being caught 99 times isn't nearly the clip needed to hold up with most center fielders. Because of this, he ranks as the 8th worst in Baserunning Value during the span, above Duane Kuiper and behind Harold Reynolds. My opinion: Hall of Famer Predictive model: Not a Hall of Famer Player Value: Not a Hall of Famer Billy Wagner, CP (1995-2010) Wagner is in his 8th year on the ballot, and I would have voted for him last year. Closers have been a tricky thing for Cooperstown to handle, as only 8 players have been inducted. Actual relief pitchers, meaning the setup guys and guys that get you through the middle innings, have virtually no shot at being in the Hall of Fame. I do not think that is a good thing. These are important roles in the sport, and any player that masters his role and performs above all others should have a chance to be inducted. Cooperstown needs more closers. For a long time, saves have been the key traditional statistic to judge closers on. However, there isn't really an established saves threshold that merits induction like there is with 300 wins, 3,000 strikeouts/hits, or 500 home runs. The top 3 career saves leaders are all in the Hall of Fame. Four others have at least 300 saves, a threshold probably too low now given the increase in the use of closing pitchers. Hoyt Willhelm had just 228 and was retiring just as the likes of Rollie Fingers and Goose Gossage were taking off. I think 400 saves could be a good cutoff point, as just 6 pitchers have reached that mark in history, and it helps us avoid inducting some closers that have more of "Hall of Great" energy. With 422 career saves, Wagner ranks 6th in history and would be over my established threshold above. Wagner was also a 7 time All-Star, which ties him with 5 players for the 5th most among closers in history. Of the 4 players ahead of him, 3 are Hall of Famers and Craig Kimbrel is still active. Of the 4 players tied with him, 3 are Hall of Famers and Aroldis Chapman is still active. These two arguments alone - career saves and All-Star games - squarely place Wagner among the Cooperstown calibre closers. Besides the great Mariano Rivera, Wagner's 2.31 career ERA is the highest among qualified closers who aren't still active (and the 3 active guys ahead of Rivera and Wagner have only pitched a fraction of their career innings). The reliever adjusted version of JAWS has Wagner at 24.9, ranking 6th all-time among closers, behind 5 Hall of Famers. People like to discredit relievers for induction because of their lack of innings compared to other starting pitchers. Wagner had a 2.31 ERA in 903 innings pitched. Mark Buehrle had a 3.81 ERA in 3,283 innings pitched. Finding the intersection of quality and quantity can be difficult. I don't think WAR does a great job of capturing this, as even the greatest closer of all-time in Rivera has a lower WAR than Buehrle. The truth is that the later innings in close games are important to victory. Someone needs to go out there and pitch well, and guys that exceed at doing that substantially more than their peers should be represented in the Hall. Wagner's total Player Value of 135.9 ranks 40th among the 5248 pitchers from 1973-2021, putting him in the top 0.76%, good enough for the Hall. He sits above Kevin Appier and behind Brandon Webb, presumably two underrated guys. In reality there just aren't enough pitchers in the Hall, especially during this era. If 1.18% is the going rate for Hall of Fame induction, that rate should hold for both position players and pitchers, since they both fill important and distinct roles. Wagner's Pitching Value of 138.6 ranks 28th, ahead of Jake Peavy and behind C.C. Sabathia. His Fielding Value of 2.13 is low because as a closer he had less chances in the field to be able to stand out defensively over his reliever peers. And since Wagner played in the NL his entire career, his hitting was somewhat of a factor, even as a closer. Wagner had just 21 plate appearances in his career, but he didn't bode too well, even when compared to other NL relief pitchers. He had a Batting Value of -4.85, not too surprising for a guy that went 2/21 for his career with a .243 OPS and a -35 OPS+. Nontheless, Wagner's pitching alone was enough to merit his induction according to Player Value, and his high ranking shows how Player Value can compare relievers more favorably to starters. Using pitcher WAR from 1973-2021, Wagner ranks just 128th. Mariano Rivera ranks 10th in Player Value during this span, and 31st in WAR. Wagner had one 20+ Player Value season in 1999, and another 19.7 Player Value season in 2003. My opinion: Hall of Famer Predictive model: N/A, model doesn't handle pitchers Player Value: Hall of Famer Francisco Rodriguez, CP (2002-2017) K-Rod is in his 1st year on the ballot, and is another closer that I think deserves induction to make up for their current lack of representation in Cooperstown. His 437 career saves are above my 400 saves threshold and rank him 4th all-time, the most of any player not in the Hall of Fame. He is also the single-season record holder for saves, when he recorded 62 in 2008. His 6 All-Star games tie him with 5 others for the 10th most all-time. Of the 9 players with more, 6 are Hall of Famers, one is Wagner, and 2 are active (Kimbrel and Chapman). Of the 5 players he's tied with, 2 are Hall of Famers, and he has more saves, innings pitched, and strikeouts than Joe Nathan or Jonathan Papelbon. Roy Face played when there were 2 All-Star games per year, so he really only had 3 All-Star seasons compared to K-Rod's 6. K-Rod was named the reliever of the year twice, and just 20 closers in history have done so. Of those 20, 6 are in the Hall of Fame and 5 are still active. I don't think K-Rod's case is as strong as Wagner's (who has had to wait at least 8 years), so his case isn't on the forefront of my closer Hall of Fame arguments. His case is also blemished via the character clause, as he also had a domestic violence incident in 2012. Player Value is less high on K-Rod than it was on Wagner. His total Player Value of 72.9 ranks 101st out the 5248 pitchers from 1973-2021, putting him in the top 1.92%, not quite Hall worthy. He sits above Larry Andersen and behind Josh Johnson. His Pitching Value of 64.2 ranks 89th, ahead of the still active Yu Darvish and behind Barry Zito. He had a Fielding Value of 8.8, decent compared to his reliever peers. K-Rod has just 2 plate appearances in his career, so his Batting Value of 0.2 is of no consequence. K-Rod had one 20+ Player Value season in his great 2004 record setting season. My opinion: Hall of Famer Predictive model: N/A, model doesn't handle pitchers Player Value: Not a Hall of Famer Bobby Abreu, RF (1996-2014) Abreu is in his 4th year on the ballot, and while I wouldn't have voted for him last year, he was at least in my group of guys that I thought were close. But I notably have a 9 person ballot this year, so Abreu still doesn't quite do it for me. I would like him to remain on the ballot as long as he can though, to give me as much time to ponder, analyze, review, and be convinced as I need. Next year's ballot has some solid names though, so I'd be surprised if Abreu is able to crack my top 10. For now, the short of it is that Bobby Abreu doesn't come off the tongue as a Hall of Fame player to me. I never thought of him as such as a kid when he was playing, but to be fair his prime years were when I was still quite young. His accolades aren't impressive, as he's just a 2 time All-Star and a single Gold Glove and Silver Slugger winner. WAR relatively likes Abreu, as his 60.2 ranks 19th among rightfielders. That's more than Ichiro and 12 Hall of Famers at RF, including my favorite player Vladimir Guerrero. Ahead of him are 13 Hall of Famers, the steroid using Gary Sheffield, the banned Shoeless Joe Jackson, Dwight Evans, and Reggie Smith. His 2,470 hits rank 22nd among RF, behind 17 Hall of Famers, Ichiro, Sheffield, Rusty Staub, and Dave Parker. His 574 doubles impressively rank 4th among RF, behind 3 Hall of Famers. His power isn't as impressive though, as his 288 home runs rank 39th among RF. His 1,363 RBI rank 21st behind a decent contingency of non-Hall of Famers in Parker, Staub, Evans, and steroid users Sheffield, Sosa, Jose Canseco, and Juan Gonzalez. His 1,476 walks also impressively rank 4th among RF, behind 3 Hall of Famers. While it's surprising that Abreu stole 400 bases, that really isn't nearly enough for it to have significant value compared to the other aspects of the game. WAR rates Abreu as a below average defender across his career, giving him an Rfield of -7. That's not terrible, but clearly defense isn't an argument for Abreu's induction. In the end, Abreu is just an unsexy player, likely the reason for his lack of accolades. While other rightfielders were accumulating hits and blasting home runs, Abreu was getting walked and hitting doubles. I can appreciate and acknowledge that Abreu was a better player than I first perceived, but I'm not quite convinced that he's Cooperstown worthy yet, although it seems to be getting closer and closer each year. The initial model does not predict Abreu as a Hall of Famer, giving him a probability of 34.42%. However, one of the four initial submodels does predict Abreu as a Hall of Famer, the same one that supported Andruw Jones. This was the least accurate of the initial submodels, though, with an AUC of .9493. The updated model also does not predict Abreu as a Hall of Famer, giving him a probability of 17.47%. Now, none of the four updated submodels predict him as a Hall of Famer. Abreu's total Player Value of 266.1 ranks 107th among the 4737 position players from 1973-2021, ahead of Placido Polanco and behind Sammy Sosa. That puts him in the top 2.26%, good but not quite Hall of Fame territory. His Batting Value of 237.5 ranks 65th, ahead of Carlos Delgado but behind Jorge Posada. His Fielding Value of 11.5 is unimpressive and is what really hurts his case. That ranks a dismal 1596th, above the still active Illdemaro Vargas and behind Alex Cole. Abreu was just barely an acceptable fielder throughout his career. However, his Baserunning Value of 17.1 ranks a favorable 39th, ahead of Toby Harrah and behind Carl Crawford. Abreu put up two 50+ Player Value seasons. He did a good job of avoiding bad seasons, but he just didn't have enough really great seasons. My opinion: Not a Hall of Famer Predictive model: Not a Hall of Famer Player Value: Not a Hall of Famer Jimmy Rollins, SS (2000-2016) Rollins is in his 2nd year on the ballot and was in my group of close guys last year. He's a memorable name but a lot of the Phillies players of that time seem to be a collective group of "Hall of Great" guys to me; teammate Ryan Howard has already appeared on and fallen off the ballot. In terms of accolades, Rollins is one of just 14 shortstops to be named MVP. Six of those 14 are in the Hall of Fame and two used steroids (A-Rod and Tejada), but there's still 5 other non-Hall of Famers there. Rollins appeared in just 3 All-Star games, which ranks an unimpressive 49th, but Robin Yount also won an MVP and appeared in 3 All-Star games and is in the Hall of Fame. Rollins' 4 Gold Gloves ties him with four others for the 7th most by a shortstop. Three of the six with more Gold Gloves are in the Hall of Fame, and just one of the four tied with him is in Cooperstown, granted two of those four are still active players (Brandon Crawford and Andrelton Simmons). Rollins also won a Silver Slugger. So I compared Rollins to Yount, but Yount is above the magical 3,000 hit mark with 3,142 hits, while Rollins is below it with just 2,455 hits. That ranks him 14th all-time among shortstops, behind 10 Hall of Famers, steroid using A-Rod, should-be-Hall-of-Famer-if-not-for-character-clause Vizquel, and the archaic Bill Dahlen, who arguably should also be a Hall of Famer. Rollins' 231 home runs ranks him 10th all-time among shortstops, behind 4 Hall of Famers and steroid users A-Rod and Tejada. His 511 doubles ranks 7th all-time among shortstops, behind 5 Hall of Famers and A-Rod. His 470 stolen bases rank 11th all-time among shortstops, behind 5 Hall of Famers. His 1,421 runs scored ranks 10th all-time among shortstops, behind 5 Hall of Famers and A-Rod. However, Rollins' WAR of 47.6 ranks 26th among shortstops and is lower than 20 of the 23 Hall of Fame shortstops. His JAWS of 40.1 ranks 32nd among shortstops. We can parse things to make Rollins standout, as he's the only shortstop in history with at least 2,400 hits, 200 home runs, and 400 stolen bases. But again, those 400 steals don't really add all the value you may think to make a player a Hall of Famer; Rollins wasn't Rickey Henderson. I think Rollins has a decent case, but to me he's just a shining example of what a borderline Hall of Famer looks like. He comes short in the cumulative stats and accolades where other players like A-Rod and Vizquel are more impressive, and his WAR isn't good enough to help him make up that ground. The initial model does not predict Rollins as a Hall of Famer, giving him a probability of 34.62%. However, one of the four initial submodels does predict Rollins as a Hall of Famer. This was also the most accurate of the initial submodels, with an AUC of .9797. The updated model also does not predict Rollins as a Hall of Famer, but gives him a decent probability of 45.22%. Now, two of the four updated submodels predict him as a Hall of Famer. While one of these is the most accurate updated submodel, with an AUC of .9195, the other is the least accurate of the updated submodels, with an AUC of .8879. The two intermediate submodels that don't predict Rollins as a Hall of Famer are more critical of him and are accurate enough to beat out the other two for the final prediction to still be a no. Rollins has a total Player Value of 229.2, which ranks 146th among the 4737 position players from 1973-2021, putting him in the top 3.08%. He sits above Andy Van Slyke and behind Ray Lankford. His Batting Value of 147.6 ranks 144th, above Joe Mauer and behind Mark Teixeira. His Fielding Value of 52.6 ranks just 589th, ahead of Dave Martinez and behind Dave Stapelton. So while Rollins was a pretty solid hitter, it just wasn't quite enough to make up for pretty standard shortstop defensive play. What helps a little is his Baserunning Value of 28.9, which ranks an impressive 13th, above Tony Womnack and behind Julio Cruz. Rollins was clearly above most of his shortstop contemporaries when it came to stealing bases. He put up just one 40+ Player Value season during his career, which was his MVP wining season of 2007. However, he had just the 8th best Player Value in 2007 at 46.5. He was not the best shortstop in the NL, as the MVP should have went to Troy Tulowitzki at 66.9. He also wasn't the best Phillie, as Chase Utley finished with a 64.0 for the 2nd most in the NL. My opinion: Not a Hall of Famer Predictive model: Not a Hall of Famer Player Value: Not a Hall of Famer Mark Buehrle, SP (2000-2015) Buehrle is in his 3rd year on the ballot and received just 5.8% of the votes last year, and I only had him in my list of guys that I thought were close. His accolades are not terribly impressive, as his 5 All-Star games are tied with 22 pitchers for the 53rd most all-time among starters. He never won a Cy Young and only received votes once, when he finished 5th in 2005. However, he is one of only 13 pitchers to win at least 4 Gold Gloves. Of the other 12 though, only 6 are in the Hall of Fame and 2 are still active (Greinke and Keuchel). Greinke and Keuchel also have a Cy Young to their name however, as do 3 of the Hall of Famers (Maddux, Gibson, Palmer), and one of the other non-Hall of Famers in Ron Guidry. Of the other 3 Hall of Famers with at least 4 Gold Gloves, Jim Kaat had a whopping 16 Gold Gloves to go with 283 wins and it still took him until last year to get inducted despite retiring in 1983. Mike Mussina has nearly double the amount as Buehrle with 7 Gold Gloves, as well as 270 wins and 2,813 strikeouts. Phil Niekro had just 5 Gold Gloves, but had 318 wins and 3,342 strikeouts. Buehrle initially seems most similar to non-Hall of Famers Mark Langston and Kenny Rogers. Point being: while rare, 4 Gold Gloves does not a Hall of Fame pitcher make. Buehrle's typical pitcher marks are also not too impressive. Every pitcher with 300 wins or 3,000 strikeouts is in the Hall of Fame unless they haven't been on a ballot yet, used steroids, or are named Curt Schilling and blocked due to writers' use of the character clause. Buehrle falls well short of these automatic thresholds though, with just 214 wins and 1,870 strikeouts. He's tied with Rick Reuschel in wins for 93rd all-time among starters, and ranks just 105th all-time among starters in strikeouts. His career ERA of 3.81 is not very promising either, ranking 377th all-time among qualified starters. Of the 72 primarily starters in the Hall of Fame, just 5 of them have an ERA higher than Buehrle's. Of those 5, 4 of them played around the turn of the 20th century. Jack Morris is a fairly controversial Hall of Fame pitcher, and even he has notably more wins, strikeouts, and innings pitched than Buehrle. I will say that comparing Buehre's career ERA among all pitchers can be flawed because a lot of those (especially active ones) pitchers threw far fewer innings. And that's really the crux of Buehle's case for Cooperstown: durability and innings pitched. But even at surface level, this doesn't seem all that impressive. His 3,283.1 innings pitch still rank just 95th all-time. Of the 94 players with more innings pitched, 86 of them have a lower ERA than Buehrle, while just 10 of them had a higher ERA. So what's the deal? The key idea is that pitchers are not being used like they used to, so Buehrle's production in terms of innings pitched needs to be measured relative to his peers. Since 1980, just 14 pitchers have tossed as many innings as Buehrle. Of those 14, only 7 had a career ERA lower than Buehrle's, and 5 of them are in the Hall of Fame, to go with the steroid using Roger Clemens and likely future Hall of Famer C.C. Sabathia (who has yet to appear on a ballot and reached the 3,000 strikeout mark). Again, there is also Hall of Famer Jack Morris who pitched more innings but had a higher ERA than Buehrle. Andy Pettite also pitched more innings with a higher ERA. This seems to paint a picture of Buehle being the dividing line between quality and quantity, but the 3,283 inning cutoff mark is somewhat restrictive and random. If we expand it to pitchers with 3,000 or more innings pitched since 1980, we see that we get 25 hurlers, 14 of which had lower ERAs than Buehlre. Now also ahead of him are two likely future Hall of Famers in Verlander and Greinke, and the should-be-Hall-of-Famer-if-not-for-character-clause Curt Schilling. But also now ahead of him are notable non-Hall of Famers Kevin Brown, Orel Hershiser, Tim Hudson, and Dennis Martinez. WAR takes into account innings pitched. The more a player pitches at a quality above replacement level, the higher his WAR will be. Buehrle's WAR of 59.1 ranks 69th all-time among starters. Among pitchers since 1980, his WAR ranks 18th. Ahead of him are 7 Hall of Famers, 5 guys yet to be on a ballot, steroid users Clemens and Pettite, and the character clause blocked Schilling. But Kevin Brown and David Cone do notably have higher WARs and are also not in the Hall of Fame. In the end, I think Buehrle's ability to stay healthy and pitch many innings has been impressive, but not impressive enough to merit induction. Until pitchers that pitched more and at a higher level like Schilling, Brown, and Hershiser are in Cooperstown, I can't push Buehrle too much. He's basically the intersection of durable but effective hurlers like Chuck Finley and Charlie Hough and solid defensive pitchers like Mark Langston and Kenny Rogers, but none of these 4 are Hall of Famers and I'm not convinced that some combination of their skills is Cooperstown worthy. Buehrle's total Player Value of 82.3 ranks 85th among the 5248 pitchers from 1973-2021, putting him in the top 1.62%, not quite good enough for the Hall of Fame mark. He sits ahead of Roger McDowell and behind the still active Sonny Gray. His Pitching Value of 12.6 is actually rather unimpressive and ranks just 379th, ahead of Jared Burton and behind Mark Wohlers. Most of Buehrle's value actually comes from his glove, as his Fielding Value of 84.3 ranks a solid 11th, ahead of Jake Westbrook and behind Livan Hernandez. It seems that Buehrle's Gold Gloves were well justified. Buehrle's Batting Value of -14.5 doesn't help him either, ranking as the 176th worst, ahead of Rick Helling but behind Amaury Telemaco (my, what a name!). But hey, Randy Johnson ranks as the 11th worst in Batting Value but still finishes in the top 10 in total Player Value during this span. Buehrle posted two 20+ Player Value seasons in 2001 and 2005. He finished 5th in the AL Cy Young in 2005, but his Pitching Value ranked 4th in the AL and his Player Value ranked 2nd in the AL that year. Buehrle was a solid fielding pitcher throughout his career, and a good pitcher during his prime years, but his poor Pitching Value as he aged is what really does his case in. My opinion: Not a Hall of Famer Predictive model: N/A, model doesn't handle pitchers Player Value: Not a Hall of Famer Andy Pettitte, SP (1995-2013) Pettitte is in his 5th year on the ballot and was a no for me last year despite perhaps being there numbers-wise because of his PED use. Pettitte was named in the Mitchell Report, said to have used PEDs by a former player during a federal raid, and has confessed to his PED use. Though he was never suspended any games, his use of PEDs is cut and dried. Pettite's 256 career wins rank 42nd all-time, behind 34 Hall of Famers. He has more wins than basically 34 Hall of Famers too, so in terms of wins Pettitte is right there among average Hall of Fame starting pitchers. His 2,448 career strikeouts rank 46th all-time, behind 25 Hall of Famers. He has more strikeouts than basically 43 Hall of Famers, so he'd actually be an above average Hall of Fame starter in terms of strikeouts. His 3.85 career ERA is less exciting and currently ranks 386th all-time among qualified starters, and his 3,316 innings pitched rank 90th all-time. Only 7 pitchers have thrown that many innings and had a higher ERA than Pettitte, while 83 pitchers were able to throw that many innings with a lower ERA. Only 1 of the 7 is in the Hall of Fame (Jack Morris), while 47 of the 83 are in the Hall of Fame. The quantity of Pettitte's production and the quality of that production does not seem too impressive at face, but again let's look at things with a generational lens. From 1980 to present, just 12 players have thrown as many innings as Pettitte. 7 of them did so with a lower ERA, and 5 of those are Hall of Famers. The other 2 are likely future Hall of Famer C.C. Sabathia and fellow steroid user Roger Clemens. Again, Morris threw that many innings and had a higher ERA, but he did throw about 150 more innings than Pettitte. This is basically the exact same situation that I laid out for Buehrle; both guys are right at the border of quantity and quality, when compared to other players of their time. Pettitte ranks 24th in strikeouts among starters since 1980, behind 7 Hall of Famers and maybe 5 future Hall of Famers (Sabathia, Verlander, Scherzer, Kershaw, Greinke?). Buehrle ranked 59th. In terms of wins, Pettitte ranks a stellar 7th among starters since 1980, behind 4 Hall of Famers, while Buehrle ranked 18th. So in terms of innings pitched and ERA, Buehrle and Pettitte are basically even, with Buehrle having a slightly lower ERA and Pettitte having slightly more innings pitched. Buehrle was the better fielding pitcher given his 4 Gold Gloves, but Pettitte racked up more wins and strikeouts, probably more important metrics for measuring pitchers for the Hall of Fame. Pettitte's WAR of 34.1 ranks 175th among starters, not too impressive. Pettitte was just a 3 time All-Star, while Buehrle went to 5. Neither ever won a Cy Young, though Pettitte finished in the top 10 five times to Buehrle's one. I'd argue they are both close but not quite there, and especially given Pettitte's steroid use I'm further not inclined to say he should be in. Pettitte's total Player Value of 130.6 ranks 46th among the 5248 pitchers from 1973-2021, putting him in the top 0.88%, good enough for the Hall. He sits ahead of Tom Gordon and behind Hall of Fame closer Trevor Hoffman. His Pitching Value of 100.8 ranks 53rd, ahead of Jimmy Key and behind the still active Kenley Jansen. He adds some solid value with his glove, as his Fielding Value of 38.9 ranks 98th, ahead of Carlos Zambrano and behind Larry Gura. He loses some value with his hitting, with a Batting Value of -9.1. Most of Pettitte's 237 career plate appearances came from his three years in the NL with the Astros from 2004-2006. He had a -10 career OPS+, getting 6 hits in all those plate appearances. Pettitte posted two 30+ Player Value seasons in 1997 and 2005. He finished 5th in Cy Young voting in both of those years, but he actually had the 3rd and 4th highest Pitcher Value in his league in those years, respectively. My opinion: Not a Hall of Famer Predictive model: N/A, model doesn't handle pitchers, and due to steroid use Player Value: Hall of Famer Alex Rodriguez, SS/3B (1994-2016) A-Rod is in year 2 on the ballot and was a no for me last year, and will continue to be a no for me this year, because of his steroid use. I gave Bonds a pass because he was so much better than the rest of the steroid users, which A-Rod kind of is too, but Bonds also was arguably a Hall of Famer before he ever even used steroids. A-Rod has been open to his use of steroids, and I'm happy that he's come to terms with his decisions and admitted them. I respect those that acknowledge their mistakes more so than those that try to cover them up. For some reason others see it the other way around and want to penalize the for-sure suspended players of A-Rod and reward the supposedly "unknown" steroid users like Sammy Sosa. A-Rod first confessed to using steroids from 2001 to 2003 with the Rangers, and at the end of 2000 he had just 189 home runs and 966 hits, so that's not enough for me to think he was already a Hall of Famer before using steroids. He would have had 5 All-Star appearances and 4 Silver Sluggers by 2001, so he was certainly on the right track, but certainly not enough in isolation. Nonetheless, despite his transparency with his use, Rodriguez still juiced up and won't get my support for Cooperstown until the first for-sure steroid user is inducted. Steroids aside, A-Rod is obviously worthy of the Hall of Fame. His 3,115 hits surpass the general threshold of 3,000, rank 5th all-time among shortstops, and rank 22nd all-time across all positions. His 696 career home runs surpass the general threshold of 500, rank 1st all-time among shortstops, and rank 5th all-time across all positions. His 2,086 career RBI also rank 1st all-time among shortstops, and rank 4th all-time across all positions. He clearly was one of the greatest hitters ever, and still was acceptable defensively, having a career Rfield of 23, 18 of which came from his days with the Rangers and Mariners when he was primarily a shortstop, arguably the most difficult defensive position in baseball. A-Rod's WAR of 117.6 ranks 2nd all-time among shortstops, and ranks 12th all-time across all positions (besides pitchers). In terms of accolades, A-Rod's 14 All-Star games are the 3rd most by a shortstop behind Hall of Famers Ozzie Smith and Cal Ripken Jr. His 3 MVPs are the most by a shortstop in history, and he's one of just 11 players with at least 3 MVPs in history. Of those 11, 7 are Hall of Famers, Trout and Pujols haven't been on a ballot yet, and Bonds also used steroids. A-Rod won 10 Silver Sluggers, including 7 as a shortstop, the 3rd most by a shortstop in history. He also won 2 Gold Glove awards. One important thing to note is that while A-Rod is technically more of a shortstop (1,272 innings), he also played 1,194 innings at third base, so the split is nearly 50/50. But given that he's one of the greatest ever, which position we compare him to is of little consequence. Not surprisingly, A-Rod's total Player Value of 820.4 ranks a very impressive 2nd among the 4737 position players from 1973-2021, putting him in the top 0.04% of players, clearly in the Hall of Fame category. Player Value does not do any kind of discounting for players that used steroids. He sits above Mike Schmidt and 4734 others, and the only player ahead of him is Barry Bonds. His Batting Value of 656.0 also ranks 2nd behind Bonds and ahead of Schmidt. His Fielding Value of 140.1 ranks 116th, ahead of Julio Cruz and behind Chris Speier. For all that he could do with a bat, A-Rod was certainly still capable of putting up a solid defense at shortstop. A-Rod's Baserunning Value of 24.3 also ranks an impressive 19th, as he possessed unique speed for someone with such power. He sits ahead of Ron LeFlore and behind Eric Davis. A-Rod has a staggering two 90+ Player Value seasons, an 80+ Player Value season, two 70+ Player Value seasons, three 60+ Player Value seasons, and a 50+ Player Value season. That's nine seasons at a truly elite level, not to mention all of his other quality years. He won 3 actual MVPs in 2003, 2005, and 2007, but his best 3 Player Value seasons were actually in 2000, 2001, and 2002. He had the highest Player Value in 2003 and 2005, but was outpaced by Curtis Granderson in 2007, so 2 of his 3 MVPs were merited. But he also led the AL in Player Value in 1996, 2000, 2001, and 2002, so I count at least 6 MVPs that A-Rod should have won. My opinion: Not a Hall of Famer Predictive model: N/A, due to steroid use Player Value: Hall of Famer Manny Ramirez, OF (1993-2011) Manny is in his 7th year on the ballot and like A-Rod was excluded from my voting list last year, despite his obvious statistical worthiness, due to his steroid usage. He violated MLB's drug policy twice, receiving a 50 game suspension in 2009 and a 100 game suspension in 2011. If you're caught and suspended, there is no speculation about your use, so Manny has a cut and dry case. His 555 homers are above the magical 500 mark and rank 2nd among leftfielders behind only Bonds, ahead of the 21 Hall of Famers at the position. He also ranks 15th all-time in homers across all positions, behind 8 Hall of Famers and future Hall of Famer Albert Pujols, but also behind 5 steroid users in Bonds, A-Rod, Sosa, McGwire, and Palmeiro. His 1,831 RBI rank 4th among leftfielders behind Bonds and Hall of Fame Red Sox players Ted Williams and Yaz. He ranks 20th in RBI across all positions, behind 14 Hall of Famers, 2 future Hall of Famers (Pujols & Cabrera), and 3 steroid users. His 2,574 career hits rank 17th among leftfielders, behind 13 Hall of Famers, Bonds, Pete Rose, and Luis Gonzalez. His 547 career doubles rank 5th among leftfielders, behind Bonds, Rose, Gonzalez, and Yaz. His 1,544 career runs scored rank 12th among leftfielders, behind 9 Hall of Famers, Bonds, and Rose. Manny's career counting stats clearly line him up with other Hall of Famers. On the more advanced side of things, Manny's OPS+ of 154 ranks 5th among leftfielders, behind Hall of Famer Williams, steroid user Bonds, the active Yordan Alvarez, and the archaic Henry Moore (who played in just 1 season in 1884). If we remove the context of run scoring environment and park factors, Manny's raw career OPS of .996 ranks 3rd among leftfielders, behind Williams and Bonds. His WAR of 69.3 ranks 8th among leftfielders, behind 5 Hall of Famers, Bonds, and Rose. Ramirez was a poor defender, however; with a -129 Rfield for his career, he grades as the 7th worst in history according to WAR. If we consider the positional adjustment, Manny's dWAR of -21.7 still ranks as the 7th worst in history. In terms of accolades, Manny never won an MVP but won an impressive 9 Silver Sluggers, 8 as an outfielder and 1 as a DH. Those 8 are the 3rd most by an outfielder, behind Bonds and Mike Trout. It is important to note that this award didn't exist until 1980, so many outfield greats like Williams, Aaron, Mays, Mantle, Ruth, Rose, and more can't really compare. Manny also went to 12 All-Star games, which ranks 6th among leftfielders behind Bonds, Rose, and Hall of Famers Williams, Yaz, and Minnie Minoso (who benefitted from double All-Star seasons in both his Negro League and MLB playing days). So although Manny was a terrible defender, his offense certainly made up for it to make him a very valuable player over his career. However, given his steroid use and the fact that he's not quite the best of the best among the steroid users, I don't support his induction currently. Manny's total Player Value of 445.8 ranks a solid 32nd among the 4737 position players from 1973-2021, putting him in the top 0.68%, good enough for the Hall of Fame mark. He sits above his Indians teammate Jim Thome and behind Jeff Bagwell, both Hall of Famers. His Batting Value of 485.2 ranks an even better 5th, ahead of the still active Mike Trout and behind Hall of Famer Ken Griffey Jr. Manny's Fielding Value of -32.8 ranks as the 45th worst, ahead of Dave Kingman and behind Frank Taveras. The worst player in terms of Fielding Value during the period was Howard Johnson. Manny posted just one 50+ Player Value season and one 40+ Player Value season, but he did have many solid years in the 20-30 range. My opinion: Not a Hall of Famer Predictive model: N/A, due to steroid use Player Value: Hall of Famer Gary Sheffield, OF/3B (1988-2009) Sheffield is in his penultimate year on the ballot and is close to not being initially inducted given that he received just 40.6% of the vote last year. He wouldn't have received my vote last year either, despite his obvious statistical worthiness, due to his use of steroids. Sheffield's case is less similar to A-Rod's and Manny's and more similar to players already voted off of the ballot like Bonds, Sosa, McGwire, and Palmeiro. He was never suspended for steroid use because when he was using them players were not being regularly tested. Sheffield didn't have the crazy home run surges of Bonds, Sosa, and McGwire - only hitting a maximum of 43 homers in a season during his career - but neither really did Palmeiro (who capped out at 47), or Manny for that matter. Sheffield was named in the Mitchell Report and implicated in the BALCO scandal. Sheffield used the same personal trainer as Barry Bonds and investigative reporting has already done the dirty work of explaining Sheffield's steroid use, so I won't rehash it here. He used steroids and there isn't much debate to be had about it, even if he we don't technically have a confession from him or a positive test like we do with A-Rod, Pettitte, or Manny. Steroids aside, Sheffield clearly has Hall of Fame numbers. He's above the magical 500 home run mark with 507 career blasts, ranking 7th among rightfielders behind 5 Hall of Famers and Sosa. His 2,869 career hits rank 18th among rightfielders, behind 14 Hall of Famers, future Hall of Famer Ichiro Suzuki, Rusty Staub, and Dave Parker (both of whom Sheffield has vastly more homers than). His 1,676 career RBI rank 8th among rightfielders, behind 7 Hall of Famers. His 1,636 career runs scored also rank 8th among rightfielders, behind 7 Hall of Famers. His 1,475 career walks rank 5th among rightfielders, behind 3 Hall of Famers and Bobby Abreu. Sheffield's WAR of 60.5 ranks 18th among rightfielders, below the Hall of Fame average of 71.1. But I think using the mean as the average here doesn't make much sense to be fair, as positional greats like Ruth, Aaron, and Musial shouldn't severely diminish the success of other players. And from a median view of "average", we should expect that half of the guys are below the line anyway, so Sheffield's WAR ranking shouldn't be too concerning. He's got 14 Hall of Famers ahead of him, along with Dwight Evans, Reggie Smith, and the banned Shoeless Joe Jackson. Sheffield does have the same problem as Manny though, as he was also a bad fielder. His career Rfield of -195 ranks as the 2nd worst in history, ahead of only Derek Jeter. As primarily a rightfielder, the positional adjustment doesn't help much either, as his career dWAR of -27.7 also ranks as the 2nd worst in history, ahead of only Adam Dunn. So Sheffield was a poor defender, but his bat was more than enough to give him a solid WAR and have great Hall-of-Fame-esque numbers overall. However, given his steroid use and the fact that he wasn't among the greatest of steroid users and that we don't have evidence that he was a Hall of Famer before his use, I don't currently support his induction. Sheffield's total Player Value of 377.2 ranks 48th among the 4737 position players from 1973-2021, putting him in the top 1.01%. That's above the Hall of Fame line, and specifically he's above Hall of Famer Eddie Murray and behind Chase Utley. His Batting Value of 419.1 ranks an even better 12th, ahead of Mike Piazza and behind George Brett. However, his Fielding Value of -49.1 ranks as the 25th worst, ahead of Greg Norton but behind John Wathan. Sheffield recorded one 50+ Player Value season and two 40+ Player Value seasons. His best year was 1992, when he finished 3rd in the NL MVP voting, and he had the 3rd highest Player Value in the NL as well. Bonds was still the highest, but Ryne Sandberg should have finished 2nd rather than Terry Pendleton. My opinion: Not a Hall of Famer Predictive model: N/A, due to steroid use Player Value: Hall of Famer Nobody else on the ballot really has a shot at going in, and I don't really consider most of them as being in the neighborhood of Hall of Fame consideration. I'll go over them pretty quickly here, and note that I didn't feed most of these players through the predictive model. The exceptions were Peralta and Werth, whom the model thought very little of. Huston Street, CP (2005-2017) Street was a solid closer for most of his career, racking up 324 career saves, which ranks 20th all-time. That group of '90s, '00s, and '10s closers with about 300 or so saves is way too log jammed to really consider any of them Hall of Famers. Joe Nathan and Jonathan Papelbon got removed from the ballot last year and I think both of them had better careers than Street. He won a Rookie of the Year, but he was never a reliever of the year and only went to 2 All-Star games. Street has a total Player Value of 62.8, ranking 127th out of the 5248 pitchers from 1973-2021, putting him in the top 2.42%. He sits ahead of Hall of Famer Steve Carlton (who we should very importantly note began his career in 1965), and behind Orlando Hernandez. He had a Pitching Value of 47.2, which ranks 130th, above the still active David Robertson and below Ben Sheets. He also had a Fielding Value of 16.3. Street had no seasons with a Player Value of 20+, but he did have a 19.4 Player Value season in his rookie year of 2005. My opinion: Not a Hall of Famer Predictive model: N/A, not good enough to make it worthwhile, and model doesn't handle pitchers Player Value: Not a Hall of Famer John Lackey, SP (2002-2017) He was a starting pitcher in MLB for 15 seasons, which is about the extent that I can argue fro him. Went to just 1 All-Star game, finished top 10 in Cy Young voting twice, and won an ERA title. Won 188 games, struck out 2,294 guys, had a 3.92 career ERA, and pitched 2,840 innings. If guys like Mark Buehrle, or even Tim Hudson or Tim Lincecum from last year's ballot aren't Hall of Famers, then Lackey surely shouldn't be. One could say that his candidacy is Lack-ing... Lackey had a total Player Value of just 13.0, ranking 486th out of the 5248 pitchers from 1973-2021, putting him in the top 9.26%. He sits above Dave Tobik and below Horacio Pina. His Pitching Value of -4.1 is certainly unimpressive, ranking 2167th ahead of Dewon Day (who pitched 1 season and only 12 innings!) and behind the still active Gabe Speier. In terms of pitching alone, Lackey was a very standard pitcher over the course of his career. Most of his value came from his glove, as his Fielding Value of 33.8 ranks 132nd, ahead of Brett Myers and behind Rick Langford. Lackey also had a not-so-stellar Batting Value of -16.4, which ranks as the 136th worst behind J.A. Happ and ahead of Carl Pavano. Lackey did have two 20+ Player Value seasons in 2006 and 2007, but other seasons wiped that value away. He finished third in the AL Cy Young in 2007, but he actually had just the 9th best Pitching Value and the 6th best Player Value in the AL that year. My opinion: Not a Hall of Famer Predictive model: N/A, not good enough to make it worthwhile, and model doesn't handle pitchers Player Value: Not a Hall of Famer Jered Weaver, SP (2006-2017) A slightly more memorable name than Lackey, but had a shorter career with just 12 seasons. Went to 3 All-Star games and finished top 5 in Cy Young voting for each of those seasons. If Weaver could have been his 2010-2012 self for a longer portion of his career, then Cooperstown could have been a possibility. Won 150 games, struck out 1,621 batters, had a 3.63 career ERA, and pitched 2,067 innings. Ranks 2nd all-time in infield fly balls, since FanGraphs began tracking it in 2006. The similar WARs of Lackey and Weaver (37.3 vs 34.6) shows how it already kind of handles the quantity vs quality/peak debate. Weaver's total Player Value of 40.5 ranks 229th out of the 5248 pitchers from 1973-2021, placing him in the top 4.36%. He sits ahead of Eric Gagne and behind Ken Brett. Most of his value came from pitching, as his Pitching Value of 49.4 ranks 123rd, ahead of Brad Ziegler and behind C.J. Wilson. He loses some value with his hitting, with a Batting Value of -8.1. He had an inconsequential glove over the course of his career. Weaver posted a solid three 20+ Player Value seasons in his All-Star years of 2010-2012. In 2010 he finished 5th for the AL Cy Young, and had the 4th highest AL Pitching Value. In 2011 he finished 2nd for the Cy Young, and likewise had the 2nd highest Pitching Value in the AL. In 2012 he finished 3rd for the Cy Young, and likewise had the 3rd highest Pitching Value in the AL. Close but no cigar - if not for Verlander, we may have remembered Weaver more fondly. My opinion: Not a Hall of Famer Predictive model: N/A, not good enough to make it worthwhile, and model doesn't handle pitchers Player Value: Not a Hall of Famer Jacoby Ellsbury, OF (2007-2017) Interestingly enough, Ellsbury is the single-season and career record holder for catcher interferences. While one or two instances may be the cause of pure chance and luck, the fact that Ellsbury got significantly more than most other players shows that it was a skill of his, and we should acknowledge that value. However, only getting on base an extra 30 times due to that skill certainly isn't enough to make a big difference. He won one Gold Glove, one Silver Slugger, and appeared in one All-Star game. All of those occurred in 2011, when he also finished 2nd in MVP. That season he uncharacteristically had some power, hitting 32 home runs, despite never hitting more than 20 in any other season and only hitting more than 10 one other time. He was tied with Jose Bautista with 8.3 WAR for the most by a position player in the AL, losing the MVP to Justin Verlander and his 8.6 WAR. If Ellsbury was his 2011 self for more of his career, he probably has a shot at Cooperstown. But alas, he was a one hit wonder (well, really a 1,376 hit wonder, but still certainly not enough). Ellsbury's had a total Player Value of 128.6, which ranks 325th out of the 4737 position players from 1973-2021, putting him in the top 6.86%. He is just above J.J. Hardy and just behind the still active Jonathan Schoop. He had a Batting Value of 60.6 and a Fielding Value of 55.2. His Baserunning Value of 12.7 ranks 63rd, ahead of Larry Lintz and behind Von Hayes. He did have one 50+ Player Value season in 2011, which was the 2nd most in the AL, justifying his MVP place finish. My opinion: Not a Hall of Famer Predictive model: N/A, not good enough to make it worthwhile Player Value: Not a Hall of Famer Matt Cain, SP (2005-2017) Another pitcher with a decent career but certainly not a Cooperstown worthy one. Made it to 3 All-Star games and finished top 10 in Cy Young voting twice. Needed to maintain his 2009-2012 self to maybe have a shot at the Hall. Lost more games than he won, despite being part of the golden years of the San Francisco Giants that won 3 World Series in the 2010s. Decent career ERA of 3.62, but only played 13 seasons and pitched just 2,085 innings. Struck out 1,694 batters, but ranks 4th all-time in infield flyballs since FanGraphs began tracking it, which are basically as good as strikeouts (my deeper level Player Value weight research has a strikeout and a popout worth .33 runs, with groundouts at .29 runs and flyballs/lineouts at .31 runs). Cain's total Player Value of 76.5 ranks 91st out of the 5248 pitchers from 1973-2021, putting him in the top 1.73%. He sits ahead of Jake Westbrook and behind the still active Aroldis Chapman. He had an even better Pitching Value of 89.0 that ranks 61st, ahead of Tom Gordon and behind Hall of Fame closer Rollie Fingers (whose career we should also importantly note began in 1968). He had a decent Fielding Value of 10.1, but a not-so-decent Batting Value of -22.7. That's the 68th worst, ahead of Tim Belcher but behind Tony Armas. Cain posted two 20+ Player Value seasons in 2011 and 2012, the two seasons he finished top 10 in the NL Cy Young. He had the 3rd best Pitching Value in the NL in 2011, so he should have finished better than 8th like he did. He had the 5th best Pitching Value in the NL in 2012, so his 6th place finish was more justified. My opinion: Not a Hall of Famer Predictive model: N/A, not good enough to make it worthwhile, and model doesn't handle pitchers Player Value: Not a Hall of Famer Jhonny Peralta, SS (2003-2017) Peralta went to 3 All-Star games and appears to have been in the prime of his playing days from 2011-2015, based off of his accolades. His best seasons according to WAR were actually in 2005 and 2014 (5.1 and 5.8), and he was an All-Star in neither. While Peralta has as many All-Star games as candidates that I argued more for above in Vizquel and Rollins, his other numbers are more lacking. His WAR of 30.4 is well below both of those guys and ranks 74th all-time among shortstops. He had decent power for shortstop, hitting 202 homers (ranks 14th) and 20+ in a season five times. Just 1,761 hits and 873 RBI though, to go with a pretty average 102 OPS+. Fielding was not his saving grace either, with an Rfield of -30. The initial model did not predict Peralta as a Hall of Famer, giving him a probability of just 2.65%. None of the four initial submodels predicted him as a Hall of Famer. The updated model also did not predict Peralta as a Hall of Famer, giving him a probability of just 5.90%. None of the four updated submodels predicted him as a Hall of Famer. Peralta's total Player Value of 207.0 ranks 164th out of the 4737 position players from 1973-2021, putting him in the top 3.46%. I was actually surprised Peralta was this high. He sits above Don Money and behind Brian Dozier. He had a Batting Value of just 63.5, but his Fielding Value of 151.8 ranks a pretty solid 89th, ahead of Adrian Gonzalez and behind the still active Anthony Rizzo. His Fielding Value of -8.4 ranks as the 49th worst, above Dave Martinez and behind Dion James. He had no seasons of Player Value that were 40 or greater, capping out at 37.7 in 2005. My opinion: Not a Hall of Famer Predictive model: Not a Hall of Famer Player Value: Not a Hall of Famer R.A. Dickey, SP (2001-2017) Dickey was a late bloomer and even won a Cy Young in 2012 at the age of 37 when he went 20-6 with a 2.73 ERA in 233 innings pitched, along with league leading 230 strikeouts. He also appeared in his lone All-Star game in that season. He won his lone Gold Glove in 2013, though I've argued based on Player Value that he should have won the NL pitcher Gold Glove in 2010 as well. Besides that special 2012 season, Dickey was mainly just a knuckleball pitcher that could log you innings at a decent quality. He was nearly .500 for his career, with 120 wins and 118 losses. He recorded a 4.04 career ERA across 2,073 innings, with 1,477 strikeouts. If 2012 Dickey was the norm he could be a Hall of Famer, but that just wasn't the case. Dickey had a poor total Player Value of -17.9. That's the only player we've discussed that's been negative over his career. This means that overall, Dickey was generally in the bottom 25% of starting pitchers throughout the course of his career. He ranks a dismal 4103 out of the 5248 pitchers from 1973-2021, putting him only in the top 78.18%. A better way of putting it is that Dickey is in the bottom 21.82%. He's ahead of Kei Igawa and behind Edgar Garcia. His Pitching Value of -66.7 ranks as the 159th worst, ahead of Dave Lemanczyk and behind Homer Bailey. His Fielding Value of 56.8 saves him somewhat, ranking 42nd ahead of Bob Stanley and behind Hall of Fame closer Mariano Rivera. But his Batting Value of -7.9 further hurts him, as he has a -28 career OPS+ and got just 45 hits in his 306 career plate appearances. So why's he on the ballot? Mainly just the 2012 Cy Young season, when he had his lone 20+ Player Value year. He also had a 19.1 Player Value season in 2010, driven by his fielding. In reality he had just the 3rd most Pitching Value in the NL in 2012, so that Cy Young probably wasn't merited. My opinion: Not a Hall of Famer Predictive model: N/A, not good enough to make it worthwhile, and model doesn't handle pitchers Player Value: Not a Hall of Famer Andre Ethier, OF (2006-2017) Ethier won one Gold Glove, one Silver Slugger, appeared in two All-Star games, and finished top 10 in MVP once between 2009-2011. His best season according to WAR was actually 2012, when he put up 3.5 wins. His 12 season career really wasn't long enough to put up any impressive counting stats, with only 1,367 hits, 162 homers, and 687 RBI. He was a solid hitter during his playing years, however, with a 122 OPS+. His fielding could have been better, though, with an Rfield of -29. Overall his playing days were not great enough in quality for his peak to justify induction, with a WAR of just 21.5. Ethier's total Player Value is just 51.5, ranking 659th out of the 4737 position players from 1973-2021. That puts him in the top 13.91%, ahead of Ozzie Guillen and behind the still active Cesar Hernandez. He had a Batting Value of 81.6, a Fielding Value of -22.9, and a Baserunning Value of -7.2. His Fielding Value ranks as the 80th worst, above Champ Summers and behind the still active Dominic Smith. His Baserunning Value ranks as the 96th worst, above Jose Hernandez and behind Joe Orsulak. Around Ethier's range is former Red Eugenio Suarez, the hitting side of Shohei Ohtani (and not counting 2022), and the last 3 seasons of Hank Aaron's career. Ethier had no 40+ Player Value seasons, and in fact didn't even have any seasons over 20. My opinion: Not a Hall of Famer Predictive model: N/A, not good enough to make it worthwhile Player Value: Not a Hall of Famer Jayson Werth, OF (2002-2017) Werth was a part of the great late 2000s Phillies teams full of "Hall of Great" players. He'll join the likes of Ryan Howard and potentially Jimmy Rollins in the future, though Werth is probably a borderline "Hall of Great" player at that. He went to one All-Star game in 2008 and finished top 10 in MVP voting in 2009, receiving MVP votes in three other seasons. While he technically entered the big leagues in 2002 at the age of 23, it really took until his age 29 season in 2008 for him to take hold. From there he was a solid player until about 2014. He recorded seven seasons of 3+ WAR, but only had a 29.2 career WAR. His 1,465 hits, 229 homers, 799 RBI, and 117 OPS+ just aren't enough to really argue for induction. I argued that based on Player Value, Werth was the best hitting NL rightfielder in 2010 and the second best NL rightfielder in 2010 overall, behind Jay Bruce. The initial model did not predict Werth as a Hall of Famer, giving him a probability of 2.12%. None of the initial submodels predicted Werth as a Hall of Famer. The updated model also did not predict Werth as a Hall of Famer, giving him a probability of 4.92%. None of the updated submodels predicted Werth as a Hall of Famer. Werth had a total Player Value of 180.6, ranking 207th out of the 4737 position players from 1973-2021. This put him in the top 4.37%, ahead of the contract king Bobby Bonilla and behind Steve Finley. His Batting Value of 106.8 ranks 217th, ahead of Brian McCann and behind Matt Williams. His Fielding Value of 62.7 ranks 473rd, ahead of Marlon Byrd and behind Adam Eaton. He also had a surprising Baserunning Value of 11.1, which ranks 75th, ahead of Gene Richards and behind Bob Dernier. While he only stole 132 bags, he played RF, where the base stealing standards are pretty low. Werth had one 40+ Player Value season in 2009. My opinion: Not a Hall of Famer Predictive model: Not a Hall of Famer Player Value: Not a Hall of Famer J.J. Hardy, SS (2005-2017) Hardy went to 2 All-Star games, won a Silver Slugger, and won 3 Gold Gloves. He also had decent power for a shortstop, hitting 20+ homers in 5 different seasons. His 188 career home runs rank 18th all-time among shortstops. His 1,488 career hits and 688 career RBI are much less impressive, though. With an OPS+ of 91, Hardy scores as a below average hitter, but he did have a positive Rfield of 84. Overall his WAR of 28.1 shows that he isn't in the Hall of Fame conversation. Hardy's total Player Value of 128.6 ranks 326th among the 4737 position players from 1973-2021, putting him in the top 6.88%. He sits just behind fellow first year candidate Jacoby Ellsbury, and just above Derrek Lee. His Batting Value of 18.5 ranks just 599th, ahead of Kelly Johnson and behind the still active Luis Arraez. However, his Fielding Value of 112.5 ranks a more admirable 188th, ahead of Brendan Ryan and behind Jerry Hairson Jr. Hardy posted one 40+ Player Value season in 2011. My opinion: Not a Hall of Famer Predictive model: N/A, not good enough to make it worthwhile Player Value: Not a Hall of Famer Mike Napoli, 1B/C (2006-2017) If Napoli were actually a catcher for more of his career, I might be arguing his case a little more and put him in the "maybe" category. With 267 career home runs, he would rank 10th all-time among catchers behind 6 Hall of Famers, Brian McCann (who hasn't yet appeared on a ballot), Lance Parrish (who I think should be in the Hall), and Jorge Posada. His 744 RBI are less impressive and rank just 35th, and his 1,125 hits are even less impressive and rank just 77th. His 650 walks rank 25th. So while he had some pop, he didn't really walk enough or otherwise bat well enough to be a good "three true outcomes" type player. Part of his lacking counting totals are due to his shorter 12 season career, though. His OPS+ is decent at 117, but certainly not enough to merit serious induction. He wasn't a great fielder either, with an Rfield of -17. And again, Napoli wasn't entirely a catcher; he played 678 innings at first base and 539 innings at catcher, switching over in 2013 when he left the Rangers and joined the Red Sox. Among first basemen, his 267 homers would rank just 55th. Napoli's total Player Value of 94.0 ranks just 454th out of the 4737 position players from 1973-2021, only in the top 9.58%. His Batting Value of 73.6 ranks 295th, ahead of the still active Jose Abreu and behind the still active Cody Bellinger. His Fielding Value of 22.7 ranks 1139th, ahead of Brian Hunter (the CF) and behind the still active Luis Rengifo. I thought that Napoli would have had a higher Batting Value and a lower Fielding Value, but that isn't in the case. It was that position change that really did him in, as his Batting Value was solidly positive for most of his catcher years but declined for his first base years. For Fielding Value, he fared better as a first baseman and worse as a catcher. This is in line with the logic of the different offensive and defensive positional expectations for catchers and first basemen. Napoli posted one 40+ Player Value season in 2011. My opinion: Not a Hall of Famer Predictive model: N/A, not good enough to make it worthwhile Player Value: Not a Hall of Famer Bronson Arroyo, SP (2000-2014, 2017) Ah, Bronson Arroyo. As a kid growing up in Cincinnati in the 2000s and 2010s, Arroyo's famous leg kick was a timeless move to imitate. But alas, sentiment alone isn't enough to merit induction into the Hall of Fame. Although, Arroyo was recently announced as the 2023 inductee for the Reds Hall of Fame (I argued for Aaron Boone, based on Player Value). Arroyo went to one All-Star game in his first year with the Reds in 2006, and won one Gold Glove in 2010 (that Player Value thinks belonged to Dickey). As I showed in my linked Twitter thread about the Reds Hall of Fame candidates, Bronson had some great seasons in 2004, 2006, 2010, 2005, 2009, and 2003. However, his 2007 and 2008 were poor, as were most seasons before and after that main span. WAR thinks more highly of the 2007 and 2008 seasons, as well as 2012 and 2013, than Player Value does. Bronson just needed that 10 year stretch from 2003-2014 to be a bit better, or to extend for longer than 10 years. He ended with 148 wins, a 4.28 career ERA, 2,435 innings pitched, and 1,571 innings pitched, producing a 23.4 career WAR. Unfortunately for my Reds fandom, Arroyo's had a total Player Value of -45.3, ranking a poor 4927 out of the 5248 pitchers from 1973-2021. That puts him in just the top 93.88%. More accurately, he ranks as the 322nd worst, in the bottom 6.12%. He sits ahead of Jonathon Niese and behind Mark Knudson. His Pitching Value of -68.1 ranks as the 150th worst, ahead of Vince Velasquez and behind Kip Wells. His Fielding Value of 48.9 somewhat saves him and ranks 66th, ahead of Rick Mahler and behind Fergie Jenkins. His Batting Value of -26.2 further hurts him though, ranking as the 37th worst, ahead of Fred Norman but behind the still active Alex Wood. It's not like Bronson was bad for his entire career, though, or else he probably wouldn't have been kept around. He had a 20+ Player Value season in 2006, as well as an 18.2 Player Value season in 2004. For most of 2003-2010, Bronson was a solid pitcher, with the odd exceptions of 2007 and 2008. During those 8 years, he put up a 52.2 Player Value, and that shoots up to 67.2 if you ignore 2007 and 2008. What hurt him were his poor early years in Pittsburgh from 2000-2002, and his seasons after 2010. That extra season in 2017 after not playing for two seasons was especially detrimental, as he posted a -24.5 Player Value. Bronson's rise after his poor early career in Pittsburgh is admirable, but sometimes players need to know when it's time to hang up the spikes. My opinion: Not a Hall of Famer Predictive model: N/A, not good enough to make it worthwhile, and model doesn't handle pitchers Player Value: Not a Hall of Famer And that's the ballot! I've broken down every player on the ballot, in terms of my own personal arguments (based on statistics, of course), my predictive model's thoughts, and how the players rate under my Player Value metric. As a final summary, let's quickly hash out each stance's Hall of Fame thoughts: My Opinion:
Hall of Fame Predictive Model:
Player Value:
Player Value is of course a new concept and probably the most controversial of what I've written from above. Maybe you think it's trash. I admit it's not perfect, nor is it where I would like it to be. I still need to measure players' opportunity sets more fairly, rather than just based on plate appearances or innings pitched/in the field. However, I don't think it's completely useless. The 3 best position players during the span used were Barry Bonds, A-Rod, and Mike Schmidt. The 3 best hitters were those same 3 guys. The best fielder was Ozzie Smith, the 2 best baserunners were Rickey Henderson and Tim Raines, and the top 5 pitchers (at pitching) were Roger Clemens, Nolan Ryan, Pedro Martinez, Greg Maddux, and Randy Johnson. The best fielding pitcher was Greg Maddux. The best hitting pitcher was Mike Hampton. I don't think anyone will argue too much with those results, and any metric that can reproduce those rankings is one that I think is at least somewhat worthy of using for evaluation. See the 4 attached files below for the Player Value totals for both position players and pitchers careers from 1973-2021, as well as the zipped Player Value totals for position player and pitcher seasons from 1988-2017 (the period where any of the 2023 ballot players played in).
Below is the dataset used to train the initial Hall of Fame model, the dataset of players from the 2023 BBWAA ballot, and the initial model's predictions on those players:
Below is the dataset used to train the updated Hall of Fame model, and the updated model's predictions on the players I used from the 2023 BBWAA ballot:
Thanks everyone as always for parsing through another lengthy post. I look forward to continuing my Player Value research this year and sharing the results after I've refined it to another level of acceptability. Statting Lineup Newsletter Signup Form:
If you'd like to receive email updates for each new post that I make, sign up for the Statting Lineup newsletter using the link below: https://weebly.us18.list-manage.com/subscribe?u=ab653f474b2ced9091eb248b1&id=3a60f3b85f Tomorrow, (Sunday, December 4th), the results from the Hall of Fame's 2023 Contemporary Era Committee ballot will be announced. The ballot consists of 8 players that made their primary impact after 1980, and you can view the players on the ballot here. With this in mind, I thought I would take a break from my Player Value research to see what my Hall of Fame predictive model thought of these candidates, as well as share my own thoughts and provide the current version of Player Value for each candidate's career. I'll go over some details of my Hall of Fame predictive model and its use on the 2022 ballots first; feel free to skip ahead if you'd just like to see the model's and my thoughts on the 2023 Contemporary Era ballot candidates. Hall of Fame Predictive Model Overview I first introduced my model and used it on the 2022 BBWAA ballot here. I entered the model into the 2021 Fall USCLAP competition during my final semester in college, and it ended up finishing in 2nd place. You can view the winners here, and the official report here. The report dives into the nitty gritty of the model, if you are interested in predictive modeling and learning those fine details. As a quick(ish) summary, the model is intended to only be used on position players that finished their careers after 1957, and that did not use steroids or have some other obvious scandal that is the primary deterrent of the Hall of Fame induction. There are some players, such as Barry Bonds and Pete Rose, that are statistically pretty obvious Hall of Fame inductees, but that are left out because telling the model that someone of their caliber isn't a Hall of Famer would confuse it, since it only considers their performance on the field. While I could have keyed in a "character clause" predictor in the model to handle this, I felt it easier to just exclude the players in question. Gold Gloves and other awards are fairly important predictors of whether a player is in the Hall of Fame, and earlier years (i.e. pre-1957) lacked many of these awards, so the model would unfairly judge these earlier players. Since pitchers are judged on an entirely different basis than position players, it didn't make sense to predict them using the same model, so pitchers are excluded as well. Lastly, Negro League players and stats are not incorporated in the model. While these leagues were basically equally competitive as the Major Leagues at the time (as seen by the dominance of early transition players like Jackie Robinson and Roy Campanella), they played far shorter seasons and have less recorded statistics, so these players' stats and model predictions would be flawed when considering their career statistics. The model uses 5 classes of predictors:
Defensive statistical averages per season, such as putouts per 162 games, were considered but not used due to their lack of predictive power. In fact, most of a player's defensive Hall of Fame value is only encompassed in their Gold Gloves. Only their fielding percentage and range factor per game differences from league average ended up being predictive from the career defensive statistics. Generally, the most important predictors for the various submodels (listed below) ended up being a player's All-Star seasons, career runs scored, career singles, and career RBI. In fact, a simple decision tree model can be run to visualize these important predictors:  This simple decision tree model predicts anyone with at least 7 All-Star seasons and 1,208 runs scored as a Hall of Famer, an assertion that's right every time based on the dataset. It also predicts anyone with at least 7 All-Star seasons, less than 1,208 runs scored, but more than 1,239 singles as a Hall of Famer, an assertion that's only right about half the time based on the dataset. Anyone with fewer All-Star seasons, runs scored, or singles is predicted as not a Hall of Famer, an assertion that we can see is nearly always correct. This simple decision tree model is not as accurate as my actual Hall of Fame model, but it's surely better than a coin-flipping approach and is very easy to interpret and helps us visualize that All-Star seasons and runs scored are the preeminent predictors of a player's Hall of Fame fate. Again, this was just an illustrative example - this is NOT my actual Hall of Fame model. My initial model was completed just before the results from the 2022 Golden Days Era Committee ballot were announced. You can check out those candidates here. That ballot consisted of 9 players (7 position players and 2 pitchers) and 1 manager. Jim Kaat, Gil Hodges, Tony Oliva, and Minnie Minoso would all go on to be inducted into the Hall of Fame. The initial model performed really well, with an AUC of .9817. AUC stands for Area Under the Curve, and is basically a measure of model accuracy on a scale of 0 to 1. An AUC of 0.5 represents a random guess, coin flip approach. The higher the AUC, the more accurate the model, and my model's AUC was quite high. The simple decision tree model that I displayed above had an AUC of .8105. We technically care about the test AUC, which is the AUC of the model on the test set, meaning the data/players that the model was not trained or developed on. The training set are the players used to essentially teach the model, and then the test set are the players used to evaluate the model's accuracy. My Hall of Fame predictive model is an ensemble model of 4 different submodels:
With 187 players in my dataset overall, I placed 141 in the training set and 46 in the test set. Of the 46 players in the test set, 17 were Hall of Famers, and thus 29 were not. My model correctly predicted 28 of the 29 non-Hall of Famers, asserting that Dave Parker should be a Hall of Famer (personally, I agree!). It correctly predicted 15 of the 17 Hall of Famers, stating that Lou Brock and Alan Trammel were not up to par. The initial model was designed for predicting future players on each year's BBWAA ballot, not the Era Committee ballots. The Hall of Famers and non-Hall of Famers that the model was trained on were players that already had their BBWAA fates decided, and any candidate on an Era Committee ballot would have been rejected by the BBWAA already. Because of this, simply using the same initial dataset that trained the initial model and then predicting the 2022 Golden Days ballot players is a flawed approach that results in none of the players being predicted as Hall of Famers. For any player such as Ken Boyer that was in the training set, the model will predict them as a non-Hall of Famer since that is exactly what the model was told when training on the data. While it could predict players in the test set still fine, all of the Golden Days candidates in the test set were not predicted as Hall of Famers. The proper approach is to remove the 7 position players - Dick Allen, Ken Boyer, Gil Hodges, Roger Maris, Minne Minoso, Tony Oliva, and Maury Wills - from the data and retrain the model on this adjusted dataset. Doing this worsens the predictive accuracy of the model down to .9477. While this is worse than the initial model's AUC of .9817, it is still great overall. Nonetheless, this reduction in accuracy foreshadows how the model thinks of these players. Removing the information that told the model that these players weren't Hall of Famers made it worse. After applying this adjusted version of the model to the players on the 2022 Golden Days ballot, only Dick Allen was predicted as a Hall of Famer. This isn't too shocking, as Allen's bWAR of 58.7 is larger than those of the players' who ended up getting inducted - Hodges at 43.9, Oliva at 43.0, and Minoso at 53.8. Allen is also 23rd all-time in career OPS+ at 156, tied with Frank Thomas and the most of any player that isn't active, used steroids, banned from baseball, or simply archaic (sorry Pete Browning and Dave Orr). His OPS+ is higher than that of both Hank Aaron and Willie Mays. Outside of Jim Kaat - whose 16 Gold Gloves are the 2nd most all-time by a pitcher (and thus isn't handled by the model) and has 287 wins with 2,461 strikeouts - I personally wasn't too sold on any of the players being inducted on last year's era ballot, but Allen would have been at the top of my consideration. As I wrote about previously, when applying this adjusted version of the model to the players on the 2022 BBWAA ballot, only David Ortiz and Todd Helton were predicted as Hall of Famers. Of course, Ortiz was inducted his first year on the ballot with 77.9% of the vote. Helton received 52% of the vote in his 4th year on the ballot, an increase from his 44.9% received in 2021. When applying the Hall of Fame predictive model to the 2023 Contemporary Era ballot, there are 2 approaches we can take:
Albert Belle, OF Years: 1989-2000 Teams: Cleveland Indians, Chicago White Sox, Baltimore Orioles Accolades: 5x All Star, 5x Silver Slugger, 3x RBI Leader, 2x SLG Leader, 1x Runs, Doubles, HR Leader Key Stats: 381 HR, 1,239 RBI, 389 Doubles, 1,539 G, 6,676 PA, .933 OPS, 144 OPS+, 3,300 TB Player Value: 312.15 Total, 244.60 Batting Value, -2.52 Baserunning Value, 70.05 Fielding Value  Photo courtesy of WKBN 27 Model Talk: The initial combined ensemble model gives Belle a Hall of Fame probability of .2379, which rounds down to 0 and thus predicts him as not a Hall of Famer. The FDA submodel is particularly unimpressed with Belle, giving him a probability of just .0008. The GLM model isn't too fond of Belle either, giving him a probability of .2145. The model averaged neural network holds a similar stance, with a probability of .1667. However, the SVM model does think Belle should be a Hall of Famer, giving him a probability of .5695. While the final combined ensemble model's AUC was .9664, the GLM and FDA submodels were actually more accurate after the training set updates, with AUCs of .9800 and .9811, respectively. The SVM and neural network submodels were still worse, however, with respective AUCs of .9054 and .9391. Given that the most accurate submodel gives Belle the lowest probability, and the least accurate submodel gives Belle the highest probability, we can conclude that the model doesn't like Belle too much. It did give him a higher combined probability than Hall of Famer Alan Trammel (.1039), however. Since the ensemble model isn't actually the best in this case, and since the 4 submodels have varying accuracy, another approach for the final probability is to compute a weighted average based off of the accuracy of each submodel, rather than using a simple average. That is to say, weight the GLM and FDA predictions more heavily since they are more accurate, rather than treating them equally as the SVM and neural network predictions. This alternative approach makes the ensemble model's AUC now slightly higher at .9706. This alternative approach has a pretty minimal effect. Each of the submodel probabilities are the same, but Belle's new final ensemble probability is now slightly lower at .2321. Again, this is due to the more accurate submodels giving him lower probabilities of being a Hall of Famer. What if we update the training set with the 2022 Hall of Fame results and then retrain the model? The resulting ensemble model is worse, with a lower AUC of .9286. The updated FDA submodel has an AUC of .8948, the updated GLM submodel has an AUC of .9206, the updated SVM submodel has an AUC of .9246, and the updated neural network submodel has an AUC of .9206. So, the FDA and GLM submodels got worse, as did the neural network submodel and the ensemble model overall, but the SVM submodel actually became more accurate with the 2022 Hall of Fame results. This updated simple average ensemble model gives Belle a probability of .2430, slightly higher than without the updates but still not enough to be predicted as a Hall of Famer. The FDA submodel probability is .0022, the GLM submodel probability is .2115, the SVM submodel probability is .4680, and the neural network submodel probability is .2904. Lastly, if we use the weighted average ensemble model with the training dataset that includes the 2022 Hall of Fame results, Belle's new ensemble probability is slightly higher at .2450. Still not high enough to be predicted as a Hall of Famer. In this case, the now less accurate FDA submodel is weighted less while the now more accurate SVM model is weighted more. The FDA submodel liked Belle the least, and the SVM submodel liked him the most, so the increase here makes sense. Interestingly enough, in this case the weighted average ensemble model is just as accurate as the simple average ensemble model, as both had an AUC of .9286. Predictive Model Verdict: Not a Hall of Famer My Thoughts: Maybe you don't think Belle's career totals are that impressive, and maybe you're wondering why I included his career games played and career plate appearances under his "Key Stats". The answer is context. Belle played in just 12 seasons, including his first 2 seasons when he played in just 71 games combined. So out of 10 real full seasons, he was an All-Star half of the time and a Silver Slugger half of the time. He also finished in the top 10 in MVP voting for 5 of those seasons, and in my opinion was robbed of the 1995 MVP by Mo Vaughn, who he bested in basically every offensive category (you can see for yourself here). He hit 30+ HR in 8 of those seasons, and hit 28 and 23 in the other two. He had 100+ RBI in 9 of those seasons, and recorded 95 in the other one. He hit 30+ doubles in 9 of those seasons, and hit 23 in the other one. Consistently 30 doubles, 30 homers, and 100 RBI per season? I'll take that. In terms of the 255 players used in my predictive model dataset, Belle ranks 6th in doubles per 162-game season with 40.9, behind 4 Hall of Famers (Medwick, Greenberg, Hafey, Herman) and Nomar Garciaparra. He ranks 7th in RBI per 162-game season with 130.4, behind 6 Hall of Famers (Gehrig, Greenberg, DiMaggio, Ruth, Foxx, Simmons). He ranks 3rd in HR per 162-game season with 40.1, behind 2 Hall of Famers (Ruth and Kiner). Looking at the LF JAWS leaderboard, he ranks 10th in MVP shares behind Barry Bonds, Pete Rose, Manny Ramirez, and 6 Hall of Famers. I will note that WAR doesn't like Belle's peak quite as much, as his 7 year peak WAR of 36.0 ranks just 29th all-time among left fielders (but ahead of him are 16 HoFers, Rose, and Bonds). That is all to say that Belle had a tremendous peak. But it wasn't just that he was great for a decade and then slowly panned out; his career was abruptly cut short at the age 33 due to a hip injury. I can't emphasize this enough, as I feel it is frequently overlooked when discussing Belle's case. Kirby Puckett and Roy Campanella had career-ending injuries at 35 and are in the Hall of Fame. Ralph Kiner had a career-ending injury at 32 and is in the Hall of Fame. Heck, even Ross Youngs was done by 29 due to illness and is somehow in the Hall of Fame. So, why not Belle? When a player's great career is suddenly cut short, I prefer to give him the benefit of the doubt. Belle's total Player Value of 312.15, under the current version, ranks 66th out of the 4,737 position players since 1974, which puts him in the top 1.4%. His Batting Value of 244.60 ranks him 59th, which is the top 1.25%. Clearly Player Value thinks Belle's peak was sufficiently great! My Opinion: Put Him In Don Mattingly, 1B Years: 1982-1995 Teams: New York Yankees Accolades: 9x Gold Glove, 6x All Star, 1x MVP, 3x Silver Slugger, 3x Double Leader, 2x Hit Leader Key Stats: 2,153 H, .307 BA, 442 Doubles, 222 HR, 1,099 RBI, 7,722 PA, 1,785 G Player Value: 205.42 Total, 66.50 Batting Value, -0.33 Baserunning Value, 139.25 Fielding Value  Photo courtesy of NBC Sports. Model Talk: The initial ensemble model gives Mattingly a combined probability of .2787, rounding down to a non Hall of Famer prediction. The FDA model has him at just .0331, while the GLM, SVM, and neural network models are slightly more positive, giving him respective probabilities of .3066, .4377, and .3375. If we use the approach where we weight the submodels based off of their accuracy, Mattingly's new ensemble probability becomes .2749, even worse than before. Again, the GLM and FDA submodels were the most accurate (highest AUCs) and they gave Mattingly the lowest Hall of Fame probabilities. If we use the model that was retrained on the training data that includes the 2022 Hall of Fame voting results, the simple average ensemble model gives Mattingly a notably higher probability of .4351, but this is still too low to be predicted as a Hall of Famer. The FDA submodel gives him a probability of just .0076, the GLM submodel gives him a probability of .4479, the SVM submodel gives him a high porbability of .7002, and the neural network submodel gives him a solid probability of .5849. If not for the FDA submodel's tiny probability (which now has the lowest AUC and is thus the least accurate after the 2022 updates), then Mattingly might have been predicted as a Hall of Famer by the simple average ensemble model. Lastly, if we use the weighted average ensemble model with the training dataset that includes the 2022 Hall of Fame results, Mattingly's new ensemble probability is slightly higher at .4384. Still not high enough to be predicted as a Hall of Famer. In this case, the now less accurate FDA submodel is weighted less while the now more accurate SVM model is weighted more. The FDA submodel liked Mattingly the least, and the SVM submodel liked him the most, so the increase here makes sense. Predictive Model Verdict: Not a Hall of Famer My Thoughts: Mattingly also retired early at age 34, but due to a more gradual deterioration via back injuries rather than due to a sudden career-ending injury. His 9 Gold Gloves are the 2nd most by a first baseman in history, behind only Keith Hernandez (who I also think should be inducted and been included on this ballot). Besides these two, every other players with at least 9 Gold Gloves is in the Hall or is still having their fate decided. I think the many Gold Gloves are what drives Mattingly's case for me, while still not being bad offensively. Despite a shorter career he still amassed at least 2,000 hits and 1,000 RBI, won a batting title, led the league in OPS in 1986 when he finished 2nd in MVP voting, and led the league in doubles 3 times. Only 9 players that spent at least 50% of their time at first had a higher career batting average than Mattingly's .307 with as many plate appearances. Of those 9, 7 are in the Hall of Fame, Todd Helton is still awaiting his fate (I think he should be in), and the last is Stuffy McGinnis, whose .307 career batting average is contextually not as impressive given that he played in an earlier era where higher batting averages were more common. Mattingly may not have been a powerhouse offensively, and WAR may disagree with his defensive ability, but he won 9 Gold Gloves nonetheless and like Dale Murphy below is another player that can bolster the lackluster Hall of Fame membership of players from the '80s. Mattingly's total Player Value of 205.42, under the current version, ranks 155th out of the 4,737 position players since 1974, which puts him in the top 3.27%. At least under the current iteration, this suggests that Don is more 'Hall of Great' territory. His Fielding Value of 139.25 ranks him 127th, which is the top 2.68%. My Opinion: Put Him In Fred McGriff, 1B Years: 1986-2004 Teams: Toronto Blue Jays, Atlanta Braves, Tampa Bay Devil Rays, San Diego Padres, Chicago Cubs, Los Angeles Dodgers Accolades: 5x All Star, 3x Silver Slugger, 2x HR Leader Key Stats: 493 HR, 2,490 H, 1,550 RBI, 1,305 walks, 1,349 R Player Value: 247.50 Total, 180.52 Batting Value, -0.57 Baserunning Value, 67.55 Fielding Value  Photo courtesy of Sports Illustrated. Model Talk: The initial ensemble model gives McGriff a solid probability of .6322, rounding up to a Hall of Fame prediction. The FDA submodel loves McGriff, giving him a .9019 probability. The GLM submodel thinks otherwise, giving him just a .3492 probability. The SVM and neural network submodels also support his candidacy with probabilities of .5418 and .7357, respectively. If we use the approach where we weight the submodels based off of their accuracy, McGriff's new ensemble probability becomes .6330, slightly higher than before. The FDA submodel was the most accurate (highest AUC) and it gave McGriff the highest Hall of Fame probability, thus the increase. If we use the model that was retrained on the training data that includes the 2022 Hall of Fame voting results, the simple average ensemble model gives McGriff a notably lower probability of .3710, which is now low enough to not be predicted as a Hall of Famer. The FDA submodel gives him a much lower probability of just .0694, the GLM submodel gives him a probability of .4100, the SVM submodel gives him a probability of .5260, and the neural network submodel gives him a probability of .4785. The FDA submodel went from loving McGriff to hating him, and became much less accurate in the process. Lastly, if we use the weighted average ensemble model with the training dataset that includes the 2022 Hall of Fame results, McGriff's new ensemble probability is slightly higher at .3733. Still not high enough to be predicted as a Hall of Famer. In this case, the now less accurate FDA submodel is weighted less while the now more accurate SVM model is weighted more. The FDA submodel liked McGriff the least, and the SVM submodel liked him the most, so the increase here makes sense. Predictive Model Verdict: Hall of Famer, ignoring last year's results My Thoughts: McGriff may not have won an MVP, but he finished in the top 10 in voting 6 times. The only first basemen with more top 10 MVP finishes are 5 HoFers (Gehrig, Thomas, Murray, Killebrew, Ortiz), 2 future HoFers (Pujols, Cabrera) and Freddie Freeman. Tied with McGriff with 6 top 10 MVP finishes are 3 HoFers (Mize, Terry, Bagwell), 2 active players that I think are likely future HoFers (Votto, Goldschmidt), Ryan Howard, and Andres Gallaraga. McGriff's 493 home runs are tied with Lou Gehrig for the 12th most by a first basemen and the 29th most across all positions. The 11 first basemen with more homers are 7 Hall of Famers, 2 future Hall of Famers (Pujols, Cabrera) and 2 notable steroid users (McGwire, Palmeiro). Of the 28 players with more homers, every single one is either in the Hall of Fame, used steroids, still active, or not yet eligible for the Hall of Fame. Fred McGriff has the most home runs of any "clean" player that has been thus far rejected for the Hall of Fame. I personally think reaching 500+ home runs should automatically qualify a player for the Hall, granted that they didn't use steroids, and historical voting seems to reflect this rule. The fact that McGriff has been excluded due to 7 homers is absurd, especially when we consider the 1994 strike-shortened season. In 1994 the Braves (like all other MLB teams) played a shortened schedule of 114 games, of which McGriff played in 113. In those 113 games, McGriff hit 34 home runs, good for a pace of about .3 homers per game. Across a normal full 162 game season, that's 48.6 homers. McGriff played in 113 out of 114, or 99.12% of his team's games. That brings the hypothetical full season total down to 48.17, which we'll round down to 48. That's 14 more HR than his actual 34 in 1994. With this short hand math, we estimate McGriff would have had 507 career home runs, if not for the 1994 strike. McGriff's 1,550 RBI rank 47th most all-time. You can take a look at this list and see that all of the players ahead of him are either in the Hall, used steroids, or haven't been on a ballot yet (Beltre and Beltran). He ranks 15th in RBI among first basemen, with the usual HoF/steroid/not yet eligible suspects ahead of him. His 2,490 career hits also rank 15th among first basemen. He hit 30+ home runs in 10 seasons, a feat achieved by just 21 players. Besides Carlos Delgado, every other player that has done this is either in the Hall, will be in the Hall, or used steroids. The advanced metrics don't like McGriff as much. His WAR of 52.6 ranks 30th all-time among first basemen, below the Hall of Fame positional average of 65.5 (which would rank 14th). His JAWS of 44.3 ranks 31st all-time among his position, also below HoF average. But should the clean guy with the most HR and RBI not in the Hall be excluded, especially if he would have reached the essentially automatic qualifier of 500 HR if not for a strike? I think not. McGriff's total Player Value of 247.50, under the current version, ranks 119th out of the 4,737 position players since 1974, which puts him in the top 2.5%. His Batting Value of 180.52 ranks him 94th, which is the top 1.98%. My Opinion: Put Him In! Dale Murphy, OF Years: 1976-1993 Teams: Atlanta Braves, Philadelphia Phillies, Colorado Rockies Accolades: 7x All Star, 2x MVP, 5x Gold Glove, 4x Silver Slugger, 2x HR and RBI Leader Key Stats: 398 HR, 2,111 H, 1,266 RBI, 350 doubles Player Value: 166.45 Total, 220.28 Batting Value, 1.48 Baserunning Value, -55.31 Fielding Value  Photo courtesy of Baseball Egg. Model Talk: The initial ensemble model gives Murphy a probability of .5079, barely rounding up to a Hall of Fame prediction. The FDA submodel isn't too high on Murphy, giving him a probability of .2701. The GLM submodel is slightly more favorable at a .3986 probability. The SVM submodel is a virtual toss-up with a .4943 probability. The neural network submodel is a big fan of Murphy, giving him a .8687 probability. If we use the approach where we weight the submodels based off of their accuracy, Murphy's new ensemble probability becomes .5043, slightly lower than before. The SVM and neural network submodels were the least accurate (lowest AUCs) and they gave Murphy the highest Hall of Fame probabilities, thus the decrease. However, these submodels were still accurate enough and still gave Murphy high enough probabilities to still merit a Hall of Fame prediction overall. If we use the model that was retrained on the training data that includes the 2022 Hall of Fame voting results, the simple average ensemble model gives Murphy a slightly higher probability of .5125, which is high enough to be predicted as a Hall of Famer. The FDA submodel gives him a probability of .1462, the GLM submodel gives him a probability of .5207, the SVM submodel gives him a high probability of .7555, and the neural network submodel gives him a solid probability of .6274. Lastly, if we use the weighted average ensemble model with the training dataset that includes the 2022 Hall of Fame results, Murphy's new ensemble probability is slightly higher at .5153. Still not high enough to be predicted as a Hall of Famer. In this case, the now less accurate FDA submodel is weighted less while the now more accurate SVM model is weighted more. The FDA submodel liked Murphy the least, and the SVM submodel liked him the most, so the increase here makes sense. Predictive Model Verdict: Hall of Famer, regardless of last year's results My Thoughts: Murphy has the accolades worthy of a Hall of Famer, but his cumulative career totals are somewhat lacking. We can't make any type of career hits, homers, or RBI arguments for Murphy like we can with McGriff. But he did win 2 MVPs, which only 5 center fielders have done in history. The other 4 are future HoFer Mike Trout and 3 HoFers (Mantle, Dimaggio, Mays). Not a bad crowd. WAR does disagree with his winning of these MVPs, however, favoring Gary Carter instead in 1982 and John Denny or Dickie Thon in 1983. There have been a total of 32 players that have won multiple MVPs in history, and just 11 have won at least 3 with only Barry Bonds winning more than 3. Of the 31 other dudes, 23 are in the Hall of Fame, 3 used steroids (Bonds, A-Rod, Juan Gonzalez), and 3 are future Hall of Famers (Pujols, Cabrera, Trout). The remaining 2 are Bryce Harper - who is still active and likely a future Hall of Famer as well - and Roger Maris. Murphy has nearly 800 more hits, 100 more HR, and 400 more RBI than Maris, as well as 4 more Gold Gloves. Their cases are very similar, but Murphy was able to stay around a few seasons longer than Maris was, and was better defensively (at least in terms of awards; Rfield has Murphy at -34 and Maris at 45). Amongst center fielders, Murhpy's 398 home runs actually track pretty well, ranking him 8th. Ahead of him are 5 HoFers (Mays, Griffery Jr., Mantle, Dawson, Snider) and 2 players whose Hall of Fame fates have yet to be truly decided in Andruw Jones and Carlos Beltran. In general, the 1980s are underrepresented in Cooperstown. Greats like Darryl Strawberry, Dave Stewart, Keith Hernandez, Dwight Gooden, and Dave Stieb have all been excluded. Sports Reference's Adam Darowski shared a split of Hall of Famers by their debut year on Twitter. The 1980s have just 16, compared to 22 from each of the '50s and '60s, and a whopping 46 from the '20s. Murphy was another one of the '80s greats, and inducting him could help begin righting this wrong. Murphy's total Player Value of 166.45, under the current version, ranks 212th out of the 4,737 position players since 1974, which puts him in the top 4.48%, not quite Hall of Fame caliber. His Batting Value of 220.28 ranks him 66th, however, which is the top 1.39%. I certainly think that the offensive side of Player Value is currently more accurate than the defensive side. My Opinion: Put Him In So the model says to put 1 to 2 guys in, and I'd put all 4 in given the chance. What can I say, I'm a "big Hall" guy. The following players weren't predicted by the model since they're pitchers or used steroids, but here are my thoughts on their Hall of Fame cases: Curt Schilling In my hypothetical 2022 ballot, I highly emphasized that I thought Schilling should be in Cooperstown. Straight from that earlier post: "Historically, certain career marks have been guarantees for induction. One such milestone is 3,000 strikeouts, which only 19 pitchers have done in history. Of these, 2 are active players (Max Scherzer and Justin Verlander), 1 is not eligible for the ballot yet (C.C. Sabathia), and 1 used steroids (Roger Clemens). Of the remaining 15 pitchers with 3,000 or more strikeouts, 14 of them are in the Hall of Fame and the other is Curt Schilling. Schilling's 3,116 career K's are good for 15th all-time, more than Hall of Famer John Smoltz's career total in about 200 less innings, and just 1 less than Hall of Famer Bob Gibson's career total in about 600 less innings. Schilling's career WAR of 79.5 is 26th best among starting pitchers and the most of any starting pitcher not in the Hall of Fame, with the exception of Clemens. Schilling also rocks an impressive 6 All-Star game seasons, 3 World Series, and a World Series MVP. While he never won a Cy Young award, he did come in 2nd place three times and in 4th place once. People like to rag on Schilling's character, which is admittedly deplorable, but... [t]he Hall contains the best baseball players in history, and Curt Schilling is clearly one of them and therefore should be inducted." Max Sherzer and Justin Verlander have since passed Schilling in K's to now rank him 17th all-time, but the point still stands. Schilling has no connection to steroids and absolutely should be inducted as one of the game's great pitchers, regardless of how objectively awful of a person he is. The current version of Player Value has Schilling at 188.64, ranking him 29th among the 6,077 pitchers since 1974. His Pitching Value of 237.97 ranks 14th. Barry Bonds My hypothetical 2022 ballot also included Bonds. I'm not going to hash out his case all over, but feel free to click the link above under Schilling to review what I previously stated. The short of it is that I'm generally against steroid users in the Hall of Fame, but make an exception for Bonds who was clearly a Hall of Famer prior to his steroid use and was statistically significantly better than his steroid counterparts. That was my stance for his final year on the BBWAA ballot, which included 394 voters. The 2023 Contemporary Era Committee will consist of just 16 voters. I still think Bonds ought to be in, but I'd rather the first undeniable steroid user that is inducted to be voted in by more people via the BBWAA ballot. Plus, Bonds just had his chance last year on the BBWAA ballot; other worthy and steroid-free candidates on the ballot have had to wait longer for their next chance at the Hall. The current version of Player Value has Bonds at 1,201.08, easily the most of any player since 1974. His Batting Value of 1,015.49 also ranks 1st, while his Fielding Value of 166.82 ranks 77th. Roger Clemens My stance on Clemens is basically exactly what I stated for Bonds above. Statistically, obviously a Hall of Famer, but his steroid use calls him slightly into question. Nontheless, I would have put him on my BBWAA ballot last year. However, I think the larger BBWAA ballot should sort out the steroid users before we let just 16 (or really, only 12) people determine if they should be inducted. The current version of Player Value has Clemens at 555.94, ranking him 2nd among the 6,077 pitchers since 1974. His Pitching Value of 518.04 ranks 1st. Rafael Palmeiro Palmeiro is in the same boat for me as Bonds and Clemens, he just wasn't on the 2022 BBWAA ballot. He is clearly a Hall of Famer when you ignore the steroids, clinching the "automatic" qualifiers of both 500+ home runs and 3000+ hits. Given his steroid use, there are more preferable guys to use for the ballot's limited number of spots. The current version of Player Value has Palmeiro at 329.68, ranking him 61st among players since 1974. His Batting Value of 198.59 ranks 76th. I emphasized the current version of Player Value because it is far from complete, but still, it's not that bad or wrong as is. Most Batting Value since 1974? Barry Bonds. Most Baserunning Value since 1974? Rickey Henderson. Most Fielding Value since 1974? Ozzie Smith. Most Fielding Value among pitchers since 1974? Greg Maddux. Most Pitching Value since 1974? Roger Clemens. My Hypothetical 2023 Contemporary Era Ballot:
The actual 16-person committee members that will vote for this ballot was announced recently, and includes former Braves Hall of Famers Greg Maddux and Chipper Jones, both of whom were teammates with Fred McGriff from 1993 to 1997. Frank Thomas spent 2 years with Alberte Belle on the Chicago White Sox in 1997 and 1998. Lou Whitaker would have been a great candidate to benefit from the committee's makeup given the inclusion of TIgers teammates Jack Morris and Alan Trammel, but alas. Lee Smith and Ryne Sandberg (and Greg Maddux) played some with Rafael Palmeiro on the Cubs in the late '80s before he really burst onto the scene. Needless to say, I think the committee's makeup will certainly benefit McGriff the most. As usual, I'll end with a file dump - My USCLAP paper on my Hall of Fame predictive model:
A PowerPoint presentation I gave on the model:
Dataset of players used:
Datasets for 2022 Golden Days, 2022 BBWAA, and 2023 Contemporary Era ballots:
R files for the initial model and 2022 BBWAA predictions, 2022 Golden Days predictions, and 2023 Contemporary Era predictions:
Adjusted datasets that you'll need to run the 2022 and 2023 era ballot R files above:
And that should be everything you need to dig deeper into or replicate the results. Thank you all for reading! Looking forward to sharing more Player Value findings soon, as well as my model's predictions for the upcoming 2023 BBWAA Hall of Fame ballot. Statting Lineup Newsletter Signup Form:
If you'd like to receive email updates for each new post that I make, sign up for the Statting Lineup newsletter using the link below: https://weebly.us18.list-manage.com/subscribe?u=ab653f474b2ced9091eb248b1&id=3a60f3b85f The 2022 MLB regular season has concluded, allowing for another implementation of my Player Value metric onto a season. If you need to get caught up on what Player Value is, you can read about it in detail here, as well as its important addendum here. I've already done a short write-up on using Batting Value to determine which players should win a Silver Slugger and the Hank Aaron Awards in 2022, which you find here. I've also done a short write-up on using Fielding Value to determine which players should win a Gold Glove and the Platinum Gloves in 2022, which you can find here. If you'd like to view another comprehensive example of applying Player Value to an MLB season, check out my rollout post on the 2010 season here. Those Player Value explanation posts can be a bit of a doozy, so here's a quick summary. A player's offensive and defensive events, such as hitting a HR and recording an out, are measured in terms of their run-value, which are derived based on the event's impact on the probability of a run scoring. These events are measured on a per opportunity basis, such as per plate appearance or per inning, to prevent players that just play more from dominating. By using a rate basis, we can see players that are able to excel, even if for a shorter period of time. Since there is still value in being able to play at a high level for a longer time, however, these per opportunity values are multiplied by the number of opportunities. This is how we balance quality and quantity. Lastly, these amounts are compared to a player's positional first-quartile. By comparing a player to his peers, we avoid the impacts of era, run scoring environment, and positional adjustments. We compare a player to his position's first-quartile because being worse than that amount means the player was one of the bottom 25% of players at his position. This is like how WAR compares to replacement level, but with this we have actual relative values based on data rather than the sort of backed-into solution that WAR's replacement level is. Here's a quick reminder of the run value weights for the relevant pitching events: non-Home Run Hit: -.37 runs Home Run: -1.29 runs Unintentional Walk: -.22 runs Intentional Walk: -.17 runs Hit By Pitch: -.24 runs Sacrifice Bunt: .22 runs Sacrifice Fly: .10 runs Strikeout: .34 runs Groundball Double Play: .75 runs Other Out: .33 runs Wild Pitch: -.26 runs Balk: -.25 runs Here's a quick reminder of the run value weights for the relevant defensive events: Putout by a non catcher or first baseman: .33 runs Unassisted Putout by a first baseman: .33 runs Non-strikeout Putout by a catcher: .33 runs Assisted Putout by a first baseman: .2*.33 = .066 runs Strikeout Putout by a catcher: .33*.33 = .1089 runs Assist: .8*.33 = .264 runs Error: -.68 runs Double Play: .10 runs Passed Ball: -.26 runs Stolen Base allowed by catcher: -.15 runs Caught Stealing by catcher: .39 runs Here's a quick reminder of the run value weights for the relevant offensive events: Single: .30 runs Double: .58 runs Triple: .91 runs Home Run: 1.29 runs Unintentional Walk: .22 runs Intentional Walk: .17 runs Hit By Pitch: .24 runs Sacrifice Bunt: -.22 runs Sacrifice Fly: -.10 runs Strikeout: -.34 runs Groundball Double Play: -.75 runs Other Out: -.33 runs Player Value is divided into 4 components: Batting Value, Fielding Value, Baserunning Value, and Pitching Value. What each is measuring should hopefully be obvious. Before we dive into dissecting each award, let's take a look at some helpful plots of Player Value for the 2022 season. First, here's Player Value amongst all positions in MLB in 2022:  Higher players are more valuable offensively, as measured by their Batting Value and Baserunning Value. Further right players are more valuable defensively, as measured by their Fielding Value and Pitching Value. It is the sum of these that is total Player Value. The black diagonal line represents the breakeven point, so any player above the black line is providing positive Player Value. The further a player is above the black line, the better he is, and the further a player is below the black line, the worse he is. The green diagonal line represents the top 5% of players according to Player Value. There were 1,495 players in MLB in 2022, so this marks about the top 75 players. You can think of this line as representing an All-Star quality player. The dark green diagonal line represents the top 1% of players according to Player Value. That marks about the top 15 players, so you can think of this line as representing the quality of player that would receive some MVP votes. The red diagonal line represents the bottom 5% of players, while the dark red diagonal line represents the bottom 1% of players. Players this far down need some serious adjustments or need to get axed. To get this far down, you need to not only play poorly, but also play consistently poorly for many games. As the plot kind of shows, it's difficult for a pitcher to have the most Player Value. Pitchers don't bat anymore, taking away a significant way in which to add value to their team, as well as through baserunning. They appear in the field in far fewer innings than position players, also hindering their ability to add value with their glove. They do add value with their pitching, but they divide that pitching role with many other pitchers. It's certainly possible for a pitcher to have the most Player Value, but that would take the combination of an exceptional pitching season (or stellar batting and fielding to go with it) as well as an overall poor season by the league's position players. In 2022, Alcantara had the highest Player Value amongst pitchers, but was 28th overall. In 2010, Felix Hernandez had the highest Player Value amongst pitchers, but was 9th overall. It just depends on the season. Let's take a closer look at some of these plots by position and league. First, here's Player Value among position players in the AL:  Let's do a quick position count. I see a CF/RF in Judge, DHs in Ohtani and Alvarez, more CFs in Trout and Rodriguez, two SS in Bogaerts and Seager, three 2B in Altuve, Semien, and Gimenez, a 3B in Ramirez, and two C in Kirk and Rutschman. That's some solid positional diversity! All we didn't mention was first base, and guess who that pink dot to left of Seager is... Nathaniel Lowe, first baseman for the Texas Rangers. Here's Player Value among position players in the NL:  And where first base was lacking in the AL, we easily identify Goldschmidt and Freeman in the NL. Catchers in Realmuto, Smith, and d'Arnaud, 2B in McNeil and Rodgers, 3B in Machado, Arenado, and Riley, a SS/2B mix in Edman, an outfielder in Betts, etc. The point being: Player Value is not giving any particular position the short end of the stick. Here's Player Value among pitchers in the AL:  This allows us to see how a pitcher's value is divided between his pitching and fielding, a view not possible in the plot of all positions above since pitching and fielding get lumped together. We see here that Justin Verlander's value is almost entirely due to his pitching, and that Zack Greinke is gaining considerable value from his fielding, albeit not enough to make up for his poor pitching. Dylan Cease, on the other hand, is losing value due to his fielding. We see a decent mix of starters and relievers, so neither of those is getting a considerable advantage. And here's Player Value among pitchers in the NL:  We see that Alcantara had a slightly lower Pitching Value than Verlander, but his superior Fielding Value is what places him ahead of Verlander in the Player Value plot for all positions. Patrick Corbin had decent fielding ability, but boy, did that pitching struggle. Again, we see a good mix of starters and relievers. Alright, let's get into these awards, starting with the most controversial one first! MOST VALUABLE PLAYERS AL MVP: Aaron Judge, CF/RF/DH, New York Yankees, 83.72 Player Value Runner-up: Shohei Ohtani, DH/SP, Los Angeles Angels, 68.61 Player Value
Judge photo courtesy of Yanks Go Yard. Ohtani photo courtesy of Fox Sports. Personally, I'd be fine with a 1979-style co-MVP here, but according to Player Value somebody's gotta win, and that somebody is Judge. Judge had an absurd offensive season. His Player Value is dominated by his 79.26 Batting Value. However, he was still able to uphold the defensive standards of CF and RF, recording a Fielding Value of 4.03. His Baserunning Value was okay at 0.43, stealing 16 bases and being caught 3 times. I'm sure we are all well aware of Judge's accomplishments this season. Nearly won a Triple Crown, leading the AL with 131 RBI. New AL single-season HR record of 62. A .311 batting average, .424 on-base percentage, 1.111 OPS, and a .458 wOBA. Led MLB with a wRAA of 82.1, an Rbat of 80, an expected wOBA of .463, an fWAR of 11.4 and a bWAR of 10.6. In terms of what matters for Player Value, Judge notably got you about 47 more homers, 2 more doubles, 5 less singles, 5 more stolen bases, 49 more unintentional walks, 19 more intentional walks, 44 more strikeouts, 73 less other outs, 6 more putouts, 2 more assists, and 2 less errors. He simply had an incredible season, well deserving of the AL MVP. Two-way phenom Shohei Ohtani also had an amazing season. As a DH, Ohtani had the 2nd highest Batting Value in MLB (behind Judge) at 59.82 and the 3rd most Player Value, 2nd in the AL (behind Judge), at 57.01. He lost some due to his poor Baserunning Value of -2.81, the worst in all of MLB. Ohtani had 11 steals but was caught 9 times, and in case you haven't heard, caught stealings are much more detrimental than stolen bases are valuable. Ohtani had an Rbat of 31 and a wRAA of 31.7, which rank 14th and 12th in MLB, respectively. His position-player fWAR was 3.8 and his position-player bWAR was 3.4. In terms of what matters for Player Value, Ohtani got you about 20 more homers, 10 more doubles, 6 more triples, 16 more singles, 5 more steals, 9 more caught stealings, 13 more unintentional walks, 75 less strikeouts, 13 more intentional walks, 6 less groundball double plays, and 53 more other outs. Note that Ohtani's fielding gets lumped in with his pitching, not his DHing, so we'll discuss that later. You may be wondering how Ohtani scores better than fellow DH Yordan Alvarez, despite Alvarez's better offensive numbers and their similar positions. For one, Alvarez was only 58% a DH, also being 42% a LF, so Alvarez himself isn't a perfect DH comparison. For another, Ohtani was 15% a pitcher, who have 0 Batting Value. Essentially the DH positional first-quartile for Ohtani is getting scaled down by .85. For me, the jury is up on this decision. Maybe we should only consider Ohtani's time as a DH when considering his batting; but also, should we really expect a 15% P and 85% DH to provide the same offensive output as a 100% DH? As a pitcher, Ohtani had the 16th highest Pitching Value in MLB at 12.73 and the 6th most in the AL. He had a somewhat poor Fielding Value of -1.13, making his Player Value of 11.60 the 24th most in MLB among pitchers. Ohtani logged 166 innings with 219 strikeouts, an ERA of 2.33, a WHIP of 1.012, and a a FIP of 2.40. He had the 6th lowest ERA and 3rd lowest FIP in MLB among qualified pitchers, and led the AL in strikeouts per 9 innings with 11.87. His bWAR as a pitcher was 6.1 and his fWAR as a pitcher was 5.6. In terms of what matters for Player Value, Ohtani allowed about 3 less nonHR hits, 7 more unintentional walks, 78 more strikeouts, 12 more wild pitches, 2 less hit by pitches, and 35 less other outs than the first-quartile starting pitcher. Defensively, he got you 1 more putout and 5 less assists. Ohtani was truly one of the best hitters and pitchers in baseball, but these are just 2 components of Player Value. Truthfully, even combining the very best primarily DH and the very best primarily pitcher still wouldn't catch Judge. Alvarez's 47.38 Batting Value and Verlander's 24.78 Pitching Value combine to 72.16, still about 11 short of Judge. We see that Ohtani is just about 4 less than this combined player, and he's just one guy. Furthermore, Ohtani is losing some value on the bases and with his glove. If instead of having about -3 Baserunning Value he were say, Myles Straw of the Cleveland Guardians who went 21/1 with his SB/CS for a 1.81 Baserunning Value, then Ohtani would be up to 70.42. If instead of having about -1 Fielding Value he were say, Zack Greinke of the Kansas City Royals who had a 7.53 Fielding Value, then Ohtani would be up to 79.08. If instead of having about 13 Pitching Value he were Verlander, then Ohtani would be up to 91.13. So if we take the 2nd best AL batter and combine it with the best AL pitcher, baserunner, and fielding pitcher, we can finally top Judge. As great as Ohtani was, he wasn't that. But if he could have been a better base stealer, fielder, and not thrown so many wild pitches, things could have been real close. A quick note about the value of being two-way: for one, Ohtani isn't entirely the starting pitcher that we think he is. The Angels use a 6-man rotation, not the standard 5-man. Ohtani needs the extra guy in there to be able to rest up properly. Tom Tango and WAR have dismissed the value of the extra roster spot as a rounding error, just about 0.1 or 0.2 of WAR. I agree that the roster spot is inconsequential for this race, as the roster spot is probably worth just about 2 Player Value. NL MVP: Paul Goldschmidt, 1B/DH, St. Louis Cardinals, 75.07 Player Value Runner-up: J.T. Realmuto, C, Philadelphia Phillies, 56.48 Player Value  Goldschmidt photo courtesy of Sports Illustrated. This race has been less contentious, and rightly so. Goldschmidt seemed to be more of a favorite throughout the season as he also competed for a Triple Crown, with his .317 batting average finishing 3rd in the NL among qualified batters, his 35 HR finishing 5th in the NL, and his 115 RBI finishing 2nd in the NL. He had a decent Player Value split, with 45.59 Batting Value and 28.49 Fielding Value, leading his position in both. He's got an fWAR of 7.1 and a bWAR of 7.8, the 3rd most in the NL in both. The main Player Value challenger was Realmuto, but the main WAR challengers are third basemen Nolan Arenado and Manny Machado, as well as pitcher Sandy Alcantara. Alcantara's Player Value was 27.30, which was the most in the NL for pitchers, but well behind Goldschmidt. Machado is at 22.87 and Arenado is at 35.89, both solid, but also well behind Goldschmidt. Why the big differences? For Player Value, everything is relative to your position. If I lost Alcantara and had to swap him with a "meh" starting pitcher, how worse would I be? How worse would I be if I had to swap Machado or Arenado with a bottom 25% third baseman? How about if I had to swap Goldschmidt or Realmuto? Here are these guys' OPS and wOBA comparisons relative to their positional first-quartile: Goldschmidt: .981 vs .711, .419 vs .311 Realmuto: .820 vs .604, .354 vs .270 Machado: .898 vs .695, .382 vs .304 Arenado: .891 vs .694, .381 vs .304 Here are these guys' FP% and RF9 comparisons relative to their positional first-quartile: Goldschmidt: .999 vs .992, 9.48 vs 8.07 Realmuto: .993 vs .992, 9.54 vs 8.59 (also .4412 vs .2023 CS%) Machado: .966 vs .961, 2.44 vs 2.65 Arenado: .968 vs .961, 2.95 vs 2.65 So I don't care that Machado and Arenado are better hitters than Realmuto in an absolute sense, because they play different positions. Realmuto's Player Value was also very well split, with 30.55 Batting Value, 23.19 Fielding Value, and even 2.73 Baserunning Value (21 for 22 on SB as a catcher, holy cow!). Arenado was decently split too, with 23.98 Batting Value and 12.76 Fielding Value. Machado, however, is offensively focused with 26.86 Batting Value and -4.42 Fielding Value. Machado has 7.4 fWAR and 6.8 bWAR. Arenado has 7.3 fWAR and 7.9 bWAR. Realmuto has 6.5 fWAR and bWAR. Some offensive highlight comparisons are that Goldschmidt would get you +17 HR, +16 2B, +23 1B, +32 uBB, and -23 other outs than his first-quartile. Realmuto would get you +13 HR, +23 1B, +21 SB, and +9 HBP. Arenado would get you +15 HR, +17 2B, +12 1B, and -44 SO. Machado would get you +17 HR, +11 2B, +21 1B, and +9 IBB. Some defensive highlight comparisons are that Machado would get you -2 PO, -5 A, +4 E, and +5 DP than his first-quartile. Arenado would get you -9 PO, +65 A, +5 E, and +21 DP. Realmuto would get you +8 non-strikeout PO, +10 A, +5 E, +5 DP, -1 PB, -8 SB, +16 CS, and +112 strikeout PO. Lastly, Goldschmidt would get you +16 unassisted PO, +31 A, -3 E, -36 DP, and +141 assisted PO. CY YOUNGS NL Cy Young: Sandy Alcantara, SP, Miami Marlins, 19.20 Pitching Value Runner-up: Zac Gallen, SP, Arizona Diamondbacks, 18.28 Pitching Value  Alcantara photo courtesy of NBC Miami. This hopefully shouldn't come as too big of a shocker to anyone. Alcantara was 14-9 in about 228 innings pitched with a 2.29 ERA and 2.99 FIP while striking out 207 guys. The first-quartile starter had a 2.89 ERA and a 3.09 FIP. Gallen went 12-4 in 184 innings with a 192 strikeouts, a 2.54 ERA, and a 3.05 FIP. Alcantara has an fWAR of 5.7 and a bWAR of 8.1, while Gallen has an fWAR of 4.3 and a bWAR of 5.1. The main WAR challenger is Aaron Nola of the Phillies, with a 6.3 fWAR and a 6.0 bWAR. Nola finished with a Pitching Value of 14.25, the 7th most in the NL. Also ahead of him were Tony Gonsolin, Spencer Strider, Carlos Rodon, and Max Fried. Nola went 11-13 in 205 innings, striking out 235 with an ERA of 3.25 and a FIP of 2.58. Alcantara got you +14 SO, -2 uBB, +4 HBP, +7 GIDP, +15 other outs, +2 nonHR hits, and -4 HR. Gallen got you +36 SO, +6 uBB, +8 HBP, +1 GIDP, +1 other outs, -20 nonHR hits, -1 HR, and +3 WP. Nola got you +61 SO, -18 uBB, +4 HBP, -3 GIDP, -8 other outs, +9 nonHR hits, and +1 HR. AL Cy Young: Justin Verlander, SP, Houston Astros, 24.78 Pitching Value Runner-up: Emmanuel Clase, CP, Cleveland Guardians, 18.05 Pitching Value  Verlander photo courtesy of Bleacher Report. This also probably doesn't come as too big of a surprise. Verlander went 18-4 in 175 innings with 185 strikeouts, a 1.75 ERA, and a 2.49 FIP. Clase was the best reliever in MLB, and also the best reliever that Player Value has examined thus far (that is to say, better than all of the 2010 relievers in Pitching Value, as well). He went 3-4 with 42 saves in 72 innings with 77 strikeouts, a 1.37 ERA, and a 1.98 FIP. Recall that while the first-quartile starter ERA was 2.89 and FIP was 3.09, the first-quartile reliever ERA was 2.78 and FIP was 3.03. Verlander has an fWAR of 6.1 and a bWAR of 5.9, while Clase has an fWAR of 2.4. and a bWAR of 2.8. Clase has the 2nd highest fWAR among relievers, and the most in the AL, but doesn't even reach the top 30 of starters. The fact that he came in 2nd here is what I believe to be a testament to Player Value's ability to not be biased towards certain positions. fWAR loves Kevin Gausman as the runner-up at 5.7, whom Pitcher Value disagrees strongly with at -4.73 (bWAR has him at 3.0). bWAR loves Dylan Cease as the favorite at 6.1, whom Pitcher Value has at 10.26 (fWAR has him at 4.4). Cease went 14-8 in 184 innings with 227 strikeouts, an ERA of 2.20, and a FIP of 3.10. Gausman went 12-10 in 174 innings with 205 strikeouts, an ERA of 3.36, and a FIP of 2.38. Verlander got you +37 SO, -10 uBB, -2 GIDP, +7 other outs, -15 nonHR hits, and -3 HR. Clase got you +13 SO, -11 uBB, +6 GIDP, +11 other outs, -6 nonHR hits, -1 HR, and +3 WP. Cease got you +71 SO, +35 uBB, -6 GIDP, -20 other outs, -16 nonHR hits, +0 HR, and +5 WP. Gausman got you +57 SO, -11 uBB, -1 GIDP, -20 other outs, +54 nonHR hits, +0 HR. Gausman grades poorly because he got raked within the park, even if he did strike out a lot of guys, didn't allow many homers, and didn't allow a lot of walks, as shown by his low FIP. While we may be quick to jump the gun and blame this on defense because of the ERA and FIP difference, a better approach is to rely on Baseball Savant's OAA behind-the-pitcher measures, which you can view here. RELIEVERS OF THE YEAR Mariano Rivera AL Reliever of the Year: Emmanuel Clase, CP, Cleveland Guardians, 18.05 Pitching Value Runner-up: Jason Adam, RP, Tampa Bay Rays, 11.19 Pitching Value  Clase photo courtesy of Cleveland.com Clase led all MLB relievers and finished 2nd in the AL among pitchers in general with his Pitching Value. Again, he went 3-4 with 42 saves in 72 innings with 77 strikeouts, a 1.37 ERA, and a 1.98 FIP. Recall that the first-quartile reliever ERA was 2.78 and FIP was 3.03. Clase has an fWAR of 2.4, the 2nd highest fWAR among relievers, and a bWAR of 2.8. Adam went 2-3 in 63 innings and recorded 8 saves. Baseball Reference technically lists him as the Rays' closer, but the Rays don't really follow the 'closer' philosophy. They had another guy with 7 saves and someone else with 6 saves. Adam struck out 75 with a 1.57 ERA and a 2.86 FIP. His bWAR was 2.6 and his fWAR was 2.2. Clase got you +13 SO, -11 uBB, +6 GIDP, +11 other outs, -6 nonHR hits, -1 HR, and +3 WP. Adam got you +19 SO, -2 uBB, +5 GIDP, -6 other outs, -15 nonHR hits, +1 HR, and +5 HBP Trevor Hoffman NL Reliever of the Year: Ryan Helsley, CP, St. Louis Cardinals, 12.84 Pitching Value Runner-up: Evan Phillips, RP, Los Angeles Dodgers, 12.73 Pitching Value  Helsley photo courtesy of The Athletic. Helsley had the 2nd highest Pitching Value in MLB, while Phillips finished 3rd. Helsley went a stellar 9-1 with 94 strikeouts and 19 saves in 64 innings, to go with a 1.26 ERA and a 2.33 FIP. Recall that the first-quartile reliever ERA was 2.78 and FIP was 3.03. His bWAR was 2.7 and his fWAR was 2.0. Phillips went a solid 7-3 with 77 strikeouts and 2 saves in 63 innings, while having a 1.14 ERA and a 1.94 FIP. His bWAR was 2.8 and his fWAR was 2.2. Helsley got you +37 SO, +2 uBB, -19 nonHR hits, +2 HR, -1 HBP, -0 GIDP, and -11 other outs Phillips got you +21 SO, -3 uBB, -9 nonHR hits, -2 HR, +2 HBP, +1 GIDP, and -4 other outs ROOKIES OF THE YEAR AL RoY: Julio Rodriguez, CF, Seattle Mariners, 40.83 Player Value Runner-up: Adley Rutschmann, C/DH, Baltimore Orioles, 23.32 Player Value  Photo courtesy of Lookout Landing. Rodriguez has had a tremendous first season, finishing 2nd in MLB and the AL in Player Value among CF. He was also the 4th best OF in MLB, and the 14th best player in MLB overall. Julio was well-rounded, with 25.26 Batting Value and 15.93 Fielding Value, good enough to what should win him the AL Gold Glove for CF. Julio had a bWAR of 6.0 and an fWAR of 5.3. Rutschman also had a solid rookie campaign, finishing 8th in MLB and 3rd in the AL in Player Value among C. He was more one-dimensional, with a -2.50 Fielding Value but a 25.27 Batting Value, good enough to what should win him the AL Silver Slugger for C. Adley had a bWAR of 5.2 and an fWAR of 5.3. Julio had an OPS of .853 compared to a first-quartile of .621, and a wOBA of .366 vs a first-quartile of .280. Adley had an OPS of .806 vs a first-quartile of .609, and a wOBA of .354 vs a first-quartile of .273. As their Batting Values show, they were very comparable offensively. Defensively, Adley's fielding percentage comparisons are .989 vs .992, while Julio's are .984 vs .990. Adley's RF9 comparisons are 8.33 vs 8.60, while Julio's are 2.88 vs 2.41. Julio made more outs than Rutschman, relative to his position. NL RoY: Nolan Gorman, 2B/DH, St. Louis Cardinals, 26.95 Player Value Runner-up: Brendan Donovan, 2B/3B/RF/LF/1B/DH/SS, St. Louis Cardinals, 26.22 Player Value  Photo courtesy of Redbird Rants. A pair of Cardinals rookies lead the NL according to Player Value, while most people and WAR probably expect a pair of Braves rookies to be leading the way. Braves SP Spencer Strider led all rookie pitchers in MLB and the NL with a Player Value of 18.20, finishing 6th in MLB and 4th in the NL among rookies. Braves CF Michael Harris II finished 9th in MLB and 6th in the NL among rookies with a Player Value of 12.36. Finishing ahead of the Braves duo but behind the Cardinals duo was Pirates rookie SS Oneil Cruz, with a Player Value of 20.30. FanGraphs WAR has Harris and Strider at 4.9, Donovan at 2.7, Cruz at 1.2, and Gorman at 0.5. Baseball Reference WAR has Harris at 5.3, Donovan at 4.1, Strider at 3.7, Cruz at 2.3, and Gorman at 0.7. So, why the disparity with Player Value? Let's quickly dig into the details. First, how does Player Value think these players are good? Here are the Batting Value and Fielding Values for the NL rookies in question, with the Pitching Value and Fielding Value for Strider: Gorman: 2.63 Batting Value, 24.24 Fielding Value Donovan: 8.93 Batting Value, 18.38 Fielding Value Cruz: 3.96 Batting Value, 16.97 Fielding Value Strider: 17.50 Pitching Value, 0.70 Fielding Value Harris: 17.88 Batting Value, -6.79 Fielding Value Just like it is difficult for a pitcher to win the MVP under Player Value, it is difficult for a rookie pitcher to win the Rookie of the Year under Player Value. While Strider can add value pitching to make up for the fact that he doesn't bat, he spends considerably less time in the field, preventing him from accumulating as much Fielding Value as his fellow rookies. So Gorman and Cruz are defense heavy, Donovan is pretty split, and Harris is offense heavy. Statcast disagrees on Gorman and Cruz, measuring them at -12 and -9 OAA. Donovan is measured at -3 OAA, while Harris is at 7 OAA. Rfield has Gorman at -6, Donovan at 9, Cruz at 1, and Harris at 8. fWAR has Gorman's Fielding Runs at -8, Donovan at -3.7, Cruz at -5.2, and Harris at 7. When discussing Player Value, it is imperative that we understand the impact that a player's position has. On an absolute scale, Gorman clearly wasn't the best rookie batter. Harris had an OPS of .853 and a wOBA of .368, and the first-quartile CF had an OPS of .621 and a wOBA of .280. Gorman had both a lower OPS and wOBA at .721 and .316, compared to 2B first-quartiles of .681 vs .302. So Harris was the better batter both absolutely and relative to his position, hence his higher Batting Value. But what about fielding? Gorman had a .9750 fielding percentage vs his position's first-quartile of .9761, but his RF9 comparison was 5.05 vs 3.67. Harris had a fielding percentage comparison of .9920 vs .9903, but an RF9 comparison of 2.25 vs 2.41. So Harris did better at making the balls surely hit his way, but Gorman did a better job of making additional plays. Now I will dive into 1st-team and 2nd-team selections for both the AL and NL, as well as MLB overall. Each starting position gets one spot, besides pitchers. Starting pitchers get 5 spots, as is the usual rotation size. Relief pitchers get two spots, and closers get one spot. I've also added a miscellaneous spot for safety, which will be used by diverse outfielders that didn't play at least 50% of their games at one outfield position, utility players that didn't play at least 50% of their games at any one position, outfielders that finish in the top 6 among all outfielders but not among the top 2 in a specific outfield position, or relievers/closers that finish in the top 6 among relievers/closers but not among the top 4 relievers or top 2 closers. The flexibility is intended so that every year there's hopefully at least somebody that qualifies, and this prevents worthy guys from being left out. This safety spot will only be used for the NL and AL teams. For the MLB, I'll put the safety player where I think makes the most sense, if he qualifies. FIRST-TEAM AL C: Alejandro Kirk, Toronto Blue Jays, 32.11 Player Value 1B: Nathaniel Lowe, Texas Rangers, 28.47 Player Value 2B: Andres Gimenez, Cleveland Guardians, 54.81 Player Value 3B: Rafael Devers, Boston Red Sox, 30.45 Player Value SS: Xander Bogaerts, Boston Red Sox, 43.28 Player Value LF: Steven Kwan, Cleveland Guardians, 15.82 Player Value CF: Mike Trout, Los Angeles Angels, 44.96 Player Value RF: Taylor Ward, Los Angeles Angels, 27.02 Player Value DH: Shohei Ohtani, Los Angeles Angels, 57.01 Player Value SP1: Justin Verlander, Houston Astros, 24.91 Player Value SP2: Framber Valdez, Houston Astros, 14.65 Player Value SP3: Nestor Cortes, New York Yankees, 14.45 Player Value SP4: Alek Manoah, Toronto Blue Jays, 14.02 Player Value SP5: Shane Bieber, Cleveland Guardians, 14.01 Player Value RP1: Jimmy Herget, Los Angeles Angeles, 10.91 Player Value RP2: Jason Adam, Tampa Bay Rays, 10.83 Player Value CP: Emmanuel Clase, Cleveland Guardians, 20.64 Player Value Misc: Aaron Judge, New York Yankees, 83.72 Player Value Judge was 44% a CF, 41% a RF, and 14% a DH. He was the best player in all of MLB, but gets the miscellaneous spot since he didn't play at least 50% of his games at one specific position. SECOND-TEAM AL C: Cal Raleigh, Seattle Mariners, 27.77 Player Value 1B: Anthony Rizzo, New York Yankees, 17.79 Player Value 2B: Marcus Semien, Texas Rangers, 46.63 Player Value 3B: Jose Ramirez, Cleveland Guardians, 29.20 Player Value SS: Corey Seager, Texas Rangers, 31.86 Player Value LF: Andrew Benintendi, Kansas City Royals & New York Yankees, 10.14 Player Value CF: Julio Rodriguez, Seattle Mariners, 40.83 Player Value RF: Kyle Tucker, Houston Astros, 18.15 Player Value DH: Yordan Alvarez, Houston Astros, 45.79 Player Value SP1: Shane McClanahan, Tampa Bay Rays, 12.35 Player Value SP2: Shohei Ohtani, Los Angeles Angels, 11.60 Player Value SP3: Ross Stripling, Toronto Blue Jays, 9.27 Player Value SP4: Cristian Javier, Houston Astros, 9.06 Player Value SP5: Jeffrey Springs, Tampa Bay Rays, 8.41 Player Value RP1: John Schreiber, Boston Red Sox, 10.37 Player Value RP2: Wandy Peralta, New York Yankees, 10.36 Player Value CP: Clay Holmes, New York Yankees, 10.80 Player Value Misc: Byron Buxton, Minnesota Twins, 24.06 Player Value Buxton was the 5th best outfielder in the AL, but the 3rd best CF in the AL. He gets the miscellaneous spot since he was better than Benintendi, but didn't play any LF. Also note Shohei's impressive feat of being on both the first and second team for the AL. FIRST-TEAM NL C: J.T. Realmuto, Philadelphia Phillies, 56.48 Player Value 1B: Paul Goldschmidt, St. Louis Cardinals, 75.07 Player Value 2B: Jeff McNeil, New York Mets, 41.12 Player Value 3B: Nolan Arenado, St. Louis Cardinals, 35.89 Player Value SS: Francisco Lindor, New York Mets, 28.74 Player Value LF: Ian Happ, Chicago Cubs, 17.12 Player Value CF: Bryan Reynolds, Pittsburgh Pirates, 17.04 Player Value RF: Mookie Betts, Los Angeles Dodgers, 46.44 Player Value DH: Albert Pujols, St. Louis Cardinals, 21.53 Player Value SP1: Sandy Alcantara, Miami Marlins, 27.30 Player Value SP2: Max Fried, Atlanta Braves, 21.36 Player Value SP3: Zac Gallen, Arizona Diamondbacks, 20.51 Player Value SP4: Corbin Burnes, Milwaukee Brewers, 19.94 Player Value SP5: Tony Gonsolin, Los Angeles Dodgers, 19.68 Player Value RP1: Evan Phillips, Los Angeles Dodgers, 14.61 Player Value RP2: Brusdar Graterol, Los Angeles Dodgers, 11.20 Player Value CP: Ryan Helsley, St. Louis Cardinals, 14.54 Player Value Misc: Tommy Edman, St. Louis Cardinals, 52.08 Player Value Edman's position distribution was 49% 2B, 4% 3B, 44% SS, 1% CF, 1% RF, and 2% DH. He was one of the best players in MLB and the NL, but since he didn't play at least 50% of the time at one specific position, he gets the miscellaneous spot. SECOND-TEAM NL C: Will Smith, Los Angeles Dodgers, 38.39 Player Value 1B: Freddie Freeman, Los Angeles Dodgers, 41.70 Player Value 2B: Brendan Rodgers, Colorado Rockies, 40.40 Player Value 3B: Manny Machado, San Diego Padres, 22.87 Player Value SS: Oneil Cruz, Pittsburgh Pirates, 20.30 Player Value LF: Joc Pederson, San Francisco Giants, 11.62 Player Value CF: Michael Harris II, Atlanta Braves, 12.36 Player Value RF: Juan Soto, Washington Nationals & San Diego Padres, 37.03 Player Value DH: Bryce Harper, Philadelphia Phillies, 18.24 Player Value SP1: Logan Webb, San Francisco Giants, 18.60 Player Value SP2: Tyler Anderson, Los Angeles Dodgers, 18.57 Player Value SP3: Spencer Strider, Atlanta Braves, 18.20 Player Value SP4: Carlos Rodon, San Francisco Giants, 14.88 Player Value SP5: Aaron Nola, Philadelphia Phillies, 14.09 Player Value RP1: Devin Williams, Milwaukee Brewers, 9.62 Player Value RP2: Collin McHugh, Atlanta Braves, 7.85 Player Value CP: Edwin Diaz, New York Mets, 10.36 Player Value Misc: Brendan Donovan, St. Louis Cardinals, 26.22 Player Value Donovan's position distribution was 11% 1B, 26% 2B, 21% 3B, 5% SS, 13% LF, 14% RF, and 11% DH. Since he didn't play at least 50% of the time at one specific position, he gets the miscellaneous spot. Edwin Diaz's brother, Alexis Diaz of the Cincinnati Reds, was the 6th best relief pitcher in the NL with an 8.37 Player Value, but he was technically the Reds' closer, despite recording just 10 saves. Williams did takeover closer duties for the Brewers after they traded Josh Hader to the Padres, but Hader was their main closer for the season. FIRST-TEAM MLB C: J.T. Realmuto, Philadelphia Phillies, 56.48 Player Value 1B: Paul Goldschmidt, St. Louis Cardinals, 75.07 Player Value 2B: Andres Gimenez, Cleveland Guardians, 54.81 Player Value 3B: Nolan Arenado, St. Louis Cardinals, 35.89 Player Value SS: Tommy Edman, St. Louis Cardinals, 52.08 Player Value LF: Yordan Alvarez, Houston Astros, 45.79 Player Value CF: Aaron Judge, New York Yankees, 83.72 Player Value RF: Mookie Betts, Los Angeles Dodgers, 46.44 Player Value DH: Shohei Ohtani, Los Angeles Angels, 57.01 Player Value SP1: Sandy Alcantara, Miami Marlins, 27.30 Player Value SP2: Justin Verlander, Houston Astros, 24.91 Player Value SP3: Max Fried, Atlanta Braves, 21.36 Player Value SP4: Zac Gallen, Arizona Diamondbacks, 20.51 Player Value SP5: Corbin Burnes, Milwaukee Brewers, 19.94 Player Value RP1: Evan Phillips, Los Angeles Dodgers, 14.61 Player Value RP2: Brusdar Graterol, Los Angeles Dodgers, 11.20 Player Value CP: Emmanuel Clase, Cleveland Guardians, 20.64 Player Value Since Judge was mainly a CF and RF, and Betts had a higher Player Value than Trout, Judge gets the CF spot and Trout gets demoted to the 2nd team. The best primarily LF, Ian Happ, has a substantially lower Player Value than his other outfield leaders. Alvarez spent 42% of his time in LF, and has the 9th highest Player Value overall, so getting him on the 1st-team made sense. Since Edman played mainly 2B and SS and has a higher Played Value than Gimenez and Bogaerts, and since Gimenez had a higher Player Value than Bogaerts, I put Edman in the SS spot. SECOND-TEAM MLB C: Will Smith, Los Angeles Dodgers, 38.39 Player Value 1B: Freddie Freeman, Los Angeles Dodgers, 41.70 Player Value 2B: Marcus Semien, Texas Rangers, 46.63 Player Value 3B: Rafael Devers, Boston Red Sox, 30.45 Player Value SS: Xander Bogaerts, Boston Red Sox, 43.28 Player Value LF: Jeff McNeil, New York Mets, 41.12 Player Value CF: Mike Trout, Los Angeles Angels, 44.96 Player Value RF: Juan Soto, Washington Nationals & San Diego Padres, 37.03 Player Value DH: Alejandro Kirk, Toronto Blue Jays, 32.11 Player Value SP1: Tony Gonsolin, Los Angeles Dodgers, 19.68 Player Value SP2: Logan Webb, San Francisco Giants, 18.60 Player Value SP3: Tyler Anderson, Los Angeles Dodgers, 18.57 Player Value SP4: Spencer Strider, Atlanta Braves, 18.20 Player Value SP5: Carlos Rodon, San Francisco Giants, 14.88 Player Value RP1: Jimmy Herget, Los Angeles Angeles, 10.91 Player Value RP2: Jason Adam, Tampa Bay Rays, 10.83 Player Value CP: Ryan Helsley, St. Louis Cardinals, 14.54 Player Value As mentioned above, due to the utility reasons for Judge and Edman, Trout and Bogaerts get sent to the 2nd-team despite being the best primarily CF and SS (respectively) in both the AL and the NL. The 2nd best primarily DH, Alvarez, was promoted to the 1st-team as the LF. Kirk was the best primarily C in the AL, and 5th best primarily C in MLB overall, but spent 40% of his time at DH, so he gets the 2nd-team DH spot. McNeil was the the 3rd best primarily 2B, but spent 22% of his time at LF, so he gets the 2nd-team LF spot. Happ gets demoted despite being the best primarily LF in both leagues, as McNeil was easily the superior player. Guys like Julio Rodriguez and Taylor Ward were clearly better players than Happ overall, but unfortunately didn't play enough LF to justify putting them in that spot, and were both worse than McNeil overall. TOP 25 MLB PLAYERS
PLAYER VALUE BY POSITION And now we will finally wrap everything up, showing that total Player Value is not particularly biased towards any certain position. Here are the boxplots of Player Value by position:  Shohei naturally gets his own spot for his unique two-way talents, but technically so too does... Pablo Reyes? He played in just 5 games for the Brewers in 2022, 3 as a SS, 2 as a 3B, and 1 as a RP. That's why we see him here; at least 50% of his games at SS, and at least 15% of his games as a pitcher. Leftfielders were particularly down this year, but this is not the case for Player Value in general, as Josh Hamilton, Carl Crawford, and Matt Holliday all ranked very high in the 2010 example. PLAYER VALUE BY TEAM Since a team's Player Value correlates well with its run differential per game, then we'd expect that the teams that have players with the most Player Value will be the ones that have the highest run differentials. Recall from my original Player Value post that Batting Value Average and Baserunning Value Average can describe 92.37% of a team's runs scored per game, while Fielding Value Average and Pitching Value Average can describe 86.1% of a team's runs allowed per game. These should also be the teams that win the most, since run differential per game correlates well with winning percentage (wins per game). Run differential per game can describe 89.31% of a team's winning percentage. Here are the boxplots and summary statistics of Player Value by team in 2022:   Feel free to compare these side by side with the 2022 MLB standings here. I spot the Braves, Guardians, Astros, Dodgers, and Yankees as having higher box plots, denoting a higher average Player Value. Weren't these teams good? I also spot the Reds, Royals, Marlins, Athletics, Pirates, and Rangers as having lower box plots, denoting a lower average Player Value. Weren't these teams bad? Player Value seems to uphold its ability to correlate with a team's ability to win. The Nationals' box plot doesn't seem as low as it should be given their record, but look at those outliers on the low end! Sure enough, we see they have the lowest mean Player Value. The Cardinals' box plot doesn't seem as high as it should be given their record, but look at those outliers on the high end! Sure enough, we see they have a high mean Player Value. Looks like the Giants were the team with the highest mean Player Value but the worst record, at 81-81. Here is the run differential per game by team in 2010:  Not surprising, we see that the Braves, Astros, Dodgers, Mets, Yankees, and Cardinals had high run differentials, and were good in 2022. I didn't explicitly mention the Mets above, but if you look at their box plot you'll see that it was higher. Similarly, we see that the Reds, Rockies, Tigers, Royals, Athletics, Pirates, and Nationals had low run differentials, and were bad in 2022. I didn't explicitly mention the Rockies above, but if you look at their box plot you'll see that it was lower. The Tigers' box plot actually appears somewhat middle-of-the-pack, but they are also the only team without an outlier on the upper end, and have several outliers on the lower end. Here is the win differential by team in 2010:  Again, we see that the Braves, Astros, Dodgers, Mets, and Yankees were the winningest teams. The Mets won more than their run differential would suggest, and the Cardinals won less than their run differential would suggest. We also see that the Reds, Rockies, Tigers, Royals, Athletics, Pirates, and Nationals were the least winningest teams. The Rangers lost more than their run differential would suggest, as did the Athletics. The Rockies lost less than their run differential would suggest. The fact that the Giants had a positive run differential but a .500 record explains why Player Value was slightly off for them. The setup is Player Value --> Run Differential --> Winning Percentage, so if we see a disconnect between Player Value & Winning Percentage, it could be because of unique Run Differential to Winning Percentage disconnects, rather than Player Value being necessarily wrong. I hope I have been able to show the value of Player Value as a metric! Player Value is measured in runs. Teams with a higher average Player Value are generally the same teams with higher run differentials and higher winning percentages. Teams with a lower average Player Value are generally the same teams with lower run differentials and lower winning percentages. If you want to be good, grab those guys with higher Player Values, and dump those guys with lower Player Values! FILES The below files show the players that were used for the first-quartile calculation for each position:
The files below show the first-quartile values for position players and pitchers, respectively:
The files below is the "master file" for position players. It shows the stats and Player Value components for all position players, and also divides players into their respective positions on different tabs. First-team guys are highlighted green, and second-team guys are highlighted light green. Silver Slugger and Hank Aaron Award winners are highlighted in silver, while Gold Glove and Platinum Glove winners are highlighted in gold.
This file is the equivalent "master file" for pitchers. It shows the stats and Player Value components for all pitchers, and all divides pitchers into starters and relievers on different tabs. First-team guys are highlighted green, and second-team guys are highlighted light green. Gold Glove winners are highlighted in gold, while Cy Young and Reliever of the Year winners are also highlighted in green.
This file combines the Player Value components of the position players and the pitchers. This is how you'll see who your top 25 players overall are. Most Valuable Player winners are highlighted in green. Platinum Glove winners are highlighted in gold, while Hank Aaron Award winners are highlighted in silver. Rookies are placed on a separate tab, with the Rookie of the Year winners highlighted in green.
These are the files used to obtain the stats for each player, courtesy of Baseball Reference. You can also find this data online on Baseball Reference. Player batting data here. Player fielding data here. Pitcher data here. Catcher fielding here. Pitcher batting against data here. Player game appearances data here. Team standings here. For all of these, I scrolled down to the player table (such as Player Standard Batting), hit Hide Partial Rows, hit Share & Export, hit Get table as CSV (for Excel), copied the data into Excel, used Excel's Text to Columns feature, and then saved the resulting file.
The first two R files below for position players and pitchers were used to do all of the calculations for Player Value for 2022, while the third R file below combined the Player Values of position players and pitchers:
The Yearly wOBA Weights workbook is read in by the R files, so it is needed as well. It is essentially just a download from the FanGraphs Guts! page, which you can find here.
One last thing - think that the 25% baseline is too low or high? Well, the R files above are equipped to easily change the baseline level to your liking. Just change the baselineLevel variable at the beginning to your liking. For example, here is how the position players and pitchers look if a baseline level of 10% is used instead:
The results are very similar. Judge should still be the AL MVP, and Goldschmidt should still be the NL MVP. Verlander and Alcantara should still win the AL and NL Cy Youngs. The Platinum Glove and Hank Aaron Award winners are the same, too. Julio and Gorman should still be the AL and NL Rookies of the Year. Anyone that is in the negatives here is in the bottom 10% of their position. Thank you all for reading. Previously I've been using the Lahman Dataset for the player data. It probably won't be updated for 2022 until next Spring, so I had to pull the data from Baseball Reference to get this season done quickly. Baseball Reference has more data than Lahman, but my Player Value files aren't updated to work with the additional data. I plan to incorporate this extra data - such as more specific baserunning, batting against for pitchers, and better measurements of opportunity for fielders - into Player Value soon. If these updates lead to any substantial changes in Player Value, I'll update this post accordingly or make another one. As always, feel free to comment any thought you have. Statting Lineup Newsletter Signup Form:
If you'd like to receive email updates for each new post that I make, sign up for the Statting Lineup newsletter using the link below: https://weebly.us18.list-manage.com/subscribe?u=ab653f474b2ced9091eb248b1&id=3a60f3b85f In my last post, I applied the Batting Value portion of my Player Value metric on the 2010 season to determine which players should have won the Silver Slugger and Hank Aaron awards, which you can read about here. In the post before that, I applied the Fielding Value portion of my Player Value metric on the 2010 season to determine which players should have won the Gold Glove and Platinum Glove awards, which you can read about here. You can read about my Player Value metric in general here, as well as its important addendum here. In this post, I will complete the example rollout of my Player Value metric on the 2010 season. I will begin by looking at Pitching Value to determine which players should have won the Cy Young and Reliever of the Year awards in both leagues. I will then look at overall Player Value to determine which players should have won the Rookie of the Year and Most Valuable Player awards in both leagues. In lieu of All-Star appearances, which require midseason data, I will also determine First-Team and Second-Team honors at each position in both leagues and the MLB according to Player Value. Here's a quick reminder of the run value weights for the relevant pitching events: non-Home Run Hit: -.37 runs Home Run: -1.29 runs Unintentional Walk: -.22 runs Intentional Walk: -.17 runs Hit By Pitch: -.24 runs Sacrifice Bunt: .22 runs Sacrifice Fly: .10 runs Strikeout: .34 runs Groundball Double Play: .75 runs Other Out: .33 runs Wild Pitch: -.26 runs Balk: -.25 runs Here's a quick reminder of the run value weights for the relevant defensive events: Putout by a non catcher or first baseman: .33 runs Unassisted Putout by a first baseman: .33 runs Non-strikeout Putout by a catcher: .33 runs Assisted Putout by a first baseman: .2*.33 = .066 runs Strikeout Putout by a catcher: .33*.33 = .1089 runs Assist: .8*.33 = .264 runs Error: -.68 runs Double Play: .10 runs Passed Ball: -.26 runs Stolen Base allowed by catcher: -.15 runs Caught Stealing by catcher: .39 runs Here's a quick reminder of the run value weights for the relevant offensive events: Single: .30 runs Double: .58 runs Triple: .91 runs Home Run: 1.29 runs Unintentional Walk: .22 runs Intentional Walk: .17 runs Hit By Pitch: .24 runs Sacrifice Bunt: -.22 runs Sacrifice Fly: -.10 runs Strikeout: -.34 runs Groundball Double Play: -.75 runs Other Out: -.33 runs CY YOUNGS View the AL and NL Cy Young voting results in 2010 here. The Cy Young award is intended to be given to the best pitcher (normally a starter, but not exclusive to them) in both leagues. You can read about it here and view past winners. It has been awarded since 1967 and is frankly named after the wrong guy; Walter Johnson would have been a superior choice, in my opinion. The winners are voted on by 30 representatives from the BBWAA, one from each team. Voters pick their top 5 pitchers and the winner; first place votes are worth 7 points, second place 4 points, third place 3 points, fourth place 2 points, and fifth place 1 point. Since relievers nowadays have their own distinct award, I find it unnecessary to include them for the Cy Young, so my Cy Young Player Value winners will be the best starting pitchers each season. Additionally, note that the winners will be determined via a pitcher's Pitching Value, not a pitcher's total Player Value. The overall Player Value of a pitcher will only be used for MVP, RoY, and 1st/2nd team honors. The Cy Young goes to the best pitcher at pitching, not the best overall player that is a pitcher. NL Actual Winner: Roy Halladay, Philadelphia Phillies NL Player Value Winner: Adam Wainwright, St. Louis Cardinals
Wainwright led the NL with a Pitching Value of 31.38. Roy Halladay wasn't the best Roy at pitching on his team, let alone the best pitching Roy in the NL or the best pitcher in the NL overall. Roy Oswalt boasted an impressive Pitching Value of 23.32 in his Astros/Phillies split season, while Roy Halladay had a Pitching Value of 22.66, the 5th best in the NL. The first-quartile NL starter had a Pitching Value Average of .0908, while Wainwright's was .1457 and Halladay's was .1340. Here are their pitching rate comparisons to their first-quartiles, in the order of ERA, WHIP, AVG against, OBP against, BABIP, and FIP: Wainwright: 2.42 vs 3.12, 1.051 vs 1.178, .224 vs .239, .274 vs .299, .274 vs .299, 2.86 vs 3.39 Halladay: 2.44 vs 3.12, 1.041 vs 1.178, .245 vs .239, .271 vs .299, .271 vs .299, 3.01 vs 3.39 Your friendly reminder that WHIP is walks and hits per inning pitched, BABIP is batting average on balls in play, and FIP is fielding independent pitching. Here are some of their traditional pitching stats: Wainwright: 20-11, 230.33 IP, 186 H, 15 HR, 56 BB, 213 SO, 2 IBB, 4 HBP, 25 GIDP, 407 other outs, 910 batters Halladay: 21-10, 250.67 IP, 231 H, 24 HR, 30 BB, 219 SO, 1 IBB, 5 HBP, 25 GIDP, 468 other outs, 993 batters And here are some totals relative to their positional first-quartiles: Wainwright: -12.7 nonHR hits, -3.11 HR, -4.42 uBB, +57.62 SO, -1.51 IBB, -.38 WP, -.51 HBP, +0 BK, +4.79 SH, +1.92 SF, +10.73 GIDP, -22.44 other outs Halladay: +7.08 nonHR hits, +4.3 HR, -34.58 uBB, +49.9 SO, -2.82 IBB, +2.41 WP, +1.09 HBP, +1 BK, +.06 SH, +.56 SF, +9.47 GIDP, +.65 other outs Baseball Reference WAR has Wainwright at 6.2 and Halladay at 8.5, while FanGraphs WAR has them at 5.1 and 6.2, respectively. Halladay had the highest fWAR among NL pitchers. The worst starting pitcher at pitching in the NL was Zach Duke of the Pittsburgh Pirates, with a Pitching Value of -24.89, a bWAR of -1.1, and an fWAR of 0.3. The NL pitcher with the lowest fWAR was Todd Wellemeyer of the San Francisco Giants at -0.9, who had a Pitching Value of -10.54. AL Actual Winner: Felix Hernandez, Seattle Mariners AL Player Value Winner: Felix Hernandez, Seattle Mariners  King Felix led all of MLB and the AL with a Pitching Value of 37.13. The next closest in the AL was Cliff Lee of the Seattle Mariners and the Texas Rangers with a Pitching Value of 29.99. The first-quartile AL starting pitcher had a Pitching Value Average of .0899, while Felix's was .1433 and Lee's was .1426. Here are their pitching rate comparisons to their first-quartiles, in the order of ERA, WHIP, AVG against, OBP against, BABIP, and FIP: Felix: 2.27 vs 3.63, 1.057 vs 1.206, .212 vs .241, .273 vs .301, .273 vs .301, 3.04 vs 3.62 Lee: 3.18 vs 3.63, 1.003 vs 1.206, .240 vs .241, .255 vs .301, .255 vs .301, 2.58 vs 3.62 Here are some of their traditional pitching stats: Felix: 13-12, 249.67 IP, 194 H, 17 HR, 70 BB, 232 SO, 1 IBB, 8 HBP, 25 GIDP, 463 other outs, 1,001 batters Lee: 12-9, 212.33 IP, 195 H, 16 HR, 18 BB, 185 SO, 2 IBB, 1 HBP, 11 GIDP, 423 other outs, 843 batters Only 18 walks in 212 innings! That's 0.8 walks per 9 innings, the 9th lowest among pitchers that qualified for the ERA title since 1900! And here are some totals relative to their positional first-quartiles: Felix: -20.01 nonHR hits, -2.61 HR, +7.28 uBB, +82.07 SO, -.19 IBB, +9.43 WP, +1.74 HBP, +1 BK, +2.82 SH, -1.93 SF, +9.59 GIDP, -13.44 other outs Lee: +11.45 nonHR hits, -.68 HR, -36.49 uBB, +57.49 SO, +.99 IBB, -.88 WP, -4.32 HBP, +1 BK, +1.29 SH, +1.81 SF, -2.11 GIDP, +17.8 other outs Baseball Reference WAR has Felix at 7.2 and Lee at 5.1, while FanGraphs WAR has Felix at 7.3 and Felix at 6.7. The Mariners had the 1st and 2nd best pitchers in the AL according to Player Value and 1st and 3rd best in the AL according to fWAR, and still were terrible in 2010. The Phillies had traded Lee to the Mariners in late 2009 to make room for the 'superior' Roy Halladay. Despite Halladay's winning of the NL Cy Young, Player Value and fWAR agree that Lee was the better pitcher in 2010, and both fWAR and bWAR think that Lee was the better pitcher for the rest of their careers. Good thing the Phillies got Lee back shortly afterwards in late 2010! The worst starting pitcher at pitching in the AL was Ryan Rowland-Smith of the... Seattle Mariners! He had a Pitching Value of -27.16, a bWAR of -2.6, and an fWAR of -1.5, the worst in MLB. Keeping it simple, he had a 1-10 record and a 6.75 ERA... yeesh. RELIEVERS OF THE YEAR This award has been around in different forms over the years. The initial version was the Rolaids Relief Man Award, which began in 1976. You can read about it and view past winners here. It was designed to be given to the best closer in each league. The award was decided using a point system, where a "tough" save (tying run on base) was worth 4 points, a save was worth 3 points, a win worth 2 points, a loss worth -2 points, and a blown save worth -2 points. The award stopped being given out after the 2012 season when the Rolaids brand was acquired by another company that didn't care for sponsoring the award. This award was effectively replaced by MLB's Reliever of the Year Award, which has been around since 2014. The AL winner technically wins the Mariano Rivera AL Reliever of the Year award, and the NL winner wins the Trevor Hoffman NL Reliever of the Year award. These awards are decided by a panel of voters, who pick their top 3 guys, with 1st place votes worth 5 points, 2nd place votes worth 3 points, and 3rd place votes worth 1 point. The panel consists of notable retired relief pitchers. You can read about this newer award and view past winners here. My Reliever of the Year awards will go to the relief pitchers with the highest Pitching Value in each league. Note that this is relief pitchers, not just closers. Pitching Value does not make any type of leverage adjustment for the 'difficulty' of particular pitching situations. NL Actual Winner: Heath Bell, San Diego Padres NL Player Value Winner: Hung-Chih Kuo, Los Angeles Dodgers
In his penultimate season, Kuo led all NL relievers with a Pitching Value of 15.90. Bell had a Pitching Value of 8.50, placing him 15th in the NL among relievers. The first-quartile NL reliever had a Pitching Value Average of .0854, while Kuo's was .1907 and Bell's was .1407. Here are their pitching rate comparisons to their first-quartiles, in the order of ERA, WHIP, AVG against, OBP against, BABIP, and FIP: Kuo: 1.20 vs 2.65, .783 vs 1.176, .139 vs .219, .211 vs .289, .211 vs .289, 1.81 vs 3.02 Bell: 1.93 vs 2.65, 1.200 vs 1.176, .221 vs .219, .300 vs .289, .300 vs .289, 2.05 vs 3.02 Here are some of their traditional pitching stats: Kuo: 12 SV, 60 IP, 29 H, 1 HR, 18 BB, 0 IBB, 1 HBP, 73 SO, 1 GIDP, 105 other outs, 229 batters Bell: 47 SV, 70 IP, 56 H, 1 HR, 28 BB, 3 IBB, 1 HBP, 86 SO, 4 GIDP, 107 other outs, 287 batters And here are some totals relative to their positional first-quartiles: Kuo: -14.95 nonHR hits, -2.33 HR, +3.10 uBB, +28.73 SO, -1.75 IBB, +2.04 WP, +.06 HBP, +1 BK, -.05 SH, +.20 SF, -2.33 GIDP, +2.44 other outs Bell: +4.89 nonHR hits, -2.89 HR, +7.61 uBB, +34.35 SO, +.96 IBB, -.12 WP, -.10 HBP, +0 BK, +2.78 SH, +.07 SF, +.11 GIDP, -12.65 other outs Baseball Reference WAR has Kuo at 3.3 and Bell at 1.9, while FanGraphs WAR has Kuo at 2.3 and Bell at 2.3. Kuo and Bell finished 3rd and 4th among relievers in MLB and in the NL. The NL relief pitcher with the most fWAR was Carlos Marmol of the Chicago Cubs, who had a Pitching Value of 13.21, the 4th best in the NL. The worst pitching reliever in the NL was Manny Parra of the Milwaukee Brewers, with a Pitching Value of -18.91, who had an fWAR of 0. The NL reliever with the lowest fWAR was Juan/J.C. Guatirrez of the Arizona Diamondbacks at -1.1, who had a Pitching Value of -7.87. He was technically the Dbacks closer, but split the role with Chad Qualls who was even worse with a Pitching Value of -9.78 and an fWAR of 0. AL Actual Winner: Rafael Soriano, Tampa Bay Rays AL Player Value Winner: Rafael Soriano, Tampa Bay Rays  Soriano led the AL among relief pitchers with a Pitching Value of 13.73. The next closest was the legendary Mariano Rivera of the New York Yankees, with a Pitching Value of 12.15. The first-quartile AL reliever had a Pitching Value Average of .0859, while Soriano's was .1804 and Rivera's was .1735. Here are their pitching rate comparisons to their first-quartiles, in the order of ERA, WHIP, AVG against, OBP against, BABIP, and FIP: Soriano: 1.73 vs 2.97, .80 vs 1.12, .163 vs .215, .215 vs .288, .215 vs .288, 2.81 vs 3.23 Rivera: 1.80 vs 2.97, .83 vs 1.12, .183 vs .215, .239 vs .288, .239 vs .288, 2.81 vs 3.23 Here are some of their traditional pitching stats: Soriano: 45 SV, 62.33 IP, 36 H, 4 HR, 14 BB, 2 IBB, 1 HBP, 57 SO, 3 GIDP, 125 other outs, 237 batters Rivera: 33 SV, 60 IP, 39 H, 2 HR, 11 BB, 3 IBB, 5 HBP, 45 SO, 4 GIDP, 125 other outs, 230 batters And here are some totals relative to their positional first-quartiles: Soriano: -11.38 nonHR hits, +.18 HR, -4.75 uBB, +12.81 SO, +.93 IBB, -1.42 WP, -.04 HBP, +0 BK, -1.08 SH, +.01 SF, -.55 GIDP, +14.01 other outs Rivera: -4.76 nonHR hits, -1.67 HR, -8.12 uBB, +2.47 SO, +1.97 IBB, -1.36 WP, +4 HBP, +0 BK, -1.04 SH, +.05 SF, +.58 GIDP, +18.16 other outs Baseball Reference WAR has Soriano at 2.1 and Rivera at 2.4, while FanGraphs WAR has Soriano at 1.9 and Rivera at 1.8. The AL reliever with the most fWAR was Matt Thornton of the Chicago White Sox at 2.2, who had a Pitching Value of 9.97 for the 6th best in the AL. The worst pitching reliever in the AL was Chad Gaudin of the Oakland Athletics and New York Yankees with a Pitching Value of -16.62. He had an fWAR of -1, the 2nd worst in the AL. Just below him was Brian Tallet of the Toronto Blue Jays at -1.2, who had a Pitching Value of -16.22. In terms of just closers, the worst was Alfredo Simon of the Baltimore Orioles, with a Pitching Value of -8.57, and an fWAR of -0.8. ROOKIES OF THE YEAR This one is well known, given to the best player in each league that is in his first qualified season. There's no specific awards for different positions, so all rookie players are on the table. You can view the winners in 2010 here. The award works the same way as the other BBWAA voting based awards such as the Cy Young and the MVP. NL Actual Winner: Buster Posey, San Francisco Giants, Catcher NL Player Value Winner: Buster Posey, San Francisco Giants, Catcher  Posey led all MLB rookies and finished 1st in the NL with a Player Value of 22.87. This was good for the 4th most in MLB and in the NL among catchers. He received 20 first place votes and finished with 129 vote points. The next closest was Jason Heyward, rightfielder for the Atlanta Braves, who received 9 first place votes and 107 vote points. Player Value did not like Heyward, rating him at -3.93. The rookie with the 2nd most Player Value in the NL was Neil Walker, second baseman for the Pittsburgh Pirates, at 16.31. He finished 5th in the actual voting with 0 first place votes and 3 vote points. The NL rookie pitcher with the highest Player Value was Jaime Garcia of the St. Louis Cardinals at 14.57, who finished 3rd in the actual voting with 1 first place vote and 24 vote points. Baseball Reference WAR has Posey at 3.9, Heyward at 6.4, and Garcia at 2.9. FanGraphs WAR has Posey at 4.0, Heyward at 4.6, and Garcia at 2.4. Posey was solid both offensively and defensively, with a Batting Value of 11.09 and a Fielding Value of 12.56. Those place him 6th and 11th in MLB among catchers, respectively. Contrary to what most of us think of Heyward nowadays, he scored fine offensively with a Batting Value of 6.87 but poor defensively with a Fielding Value of -10.41. Walker was pretty good at both, with a 12.48/4.73 split. Garcia had a 14.03 pitching value and was able to add some value defensively with a Fielding Value of 1.07, but essentially took that value away offensively with a Batting Value of -0.79. Compared to the first-quartile catcher, Posey got you 18.89 more singles, 6.38 more doubles, 2 more triples, 10.36 more homers, 70.27 more putouts, 12.22 more assists, 1.53 fewer passed balls, and 12.88 more caught stealings. He had a caught stealing percentage of .3710 vs the first-quartile of .1633, a fielding percentage of .9920 vs the first-quartile of .9914, and range factor per game and per 9 innings comparisons of 8.20 vs 7.20 and 8.59 vs 7.85. He had an OPS of .862 vs the first-quartile of .692, and a wOBA of .371 vs the first-quartile of .309. AL Actual Winner: Neftali Feliz, Texas Rangers, Closer AL Player Value Winner: Austin Jackson, Detroit Tigers, Centerfielder
Jackson finished 2nd among all MLB rookies and 1st in the AL with a Player Value of 18.14. Feliz had a Player Value of 9.72, the 4th best among MLB rookie pitchers and best in the AL. Jackson was fueled by his strong defensive abilities, finishing with a Fielding Value of 10.96, while still having a respectable Batting Value for a centerfielder of 6.42. He was the 11th best defensive CF in MLB. His Baserunning Value when it came to just stealing was pretty minimal, but some research I've been doing shows that his non-stealing baserunning may have been the best in the league in 2010; however, that isn't incorporated into Player Value yet. In the actual AL Rookie of the Year voting, Jackson received 8 first place votes to Feliz's 20, and finished with 98 vote points to Feliz's 122. Baseball Reference WAR has Jackson at 5.1 and Feliz at 2.5, while FanGraphs WAR has Jackson at 4.1 and Feliz at 2.0. It's difficult for a pitcher to outweigh the value of a position player, unless most position players have down years and the pitcher truly goes above and beyond. They see less action on the field, so have smaller Fielding Values, and also see less action at the plate, so have smaller Batting Values and Baserunning Values. This is especially true for AL pitchers who bat even less, and for relievers who would generally be pinch-hit for if their spot was to come up in the lineup. Feliz was a great player, but out of the nature of his position he generally isn't involved in the game enough to have a larger impact than a position player would. He had a Pitching Value of 10.72, but hurt himself defensively with a Fielding Value of -0.55. He added no value with his bat or on the bases, as he had 0 plate appearances the entire year. He was the 9th best relief pitcher in the AL, and the 4th best closer. Across all of MLB, he was the 21st best relief pitcher and the 6th best closer. Compared to the first-quartile centerfielder, Jackson got you 41.05 more singles, 11.31 more doubles, 6.22 more triples, 6.38 more stolen bases, 35.93 more putouts, 6.2 more assists, and 2 more double plays. He had an OPS of .745 vs the first-quartile of .679, and a wOBA of .329 vs the first-quartile of .307. In terms of Batting Value Average, the comparison is -.0948 vs -.1152. His fielding percentage of .985 doesn't stand out from the first-quartile of .986, but his range factor per game of 2.63 and range factor per 9 innings of 2.81 do compared to the first-quartiles of 2.38 and 2.54. Compared to the first-quartile closer, Feliz allowed 10.26 fewer non-HR hits, 1.63 fewer unintentional walks, 21.85 more strikeouts, 1.05 more groundball double plays, and 2.54 more other outs. He had an ERA of 2.73 vs the first-quartile of 2.93, a FIP of 2.96 vs the first-quartile of 3.23, and a BABIP of .246 vs the first-quartile of .288. In terms of Pitching Value Average, the comparison is .159 vs .0859. MOST VALUABLE PLAYERS The award that really needs no introduction. Given to the best players in both leagues. You can view the winners in 2010 here. NL Actual Winner: Joey Votto, Cincinnati Reds, First Base NL Player Value Winner: Albert Pujols, St. Louis Cardinals, First Base
I chose 2010 as my example Player Value season because I hoped to show that Votto deserved to win the MVP that year. I came up short, but am not disappointed with the results. Pujols led all of MLB and the NL with a total Player Value of 76.45. Albert has won 3 MVPs in his career, so this would supposedly be #4, although I haven't checked if any of his other 3 are justified or not. Votto finished 5th in MLB and 3rd in the NL with a total Player Value of 48.79. I have stripped Votto of his one MVP, but spoiler: Player Value has him deserving to have won it in 2017. Votto received 31 first place votes to Pujols' 1, and Votto had 443 vote points to Pujols' 279. Here's how Pujols and Votto compare by their Player Value components: Votto: 41.30 Batting Value, 0.45 Baserunning Value, 7.05 Fielding Value Pujols: 36.42 Batting Value, 0.54 Baserunning Value, 39.50 Fielding Value Votto had the highest Batting Value in the NL, so it's likely that MVP voters are biased towards offensive performance. Pujols was just a slightly worse hitter but a notably superior defender. Note that both players played 100% of their games at first base, so they have the same first-quartiles. Here's how they compare by their Player Value components, in rate form: Votto: -.0092 Batting Value Average, .0214 Baserunning Value Average, .3293 Fielding Value Average Pujols:-.0209 Batting Value Average, .0300 Baserunning Value Average, .3946 Fielding Value Average 1B First-Quartile: -.0906 BatVA, -.1065 BaseVA, .3393 FieldVA Here are their AVG, OBP, SLG, OPS, and wOBA first quartile comparisons: Votto: .324 vs .250, .424 vs .332, .600 vs .406, 1.024 vs .749, .438 vs .332 Pujols: .312 vs .250, .414 vs .332, .596 vs .406, 1.011 vs .749, .419 vs .332 Here are their traditional counting batting stats: Votto: 648 PA, 102 1B, 36 2B, 2 3B, 37 HR, 113 RBI, 83 uBB, 8 IBB, 7 HBP, 0 SH, 3 SF, 125 SO, 11 GIDP Pujols: 700 PA, 101 1B, 39 2B, 1 3B, 42 HR, 118 RBI, 65 uBB, 38 IBB, 4 HBP, 0 SH, 6 SF, 76 SO, 23 GIDP Here are their batting comparisons relative to their first quartiles: Votto: +17.84 1B, +10.42 2B, +2 3B, +18.07 HR, +25.67 uBB, +24.7 SO, +3.73 IBB, +4.76 HBP, +0 SH, -.73 SF, +.78 GIDP, -18.97 other Outs Pujols: +10.08 1B, +11.36 2B, +1 3B, +21.55 HR, +3.07 uBB, -32.35 SO, +33.38 IBB, +1.58 HBP, +0 SH, +1.97 SF, +11.96 GIDP, +31.73 other Outs Here are their fielding percentage, RFG, and RF9 comparisons to first quartiles: Votto: .9960 vs .9923, 8.51 vs 8.56, 8.84 vs 9.11 Pujols: .9980 vs .9923, 10.29 vs 8.56, 10.53 vs 9.11 Here are their traditional counting fielding stats: Votto: 1,283 Inn, 1,265 Ch, 1,132 PO, 128 A, 5 E, 101 DP Pujols: 1,380.67 Inn, 1,619 Ch, 1,458 PO, 157 A, 4 E, 146 DP Here are their fielding comparisons relative to their first quartiles: Votto: -44.18 assisted PO, -4.91 unassisted PO, +48.56 A, +1.03 E, -5.39 DP Pujols: +168.3 assisted PO, +18.7 unassisted PO, +71.52 A, -.27 E, +31.51 DP And lastly here are their baserunning comparisons: Votto: 16 SB, 5 CS, 76.19% Pujols: 14 SB, 4 CS, 77.78% Baseball Reference WAR had Votto at 7.0 and Pujols at 7.5. FanGraphs WAR had Votto at 6.9 and Pujols at 6.8, 1st and 2nd in the NL respectively. The worst overall player in the NL was Jorge Cantu, first and third baseman for the Florida Marlins & Texas Rangers, with a total Player Value of -48.29. Cantu played 97 games in the NL with the Marlins and 30 games in the AL with the Rangers. The worst player that solely played in the NL was Pedro Feliz, first and third baseman for the Houston Astros & St. Louis Cardinals, with a total Player Value of -44.19. Cantu had a bWAR of -1 and an fWAR of -.5, while Feliz had a bWAR of -0.4 and an fWAR of -2.3, the worst in the NL. AL Actual Winner: Josh Hamilton, Texas Rangers, Left Field AL Player Value Winner: Robinson Cano, New York Yankees, Second Base
Cano finished 3rd in MLB and 1st in the AL with a total Player Value of 64.45. Cano has no actual MVPs in his career, so this would be his first. Hamilton finished 4th in MLB and 2nd in the AL with a total Player Value of 59.55. You may recall that Hamilton was a Red and nearly the NL Rookie of the Year in 2007 before being traded for Edison Volquez. So the Reds could have had both of the MVPs on their team in 2010. At least Player Value makes it so that it would only be both of the almost MVPs on their team. Here's how Hamilton and Cano compare by their Player Value components: Hamilton: 48.48 Batting Value, 0.57 Baserunning Value, 10.50 Fielding Value Cano: 35.99 Batting Value, -0.34 Baserunning Value, 28.81 Fielding Value Hamilton also had the highest Batting Value in the AL, which further shows how MVP voters are biased towards offensive performance. Cano was just a slightly worse hitter but a superior defender, relative to his position. Here how they compare by their Player Value components, in rate form: Hamilton: -.0085 Batting Value Average, .0900 Baserun Value Average, .0814 Fielding Value Average Cano: -.0489 Batting Value Average, -.0660 Baserun Value Average, .1898 Fielding Value Average Hamilton's First-Quartile: -.1016 BatVA, -.0531 BaseVA, .0723 FieldVA Cano's First-Quartile: -.1107 BatVA, -.0671 BaseVA, .1700 FieldVA Here are their AVG, OBP, SLG, OPS, and wOBA first quartile comparisons: Hamilton: .359 vs .259, .411 vs .331, .633 vs .384, 1.044 vs .724, .445 vs .322 Cano: .319 vs .267, .381 vs .329, .534 vs .375, .914 vs .700, .391 vs .311 Here are their traditional counting batting stats: Hamilton: 571 PA, 111 1B, 40 2B, 3 3B, 32 HR, 100 RBI, 38 uBB, 5 IBB, 5 HBP, 1 SH, 4 SF, 95 SO, 11 GIDP Cano: 696 PA, 127 1B, 41 2B, 3 3B, 29 HR, 109 RBI, 43 uBB, 14 IBB, 8 HBP, 0 SH, 5 SF, 77 SO, 19 GIDP Here are their batting comparisons relative to their first quartiles: Hamilton: +30.55 1B, +17.17 2B, +1.08 3B, +24.29 HR, +.24 uBB, +12.63 SO, +3.93 IBB, +2.57 HBP, +.76 SH, +1.66 SF, +4.97 GIDP, -12.3 other Outs Cano: +19.45 1B, +13.14 2B, +1.65 3B, +21.7 HR, -2.39 uBB, -3.08 SO, +13.71 IBB, +3.67 HBP, -1.54 SH, +1.93 SF, +9.76 GIDP, +10.68 other Outs Here are their fielding percentage, RFG, and RF9 comparisons to first quartiles: Hamilton: .9850 vs .9835, 1.99 vs 1.84, 2.29 vs 2.00 Cano: .9960 vs .9803, 4.89 vs 4.29, 4.99 vs 4.66 Here are their traditional counting fielding stats: Hamilton: 1,034.67 Inn, 267 Ch, 254 PO, 9 A, 4 E, 2 DP Cano: 1,393.33 Inn, 776 Ch, 341 PO, 432 A, 3 E, 114 DP Here are their fielding comparisons relative to their first quartiles: Hamilton: +31.94 PO, +5.82 A, +2.61 E, +2 DP Cano: +50.18 PO, +27.81 A, -3.8 E, +23.19 DP And lastly here are their baserunning comparisons: Hamilton: 8 SB, 1 CS, 88.89% Cano: 3 SB, 2 CS, 60% Baseball Reference WAR has Hamilton at 8.7 and Cano at 8.1, while FanGraphs WAR has Hamilton at 8.4 and Cano at 6.4. Hamilton led all of MLB and the AL in fWAR. The worst overall player in the AL was Brandon Wood, third baseman and shortstop for the Los Angeles Angels of Anaheim, with a total Player Value of -34.18. He had a bWAR of -1.5 and an fWAR of -1.7. Adam Moore of the Seattle Mariners had the worst fWAR at -2.4, and he had a total Player Value of -23.31. Now I will dive into 1st-team and 2nd-team selections for both the AL and NL, as well as MLB overall. Each starting position gets one spot, besides pitchers. Starting pitchers get 5 spots, as is the usual rotation size. Relief pitchers get two spots, and closers get one spot. I've also added a miscellaneous spot for safety, which will be used by diverse outfielders that didn't play at least 50% of their games at one outfield position, utility players that didn't play at least 50% of their games at any one position, outfielders that finish in the top 6 among all outfielders but not among the top 2 in a specific outfield position, or relievers/closers that finish in the top 6 among relievers/closers but not among the top 4 relievers or top 2 closers. The flexibility is intended so that every year there's hopefully at least somebody that qualifies, and this prevents worthy guys from being left out. This safety spot will only be used for the NL and AL teams. For the MLB, I'll put the safety player where I think makes the most sense, if he qualifies. Here are your teams, with each player's total Player Value and WAR (as calculated by Baseball Reference), for reference. FIRST-TEAM NL C: Geovany Soto, Chicago Cubs, 33.75 Player Value, 3.3 WAR 1B: Albert Pujols, St. Louis Cardinals, 76.45 Player Value, 7.5 WAR 2B: Chase Utley, Philadelphia Phillies, 42.39 Player Value, 5.8 WAR 3B: Scott Rolen, Cincinnati Reds, 28.96 Player Value, 4.1 WAR SS: Troy Tulowitzki, Colorado Rockies, 76.10 Player Value, 6.7 WAR LF: Matt Holliday, St. Louis Cardinals, 35.70 Player Value, 5.9 WAR CF: Chris Young, Arizona Diamondbacks, 32.07 Player Value, 5.4 WAR RF: Jay Bruce, Cincinnati Reds, 29.04 Player Value, 4.7 WAR SP1: Adam Wainwright, St. Louis Cardinals, 38.42 Player Value, 6.4 WAR SP2: Tim Hudson, Atlanta Braves, 28.96 Player Value, 6.0 WAR SP3: Roy Halladay, Philadelphia Phillies, 22.91 Player Value, 8.3 WAR SP4: Roy Oswalt, Houston Astros & Philladelphia Phillies, 22.82 Player Value, 5.7 WAR SP5: Ubaldo Jimenez, Colorado Rockies, 21.89 Player Value, 7.3 WAR RP1: Evan Meek, Pittsburgh Pirates, 19.80 Player Value, 2.5 WAR RP2: Luke Gregorson, San Diego Padres, 18.26 Player Value, 0.4 WAR CP: Billy Wagner, Atlanta Braves, 13.77 Player Value, 2.5 WAR Misc: Carlos Gonzalez, Colorado Rockies, 35.80 Player Value, 5.9 WAR Carlos Gonzalez finished 3rd in MLB and 1st in the NL among outfielders, but he did not play more than 50% of his games at any specific outfield position. SECOND-TEAM NL C: Brian McCann, Atlanta Braves, 32.40 Player Value, 3.6 WAR 1B: Joey Votto, Cincinnati Reds, 48.79 Player Value, 7.0 WAR 2B: Kelly Johnson, Arizona Diamondbacks, 38.01 Player Value, 4.3 WAR 3B: David Wright, New York Mets, 26.93 Player Value, 2.8 WAR SS: Stephen Drew, Arizona Diamondbacks, 33.67 Player Value, 4.0 WAR LF: Ryan Braun, Milwaukee Brewers, 30.36 Player Value, 5.7 WAR CF: Andrew McCutchen, Pittsburgh Pirates, 28.42 Player Value, 3.8 WAR RF: Jayson Werth, Philadelphia Phillies, 20.26 Player Value, 4.5 WAR SP1: R.A. Dickey, New York Mets, 21.86 Player Value, 4.2 WAR SP2: Chris Carpenter, St. Louis Cardinals, 19.55 Player Value, 2.7 WAR SP3: Josh Johnson, Florida Marlins, 18.92 Player Value, 6.6 WAR SP4: Yovanni Gallardo, Milwaukee Brewers, 18.41 Player Value, 3.1 WAR SP5: Mat Latos, San Diego Padres, 16.92 Player Value, 3.1 WAR RP1: Hung-Chih Kuo, Los Angeles Dodgers, 14.93 Player Value, 3.3 WAR RP2: Brandon Lyon, Houston Astros, 13.13 Player Value, 1.7 WAR CP: Carlos Marmol, Chicago Cubs, 12.50 Player Value, 2.7 WAR Misc: Omar Infante, Atlanta Braves, 16.16 Player Value, 3.1 WAR Omar Infante finished 1st in MLB and in the NL among utility players that didn't play at least 50% of their games at any specific position. FIRST-TEAM AL C: Victor Martinez, Boston Red Sox, 17.57 Player Value, 3.6 WAR 1B: Miguel Cabrera, Detroit Tigers, 43.71 Player Value, 6.5 WAR 2B: Robinson Cano, New York Yankees, 64.45 Player Value, 8.1 WAR 3B: Adrian Beltre, Boston Red Sox, 35.88 Player Value, 7.8 WAR SS: Alexei Ramirez, Chicago White Sox, 37.82 Player Value, 5.6 WAR LF: Josh Hamilton, Texas Rangers, 59.55 Player Value, 8.7 WAR CF: Adam Jones, Baltimore Orioles, 23.47 Player Value, 2.5 WAR RF: Jose Bautista, Toronto Blue Jays, 35.23 Player Value, 7.0 WAR DH: Jim Thome, Minnesota Twins, 20.06 Player Value, 3.6 WAR SP1: Felix Hernandez, Seattle Mariners, 41.50 Player Value, 7.1 WAR SP2: Trevor Cahill, Oakland Athletics, 28.63 Player Value, 3.9 WAR SP3: Clay Buchholz, Boston Red Sox, 27.38 Player Value, 5.7 WAR SP4: Cliff Lee, Seattle Mariners & Texas Rangers, 26.44 Player Value, 3.5 WAR SP5: Justin Verlander, Detroit Tigers, 24.68 Player Value, 4.3 WAR RP1: Scott Downs, Toronto Blue Jays, 12.00 Player Value, 1.8 WAR RP2: Brian Duensing, Minnesota Twins, 11.41 Player Value, 3.6 WAR CP: Mariano Rivera, New York Yankees, 14.91 Player Value, 2.4 WAR SECOND-TEAM AL C: Jose Molina, Toronto Blue Jays, 11.27 1B: Paul Konerko, Chicago White Sox, 40.38 Player Value, 4.7 WAR 2B: Orlando Hudson, Minnesota Twins, 22.41 Player Value, 2.9 WAR 3B: Evan Longoria, Tampa Bay Rays, 34.46 Player Value, 8.2 WAR SS: Cliff Pennington, Oakland Athletics, 28.62 Player Value, 4.5 WAR LF: Carl Crawford, Tampa Bay Rays, 45.92 Player Value, 7.0 WAR CF: Vernon Wells, Toronto Blue Jays, 19.72 Player Value, 4.0 WAR RF: Nelson Cruz, Texas Rangers, 33.51 Player Value, 4.1 WAR DH: Luke Scott, Baltimore Orioles, 14.96 Player Value, 3.8 WAR SP1: John Danks, Chicago White Sox, 23.83 Player Value, 5.1 WAR SP2: Jon Lester, Boston Red Sox, 23.49 Player Value, 5.2 WAR SP3: David Price, Tampa Bay Rays, 22.81 Player Value, 4.7 WAR SP4: C.J. Wilson, Texas Rangers, 22.31 Player Value, 4.9 WAR SP5: Jered Weaver, Los Angeles Angels of Anaheim, 21.66 Player Value, 5.3 WAR RP1: Joaquin Benoit, Tampa Bay Rays, 10.96 Player Value, 2.2 WAR RP2: Daniel Bard, Boston Red Sox, 9.81 Player Value, 3.1 WAR CP: Rafael Soriano, Tampa Bay Rays, 12.18 Player Value, 2.1 WAR Misc: Brett Gardner, New York Yankees, 23.43 Player Value, 7.4 WAR Misc: Joakim Soria, Kanas City Royals, 11.10 Player Value, 3.7 WAR Brett Gardner finished 6th in the AL among outfielders. This is applicable if we were to measure the 1st and 2nd teams by the top 3/6 outfielders in general, rather than the best LF, CF, and RF. Joakim Soria finished 5th in the AL among relievers/closers, but 3rd in the AL among closers. FIRST-TEAM MLB C: Geovany Soto, Chicago Cubs, 33.75 Player Value, 3.3 WAR 1B: Albert Pujols, St. Louis Cardinals, 76.45 Player Value, 7.5 WAR 2B: Robinson Cano, New York Yankees, 64.45 Player Value, 8.1 WAR 3B: Adrian Beltre, Boston Red Sox, 35.88 Player Value, 7.8 WAR SS: Troy Tulowitzki, Colorado Rockies, 76.10 Player Value, 6.7 WAR LF: Josh Hamilton, Texas Rangers, 59.55 Player Value, 8.7 WAR CF: Carlos Gonzalez, Colorado Rockies, 35.80 Player Value, 5.9 WAR RF: Jose Bautista, Toronto Blue Jays, 35.23 Player Value, 7.0 WAR DH: Jim Thome, Minnesota Twins, 20.06 Player Value, 3.6 WAR SP1: Felix Hernandez, Seattle Mariners, 41.50 Player Value, 7.1 WAR SP2: Adam Wainwright, St. Louis Cardinals, 38.42 Player Value, 6.4 WAR SP3: Tim Hudson, Atlanta Braves, 28.96 Player Value, 6.0 WAR SP4: Trevor Cahill, Oakland Athletics, 28.63 Player Value, 3.9 WAR SP5: Clay Buchholz, Boston Red Sox, 27.38 Player Value, 5.7 WAR RP1: Evan Meek, Pittsburgh Pirates, 19.80 Player Value, 2.5 WAR RP2: Luke Gregorson, San Diego Padres, 18.26 Player Value, 0.4 WAR CP: Mariano Rivera, New York Yankees, 14.91 Player Value, 2.4 WAR Carlos Gonzalez had a LF/CF/RF split of 39%/36%/25%, so he was very nearly perfectly split between all outfield positions. Given his frequent CF playing time and the fact that Chris Young had the lowest Player Value among the specific outfield position leaders, I decided to make Cargo the 1st-team CF and move Young to the 2nd-team. This squad has a total Player Value of 655.14, a mean Player Value of 38.54, and a median Player Value of 35.23. WAR doesn't like Gregorson or Cahill as much, but agrees for the most part. SECOND-TEAM MLB C: Brian McCann, Atlanta Braves, 32.40 Player Value, 3.6 WAR 1B: Joey Votto, Cincinnati Reds, 48.79 Player Value, 7.0 WAR 2B: Chase Utley, Philadelphia Phillies, 42.39 Player Value, 5.8 WAR 3B: Evan Longoria, Tampa Bay Rays, 34.46 Player Value, 8.2 WAR SS: Alexei Ramirez, Chicago White Sox, 37.82 Player Value, 5.6 WAR LF: Carl Crawford, Tampa Bay Rays, 45.92 Player Value, 7.0 WAR CF: Chris Young, Arizona Diamondbacks, 32.07 Player Value, 5.4 WAR RF: Nelson Cruz, Texas Rangers, 33.51 Player Value, 4.1 WAR SP1: Cliff Lee, Seattle Mariners & Texas Rangers, 26.44 Player Value, 3.5 WAR SP2: Justin Verlander, Detroit Tigers, 24.68 Player Value, 4.3 WAR SP3: John Danks, Chicago White Sox, 23.83 Player Value, 5.1 WAR SP4: Jon Lester, Boston Red Sox, 23.49 Player Value, 5.2 WAR SP5: Roy Halladay, Philadelphia Phillies, 22.91 Player Value, 8.3 WAR RP1: Hung-Chih Kuo, Los Angeles Dodgers, 14.93 Player Value, 3.3 WAR RP2: Brandon Lyon, Houston Astros, 13.13 Player Value, 1.7 WAR CP: Billy Wagner, Atlanta Braves, 13.77 Player Value, 2.5 WAR As mentioned above, due to Carlos Gonzalez being the better overall player and his positional diversity, Chris Young gets demoted to 2nd-team MLB despite being the best majority CF in both leagues. Andrew McCutchen, the 2nd best majority CF in both leagues, gets excluded from 2nd-team MLB for this reason as well. Since the NL didn't have a DH in 2010, I didn't make a 2nd-team MLB spot for the DH, so Luke Scott misses out there. This squad has a total Player Value of 485.49, a mean Player Value of 28.56, and a median Player Value of 26.44. WAR doesn't like Lee as much, and likes Halladay much more. To get a better idea for how Player Value looks across the board for all positions, let's also create a team of the worst guys at each position, as well as a team for the guys that are closest to the first-quartile-quality player at each position: WORST-TEAM MLB C: Jason Kendall, Kansas City Royals, -25.12 Player Value, 0.5 WAR 1B: Casey Kotchman, Seattle Mariners, -19.36 Player Value, -0.8 WAR 2B: Chone Figgins, Seattle Mariners, -30.35 Player Value, 1.2 WAR 3B: Jorge Cantu, Florida Marlins & Texas Rangers, -48.29 Player Value, -1.5 WAR SS: Everth Cabrera, San Diego Padres, -16.95 Player Value, 0.1 WAR LF: Carlos Lee, Houston Astros, -36.07 Player Value, -2.2 WAR CF: Tony Gwynn Jr., San Diego Padres, -18.95 Player Value, 2.2 WAR RF: Jeff Francoeur, New York Mets & Texas Rangers, -18.46 Player Value, 1.1 WAR DH: Adam Lind, Toronto Blue Jays, -23.51 Player Value, -1.0 WAR SP1: Rodrigo Lopez, Arizona Diamondbacks, -29.84 Player Value, -1.2 WAR SP2: Ryan Rowland-Smith, Seattle Mariners, -29.78 Player Value, -2.7 WAR SP3: Zach Duke, Pittsburgh Pirates, -25.49 Player Value, -1.3 WAR SP4: Charlie Morton, Pittsburgh Pirates, -23.59 Player Value, -2.6 WAR SP5: Manny Parra, Milwaukee Brewers, -23.32 Player Value, -0.4 WAR RP1: Blake Hawksworth, St. Louis Cardinals, -19.50 Player Value, -1.2 WAR RP2: Chad Gaudin, Oakland Athletics & New York Yankees, -17.00 Player Value, -1.0 WAR CP: Alfredo Simon, Baltimore Orioles, -7.27 Player Value, -0.4 WAR This squad has a total Player Value of -412.85, a mean Player Value of -24.29, and a median Player Value of -23.51. This was Simon's lone season in a closer role, but given his years as a Red I'm not surprised to see him as one of the worst pitchers here. Lee was at the end of his career; he hit 24 homers, but batted just .246 and wasn't a walk-machine either, in addition to being a poor fielder. Kendall was also winding down his career, while Morton was just getting started. WAR likes Gwynn Jr., Figgins, and Francoeur more. FIRST (QUARTILE)-TEAM MLB C: Henry Blanco, New York Mets, 0.23 Player Value, 0.0 WAR 1B: Ross Gload, Philadelphia Phillies, 0.54 Player Value, 0.3 WAR 2B: Luis Valbuena, Cleveland Indians, -0.29 Player Value, 0.0 WAR 3B: David Freese, St. Louis Cardinals, -0.29 Player Value, 0.7 WAR SS: Jerry Hairston Jr., San Diego Padres, 0.37 Player Value, 1.2 WAR LF: Juan Pierre, Chicago White Sox, 0.16 Player Value, 0.3 WAR CF: Mike Cameron, Boston Red Sox, 0.87 Player Value, 0.1 WAR RF: Andruw Jones, Chicago White Sox, -0.06 Player Value, 1.9 WAR DH: Travis Hafner, Cleveland Indians, 1.55 Player Value, 2.4 WAR SP1: Alex Sanabia, Florida Marlins, 0.20 Player Value, 0.1 WAR SP2: Brandon Morrow, Toronto Blue Jays, -0.23 Player Value, 1.8 WAR SP3: Bruce Chen, Kansas City Royals, -0.25 Player Value, 3.0 WAR SP4: Josh Tomlin, Cleveland Indians, 0.26 Player Value, 0.4 WAR SP5: James McDonald, Los Angeles Dodgers & Pittsburgh Pirates, 0.32 Player Value, -0.3 WAR RP1: Shawn Camp, Toronto Blue Jays, -0.01 Player Value, 1.7 WAR RP2: Jason Berken, Baltimore Orioles, 0.02 Player Value, 1.3 WAR CP: Francisco Cordero, Cincinnati Reds, 0.23 Player Value, 0.3 WAR I tried to set some basic playing time requirements so that we'd get a team of full-time first-quartile quality players, rather than just a bunch of players that hardly played. This squad has a total Player Value of 3.61, a mean Player Value of 0.21, and a median Player Value of 0.20. Mainly forgetful players, but Pierre, Cameron, and Jones were all towards the end of their careers. Cordero had 40 saves, but a 3.84 ERA as a closer. Hairston Jr. spent some time as a Red and he is the "meh" type of player that I think is really indicative of first-quartile quality. WAR likes Hairston Jr., Camp, Berken, Morrow, Chen, Hafner, and Jones much more than Player Value does. These guys are the borderline acceptable players; anyone consistently playing worse needs some concentrated training, a position change, or to be removed from the team. Just want a list of the top 25 players in MLB in 2010, regardless of position? If so, then here ya go: TOP 25 PLAYERS IN MLB 1. Albert Pujols, 1B, St. Louis Cardinals, 76.45 Player Value 2. Troy Tulowitzki, SS, Colorado Rockies, 76.10 Player Value 3. Robinson Cano, 2B, New York Yankees, 64.45 Player Value 4. Josh Hamilton, LF/CF, Texas Rangers, 59.55 Player Value 5. Joey Votto, 1B, Cincinnati Reds, 48.79 Player Value 6. Carl Crawford, LF, Tampa Bay Rays, 45.92 Player Value 7. Miguel Cabrera, 1B, Detroit Tigers, 43.71 Player Value 8. Chase Utley, 2B, Philadelphia Phillies, 42.39 Player Value 9. Felix Hernandez, SP, Seattle Mariners, 41.50 Player Value 10. Paul Konerko, 1B/DH, Chicago White Sox, 40.38 Player Value 11. Aubrey Huff, 1B/LF/RF, San Francisco Giants, 38.75 Player Value 12. Adam Wainwright, SP, St. Louis Cardinals, 38.42 Player Value 13. Kelly Johnson, 2B, Arizona Diamondbacks, 38.01 Player Value 14. Alexei Ramirez, SS, Chicago White Sox, 37.82 Player Value 15. Rickie Weeks, SS, Milwaukee Brewers, 35.91 Player Value 16. Adrian Beltre, 3B, Boston Red Sox, 35.88 Player Value 17. Carlos Gonzalez, LF/CF/RF, Colorado Rockies, 35.80 Player Value 18. Matt Holliday, LF, St. Louis Cardinals, 35.70 Player Value 19. Dan Uggla, 2B, Florida Marlins, 35.24 Player Value 20. Jose Bautista, RF/3B, Toronto Blue Jays, 35.23 Player Value 21. Evan Longoria, 3B, Tampa Bay Rays, 34.46 Player Value 22. Justin Morneau, 1B, Minnesota Twins, 34.14 Player Value 23. Geovany Soto, C, Chicago Cubs, 33.75 Player Value 24. Stephen Drew, SS, Arizona Diamondbacks, 33.67 Player Value 25. Nelson Cruz, RF/LF, Texas Rangers, 33.51 Player Value BASERUNNING VALUE Up until now I've neglected sharing any baserunning results because it makes up an insignificant portion of a player's total Player Value, for most players. Currently only stealing is incorporated into Baserunning Value. Players get +.15 for each stolen base and -.39 for each caught stealing. Like usual, players are compared to their positional first-quartile. The best baserunner in 2010 was Ichiro Suzuki of the Seattle Mariners, with a Baserunning Value of 3.69. He stole 42 bases and was caught 9 times, which is an 82.35% clip, well above his positional first-quartile of 51.29%. Baseball Reference has Ichiro with an Rbaser of 3, which is their baserunning component of bWAR. FanGraphs had Ichiro with an UBR of -1.3, a wGDP of 1.8, and a wSB of 4.1, for a total of 4.6 baserunning runs. wSB is the closest thing to what Baserunning Value is currently measuring, since I lack additional baserunning data at the moment. Ichiro ranked 8th in wSB in 2010. The player with the highest wSB was Juan Pierre of the Chicago White Sox at 5.7, who stole 68 bases and was caught 18 times. That's a clip of 79.07%, compared to his first-quartile of 60.80%. Pierre had a Baserunning Value of 0.86. The 2nd most Baserunning Value was Coco Crisp of the Oakland Athletics at 2.64, who stolen 32 bases and was caught 3 times, a clip of 91.43% compared to his first-quartile of 61.65%. FanGraphs has him at a wSB of 4.9, the 5th most overall. Crisp's Rbaser was 7 according to Baseball Reference. The worst baserunner in 2010 was Matt Kemp of the Los Angeles Dodgers with a Baserunning Value of -3.98. He stole 19 bases but was caught a whopping 15 times, giving him a clip of just 55.88% comapred to the center field first-quartile of 62.50%. He has the 2nd lowest wSB according to FanGraphs at -2.7. Beating him out was Torii Hunter of the Los Angeles Angeles with a wSB of -3.5, who had a Baserunning Value of -3.60, the 2nd worst. Hunter stole 9 bases and was caught 12 times, a clip of 42.86% vs his positional first-quartile of 55.65%. So at best, a player's Baserunning Value can add 3-4 runs and at worst it can take away 3-4 runs. Once I get more baserunning data and improve this portion of the metric the magnitudes will be a little higher, but nobody's gonna win the MVP or become a quality player solely based on their baserunning. PITCHING VALUE BY POSITION Like I did for Fielding Value and Batting Value, I'll now show that Pitching Value isn't particularly biased towards certain pitching roles. Here are the boxplots of Pitching Value by role in 2010:  Since relievers are compared to relievers and starters are compared to starters, the best relievers are still able to have a quality Pitching Value. WAR needs to really on Leverage Index for the best relievers to be better than even average starters. Here we see that the best relievers compare favorably to the better starters. The best starters will still generally have a higher Pitching Value, since starters log so much more innings. Also, relief pitchers are able to have good Pitching Value and compare favorably to closers. Note that when comparing to first-quartiles, the AL and NL are separated for pitchers unlike any of the other positions, since in 2010 (and all seasons from 1973-2021) NL pitchers batted but AL pitchers typically didn't. It would be unfair to compare an NL pitcher that bats to an AL pitcher that doesn't, since the NL pitcher could add to his total Player Value via Batting Value, but the AL pitcher couldn't. For 2022 and on (when both leagues have a DH), as well as for 1972 and earlier (when there is no DH in either league), pitchers will be compared at a MLB level, rather than by league. This split also makes sense because NL pitchers had the benefit of pitching to other pitchers, while AL pitchers had to pitch to designated hitters that were much better at batting. Here are the summary statistics of Pitching Value by role:  On average starters and relievers are about the same, and the best relievers can easily be among the top 25% of starters. PITCHING VALUE BY TEAM Since Pitching Value correlates well with runs allowed per game, then we'd expect teams that have players with the most Pitching Value to be the ones that allowed the least runs. Recall from my original Player Value post that Pitching Value Average can describe 84.62% of a team's runs allowed per game. Here are the boxplots of Pitching Value by team in 2010: 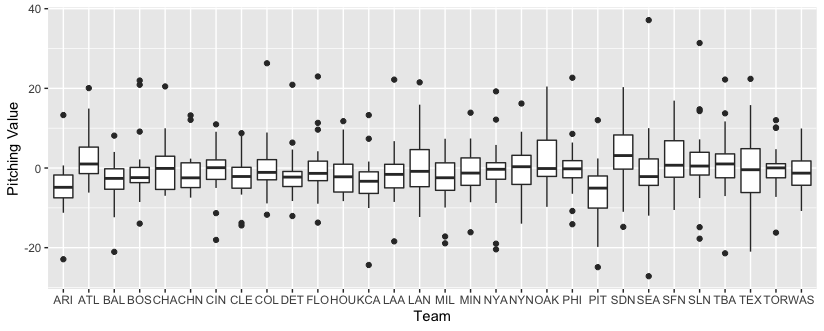 Looks like the Pirates had terrible pitching, and they went 57-105 in 2010. The Padres and Braves appear to have had quality pitching, and they went 90-72 and 91-71, respectively. And here are the summary statistics of Pitching Value by team in 2010:  Sure enough, the Padres and Braves had the best pitchers on average. Also up there were the Cardinals who went 86-76, and the Giants who went 92-70 and went on to win the World Series. The Pirates were indeed the worst, and also down there were the 65-97 Dbacks, and the 67-95 Royals. But the Rangers also grade poorly and went 90-72 and appeared in the World Series. The A's graded pretty well but went just 81-81. Let's cap it off by viewing the runs allowed by team in 2010:  Sure enough, the Pirates, Dbacks, and Royals were among the leaders in runs allowed. The teams with the fewest runs allowed were the Padres, Cardinals, Athletics, Giants, and Braves. A team's average Pitching Value appears very indicative of its runs allowed. PLAYER VALUE BY POSITION And now we will finally wrap everything up, showing that total Player Value is not particularly biased towards any certain position. Here are the boxplots of Player Value by position:  All positions have similar medians. Some positions have larger spreads and outliers, but this could likely just be a construct of 2010 in particular. The smaller spreads of RPs and DHs is probably due to those positions not being as valuable in general, due to not pitching as many innings and not playing defense. And here are the summary statistics of Player Value by position:  These values can serve as a baseline for what makes a good/bad Player Value at each position. Across all positions, players with a total Player Value of about 3.04 or more were among the top 25% of players. A total Player Value of 12.51 or more is the top 10%, 19.85 is the top 5%, and 37.88 is the top 1%. Conversely, players with a total Player Value of about -5.08 or less were among the bottom 25%, -10.51 is the bottom 10%, -14.94 is the bottom 5%, and -23.54 is the bottom 1%. In general, a Player Value of 20 serves as a rough baseline across all positions for an All-Star quality player. A Player Value of 40 serves as a rough baseline across all positions for an MVP-vote-receiving quality player. PLAYER VALUE BY TEAM Since a team's Player Value correlates well with its run differential per game, then we'd expect that the teams that have players with the most Player Value will be the ones that have the highest run differentials. Recall from my original Player Value post that Batting Value Average and Baserunning Value Average can describe 92.37% of a team's runs scored per game, while Fielding Value Average and Pitching Value Average can describe 86.1% of a team's runs allowed per game. These should also be the teams that win the most, since run differential per game correlates well with winning percentage (wins per game). Run differential per game can describe 89.31% of a team's winning percentage. Here are the boxplots of Player Value by team in 2010:  A little hard to pick some of the teams out, but I can see that the 57-105 Pirates are towards the bottom, as are the 66-97 Orioles and the 61-101 Mariners. On the higher end looks to be the 91-71 Braves, the 91-71 Reds, the 94-68 Twins, and the 90-72 Padres. Here are the summary statistics of Player Value by team in 2010: 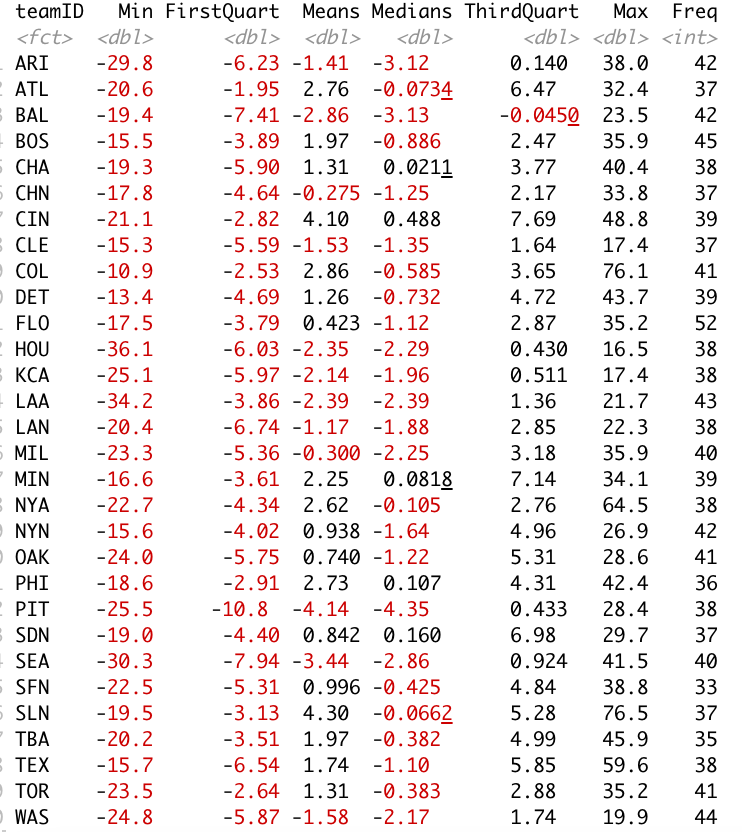 Feel free to compare these side by side with the 2010 MLB standings here. We see the aforementioned Braves, Reds, and Twins with higher means. Also up there are the 86-76 Cardinals, the 97-65 Phillies, the 95-67 Yankees, the 89-73 Red Sox, and the 96-66 Rays. The Rockies had a pretty high average Player Value but went just 83-79. The Padres and Giants were pretty middle of the road but went 90-72 and 92-70. Recall that Pitching Value graded them appropriately, so it could be the case that Fielding Value is dominating the runs allowed explanation more than it should. We also see the aforementioned Orioles, Pirates, and Mariners with lower means. Also down there are the 67-95 Royals, the 69-93 Indians, the 69-93 Nationals, and the 65-97 Diamondbacks. The Angels and Astros had pretty low average Player Values but were able to go 80-82 and 76-86. Here is the run differential by team in 2010:  Not surprising at this point, we see the Pirates, Orioles, Dbacks, Royals, and Mariners in the deep negatives. Astros are down there too, despite a near .500 record. Braves, Reds, Twins, Yankees, Phillies, Padres, Giants, Cardinals, Rays, Rangers in the higher positives. Here is the winning percentage by team in 2010, as well as the win differential by team in 2010: 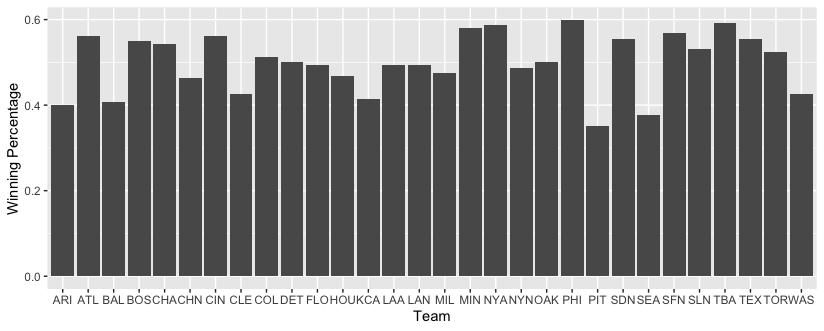 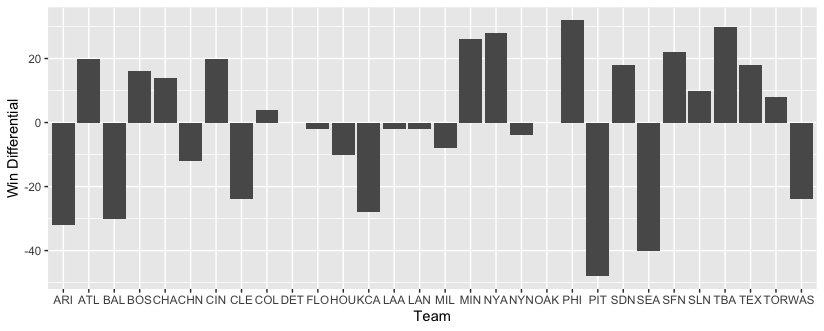 It comes to no surprise that we see the same teams towards the bottom and top. If we compare the run differential graph to the win differential graph, we see that the Rockies, Astros, Athletics, and Cardinals are some of the anomalies. For these teams it appears that it's not that Player Value is wrong at explaining a team's run differential, but rather that these teams just had a disconnect between their run differential and their winning percentage. They likely had some games where they got blown out or blew another team out; this has a larger impact on their run differential, but the same effect as any other win or loss on their win differential. I hope I have been able to show the value of Player Value as a metric! Player Value is measured in runs. Teams with a higher average Player Value are generally the same teams with higher run differentials and higher winning percentages. Teams with a lower average Player Value are generally the same teams with lower run differentials and lower winning percentages. If you want to be good, grab those guys with higher Player Values, and dump those guys with lower Player Values! FILES Time for the file dump! First, a note on the calculation of the first-quartile for each position. I do NOT include every single player at each position in the first-quartile. Rather, I create a subset of players based on playing time requirements. The idea is to get the starting players at each position for each team. I used the requirements of winning a Gold Glove as a baseline, which you can read about here. For the Gold Glove, position players must play in 698 innings by their team's 138th game. 138 games is equal to 1,242 total innings, so the requirement is about 56.2% of innings through the 138th game. I don't get or agree with the 138th game cutoff, so instead I extend this out to 162 games, which is 1,458 total innings. That makes the requirement 698/1458 = 47.9% of innings. For catchers, the requirement is 69 games by their team's 138th game, which is 50% of games. Extending this to 162 games, we get 69/162 = 42.6% of games or innings. With those requirements as a baseline, I set the first-quartile playing time requirement for position players to 45% of total season innings. Additionally, I required that a player played at least 70% of their innings at the position in question. Guys like Jose Bautista that had a 69%/29% split between RF/3B could greatly mess with their position's first-quartile since the fielding dynamics of different positions can be very different. Bautista had 112 assists (mainly due to his time at 3B), much more than most rightfielders, so his inclusion in the RF first-quartile calculation would greatly skew the results. Since Bautista gets his own first-quartile calculation based on his positional proportion split, we avoid having skewed results when comparing him to other rightfielders. Since DHs don't play in the field, the requirement is based on 45% of season games, rather than innings. The Gold Glove requirement for pitchers is 138 innings by their team's 138th game. Extending to 162 games or 1,458 innings, that's 138/1458 = 9.5% of total innings. That seemed like a round enough amount, so I set the first-quartile playing time requirement for starting pitchers to 9.50% of total season innings. We need a distinct first-quartile for relievers though, and you'll be hard pressed to find a relief pitcher that reaches 138 innings. I looked at the percent of total starters that reach 138 innings and used that to find an equivalent threshold for relievers. This came out to me setting the first-quartile playing time requirement for relief pitchers to 2.375% of total season innings. A typical good starter will log you about 200 innings, while a typical good reliever will log you about 50 innings. Since relievers pitch about 1/4 of the innings, I set their threshold at 1/4 of 9.5%, which is 2.375%. 9.5% of all innings is 138 innings, and 2.375% of all innings is 34.5 innings. The median number of innings for starters in 2010 was 137.8, and for relievers was 30. Using the thresholds described above, 49.5% of starters qualified and 46.3% of relievers qualified. The below files show the players that were used for the first-quartile calculation for each position:
The files below show the first-quartile values for the different positions. I used these to show the offensive expectations by position for my Batting Value post and the defensive expectations by position for my Fielding Value post.
The files below are the sort of "master files" for the 2010 Player Value example. They have the data for basically all of the things I've shared. The "2010PlayerValues" file will be of particular interest. It has the batting, baserunning, fielding, and appearance data for every position player in 2010. It also has their per opportunity values, how they compare to the first-quartile, and all of the components of Player Value. I've highlighted the Gold Glove winners, Silver Slugger winners, and the members of the 1st team, 2nd team, Worst team, and 1st-Quartile team. The "2010PitcherValues" file is basically the equivalent for pitchers, but the "2010pitchersComb" file has the different teams. That file combines the pitcher seasons of the AL and the NL, which is necessary for any pitcher that played part of their season in the AL and part in the NL. The main pitcher changes of 2010 of Oswalt and Lee remained in the same league, so this isn't that big of a deal. One example would be Jake Westbrook, who played for the Indians and the Cardinals. The "2010allplayerTotalPlayerValue" file combines the position players and the pitchers for a definitive list of the best players in 2010, according to Player Value.
Lastly, the R files below show how I processed all of this data and calculated Player Value for each player. Shout out to the Lahman package/dataset for providing the baseline player data. You'll need R/RStudio to be able to run the code and replicate the data. The first one is for the position players, the second one is for the pitchers, and the third one combines them to create some of the plots from above and the "2010allplayerTotalPlayerValue" file above. The "Yearly_wOBA_weights" workbook is read in by the R files, so it is needed as well. That file is essentially just a download from the FanGraphs Guts! page, which you can find here. The last file I posted in my initial Player Value post, but it shows the work behind the assumption that 90% of first base putouts are assisted, and that 93% of catcher putouts are via strikeout.
The file below is a summary list of the different award winners for 2010, according to Player Value.
Well, another lengthy post down, but that wraps up the rollout of the 2010 example season for Player Value. I will certainly go into less detail when sharing the results of the other seasons! The goal here was to display how Player Value is a quality measure of, well, the value of players. It tracks similarly but still distinctly to WAR, explains a team's ability to win well, and is a much simpler and more transparent metric.
I imagine my next post will be applying Player Value to the 2022 season to see how the Judge vs Ohtani discussion plays out. The 2022 season won't be in the Lahman dataset yet, so I'll have to grab all the data in a more manual way. After that, as I mentioned under my blurb about Austin Jackson above, I'm working on getting more data to use for Baserunning Value to improve it. I also look forward to updating and fine tuning my Hall of Fame predictive model. Thank you everyone for reading and let me know your thoughts in the comments below! Statting Lineup Newsletter Signup Form: If you'd like to receive email updates for each new post that I make, sign up for the Statting Lineup newsletter using the link below: https://weebly.us18.list-manage.com/subscribe?u=ab653f474b2ced9091eb248b1&id=3a60f3b85f An Application of My New Player Value Metric on the 2010 Season: Batting Value and Silver Sluggers9/18/2022 In my last post, I used the Fielding Value portion of my new Player Value metric to determine which players should have won a Gold Glove in 2010, as well as which two players were deserving of the Platinum Glove, had the award existed then. You can read about my Player Value metric here and an important addendum to the metric here. As a quick summary of the metric, each player gets credited and docked for the run-value of each event they achieve, from hitting a home run to striking out. These values are applied on a 'per opportunity' basis, such as per plate appearance or per inning. These are then compared to a player's positional first quartile value. If you hit fewer HR per PA than your position's first quartile, that means you are in the bottom 25% of home run hitters at your position, for example. We multiply the differences by a player's total # of opportunities to credit players that are able to stay healthy and play more. In this post, I will use the Batting Value portion of my Player Value metric to determine which players should have won a Silver Slugger, as well as which two players should have won the Hank Aaron Award in each league. Then I'll look at how Batting Value varies by position to show that it is not biased towards or against any particular position. Any player that is an elite hitter at their position has the chance to add the same amount of value. This is because of the inherent offensive expectations of each position. I don't reward guys that play positions that are more prone to product offensively like first base, right field, or DH because it is expected that guys that play those positions are good at offense. Each additional event that a player makes is basically worth the same, regardless of your position. Here's a look at the offensive expectations (first quartile values) by position in 2010:  First basemen, third basemen, corner outfielders, and designated hitters clearly tend to do more offensively. To compare a player to a league-wide average or first quartile would obviously benefit him if he played one of these positions, and hurt him if he played a different position like shortstop. Because of this, we compare players to their positional first quartile, and we weight each player's first quartile values depending on their proportion of games played at each position. So a 100% second baseman gets different first quartile values than a 60% second baseman that also plays 40% of his games at first. Here's a quick reminder of the run value weights for the relevant offensive events: Single: .30 runs Double: .58 runs Triple: .91 runs Home Run: 1.29 runs Unintentional Walk: .22 runs Intentional Walk: .17 runs Hit By Pitch: .24 runs Sacrifice Bunt: -.22 runs Sacrifice Fly: -.10 runs Strikeout: -.34 runs Groundball Double Play: -.75 runs Other Out: -.33 runs Note that I don't claim ultimate precision for my run value weights, so these have been rounded to 2 decimal places from the values shown in the Player Value explanation posts. Also recall that stolen bases and caught stealings are placed into Baserunning Value, a separate portion of total Player Value. SILVER SLUGGERS View the 2010 NL Silver Slugger winners here. View the 2010 AL Silver Slugger winners here. Read about the award and how it is decided here. The idea of the award is for it to go to the best hitting player at each position in each league. However, they only look at batting average, home runs, RBI, and total bases when deciding which players are the "best hitters". It's been around since 1980 and is voted on by MLB managers and coaches. Catchers NL Catcher Actual Winner: Brian McCann, Atlanta Braves NL Catcher Player Value Winner: Geovany Soto, Chicago Cubs
A pretty close call here. Soto led MLB and the NL with a Batting Value of 20.35, while McCann finished 3rd in MLB and 2nd in the NL with a Batting Value of 17.34. Both players spent about 99% of their time at catcher, and about 1% as the DH. Soto had a Batting Value Average of -.0444, while McCann had a Batting Value Average of -.0662. I know the negative values for Batting Value Average is a little tricky to interpret, but it makes sense in the context of a game where being successful roughly only 1/3 of the time is considered doing a good job. A player with a positive Batting Value Average is truly defying the laws of baseball and contributing more as a batter than they are causing harm. For the most part, a player should just seek to have a less negative Batting Value Average, meaning contributing more relative to their peers. A player with a positive Batting Value Average has done alarmingly well. Here are their batting rate values compared to their first quartiles, in the order of batting average, on-base percentage, slugging percentage, OPS, and wOBA: Soto: .280 vs .248, .393 vs .309, .497 vs .344, .890 vs .671, .387 vs .300 McCann: .269 vs .249, .375 vs .309, .453 vs .345, .828 vs .672, .362 vs .300 So Soto generally had higher rate values than McCann, while also having lower first quartile values than McCann since he spent slightly more time at catcher than at DH. Not surprisingly, DH's generally are better hitters than catchers. Here are some of their traditional batting counting stats: Soto: 387 PA, 54 1B, 19 2B, 0 3B, 17 HR, 53 RBI, 58 uBB, 4 IBB, 0 HBP, 83 SO, 0 SH, 3 SF, 5 GIDP McCann: 566 PA, 83 1B, 25 2B, 0 3B, 21 HR, 77 RBI, 64 uBB, 10 IBB, 9 HBP, 98 SO, 0 SH, 4 SF, 12 GIDP McCann has more of most events types given his more plate appearances, but some things like doubles, homers, and unintentional walks are pretty close considering the nearly 200 additional plate appearances that McCann had. In considering how a first quartile catcher would have fared had they played as often, here is how above and below they were in the different offensive events: Soto: 1.77 less singles, 4.75 more doubles, .01 less triples, 12.09 more homers, 35.68 more unintentional walks, 42.31 more strikeouts, 2.69 more intentional walks, 1.93 less hit by pitches, 0 more sac bunts, .90 more sac flies, 2.78 less groundball double plays, and 21.46 less other outs McCann: 1.48 more singles, 4.14 more doubles, .01 less triples, 13.77 more homers, 31.27 more unintentional walks, 38.28 more strikeouts, 8.09 more intentional walks, 6.19 more hit by pitches, 0 more sac bunts, .93 more sac flies, .64 more groundball double plays, 1.81 more other outs Baseball Reference has Soto with an Rbat of 19 in 2010, and McCann with an Rbat of 18. FanGraphs has Soto at a wRAA of 20.5, the 2nd most in MLB and highest in the NL. They have McCann with a wRAA of 18.4, the 4th most in MLB and 2nd highest in the NL. My metric thus agrees with Rbat and wRAA that Soto was a better offensive player than McCann. The worst offensive catcher in the NL was Ivan Rodriguez of the Washington Nationals, with a Batting Value of -22.32. It was a tough penultimate season for the Hall of Famer, as Pudge's Rbat was -13 and his wRAA was -13.1, the 9th worst in MLB and 2nd worst in the NL. Koyie Hill of the Cubs had the worst wRAA in the NL at -14.8, and I had his Batting Value at -15.26. AL Catcher Actual Winner: Joe Mauer, Minnesota Twins AL Catcher Player Value Winner: Joe Mauer, Minnesota Twins  This award was handed out correctly, as Mauer led the AL and was 2nd in MLB among catchers with a Batting Value of 17.40. The next highest in the AL was Victor Martinez of the Boston Red Sox, who had a Batting Value of 11.34. Mauer spent about 83% of his time at catcher and the remaining 13% at DH, while Martinez played catcher 86% of the time, first base 11% of the time, and DH 3% of the time. Mauer had a Batting Value Average of -.0622 compared to a first quartile of -.1169, while Martinez had a Batting Value Average of -.0726 vs a first quartile of 0.1206. Here are how Mauer and Martinez compared against their first quartiles in terms of AVG, OBP, SLG, OPS, and wOBA: Mauer: .327 vs .252, .402 vs .317, .469 vs .359, .871 vs .695, .377 vs .309 Martinez: .302 vs .248, .400 vs .309, .447 vs .343, .847 vs .670, .368 vs .299 Here are how Mauer and Martinez compare in terms of some traditional counting batting stats: Mauer: 584 PA,114 1B, 43 2B, 1 3B, 9 HR, 75 RBI, 51 uBB, 14 IBB, 3 HBP, 0 SH, 6 SF, 53 SO, 19 GIDP Martinez: 538 PA, 96 1B, 32 2B, 1 3B, 20 HR, 79 RBI, 35 uBB, 5 IBB, 0 HBP, 0 SH, 5 SF, 52 SO, 17 GIDP Here are how Mauer and Martinez compare relative to their first quartiles overall: Mauer: +31.59 1B, +20.75 2B, +.85 3B, -.11 HR, +14.37 uBB, -15.21 SO, +11.89 IBB, +.25 HBP, +0 SH, +2.79 SF, +7.83 GIDP, +27.28 other Outs Martinez: +19.53 1B, +11.93 2B, +.97 3B, +11.98 HR, +1.78 uBB, -8.38 SO, +2.98 IBB, -2.57 HBP, +0 SH, +2.06 SF, +6.52 GIDP, +47.95 other Outs Mauer's Rbat was 26, while Martinez's Rbat was 15. Mauer had a wRAA of 26.1, the highest in MLB and the AL. Martinez had a wRAA of 18.6, the 3rd most in MLB and 2nd most in the AL. The worst offensive catcher in the AL was Jason Kendall of the Kansas City Royals, with a Batting Value of -18.59. It was a tough final season for Kendall, who had an Rbat of -19 and a wRAA of -16, the 3rd worst in MLB and the AL. Jeff Mathis of the Angels had the worst wRAA at -17.7, and I had his Batting Value at -17.32 for the 4th worst in MLB and 3rd worst in the AL. First Basemen NL First Base Actual Winner: Albert Pujols, St. Louis Cardinals NL First Base Player Value Winner: Joey Votto, Cincinnati Reds
Votto led MLB and the NL with a Batting Value of 41.30. Across all positions, Votto had the 2nd largest Batting Value in MLB and the largest in the NL. Pujols had a Batting Value of 36.42, good for 3rd in MLB and 2nd in the NL at first base. Both players were 100% first basemen, and the position's first quartile Batting Value Average was -.0906. Votto had a Batting Value Average of -.0092, and Pujols had a Batting Value Average of -.0209. Here are their AVG, OBP, SLG, OPS, and wOBA first quartile comparisons: Votto: .324 vs .250, .424 vs .332, .600 vs .406, 1.024 vs .749, .438 vs .332 Pujols: .312 vs .250, .414 vs .332, .596 vs .406, 1.011 vs .749, .419 vs .332 Here are their traditional counting batting stats: Votto: 648 PA, 102 1B, 36 2B, 2 3B, 37 HR, 113 RBI, 83 uBB, 8 IBB, 7 HBP, 0 SH, 3 SF, 125 SO, 11 GIDP Pujols: 700 PA, 101 1B, 39 2B, 1 3B, 42 HR, 118 RBI, 65 uBB, 38 IBB, 4 HBP, 0 SH, 6 SF, 76 SO, 23 GIDP Here are their comparisons relative to their firrst quartiles: Votto: +17.84 1B, +10.42 2B, +2 3B, +18.07 HR, +25.67 uBB, +24.7 SO, +3.73 IBB, +4.76 HBP, +0 SH, -.73 SF, +.78 GIDP, -18.97 other Outs Pujols: +10.08 1B, +11.36 2B, +1 3B, +21.55 HR, +3.07 uBB, -32.35 SO, +33.38 IBB, +1.58 HBP, +0 SH, +1.97 SF, +11.96 GIDP, +31.73 other Outs Votto had an Rbat of 56, and Pujols had an Rbat of 54. Votto had a wRAA of 60.6, the most in MLB and in the NL. Pujols had a wRAA of 54.6, the 3rd most in MLB and 2nd most in the NL. The worst offensive first baseman in the NL was Garrett Jones of the Pittsburgh Pirates, with a Batting Value of -23.15. He had an Rbat of -4 and a wRAA of -3.1. The lowest wRAA in the NL was Jeff Clement of the Pirates at -8, who I had at a Batting Value of -10.45. AL First Base Actual Winner: Miguel Cabrera, Detroit Tigers AL First Base Player Value Winner: Miguel Cabrera, Detroit Tigers  Another Silver Slugger awarded correctly, as Miggy led the AL and finished 2nd in MLB with a Batting Value of 40.38. This was good for 3rd most in MLB and 2nd most in the AL across all positions. His closest competitor at first base was Paul Konerko of the Chicago White Sox, who had a Batting Value of 31.04. Cabrera had a 99%/1% split between time at first base and DH, while Konerko had an about 85%/15% split. Cabrera had a Batting Value Average of -.0105 compared to a first quartile of -.0904, while Konerko had a Batting Value Average of -.0226 vs a first quartile of -.0877. Here are their AVG, OBP, SLG, OPS, and wOBA first quartile comparisons: Cabrera: .328 vs .250, .420 vs .332, .622 vs .406, 1.042 vs .749, .431 vs .332 Konerko: .312 vs .253, .393 vs .336, .584 vs .411, .977 vs .760, .417 vs .336 Here are their traditional counting batting stats: Cabrera: 648 PA, 96 1B, 45 2B, 1 3B, 38 HR, 126 RBI, 57 uBB, 32 IBB, 3 HBP, 0 SH, 8 SF, 95 SO, 17 GIDP Konerko: 631 PA, 101 1B, 30 2B, 1 3B, 39 HR, 111 RBI, 65 uBB, 7 IBB, 5 HBP, 0 SH, 6 SF, 110 SO, 9 GIDP Here are their comparisons relative to their first quartiles: Cabrera: +11.87 1B, +19.37 2B, +.99 3B, +19.06 HR, -.33 uBB, -5.49 SO, +27.74 IBB, +.76 HBP, +0 SH, +4.27 SF, +6.79 GIDP, +3.25 other Out Konerko: +19.46 1B, +4.57 2B, +.85 3B, +20.43 HR, +9.15 uBB, +10.16 SO, +3 IBB, +2.84 HBP, +0 SH, +2.36 SF, -.79 GIDP, +14.19 other Out Cabrera had an Rbat of 55, and Konerko had an Rbat of 48. Cabrera had a wRAA of 57.1, the 2nd most in MLB and most in the AL. Konerko had a wRAA of 4784, the 4th most in MLB and 2nd most in the AL. The worst offensive first baseman in the AL was Casey Kotchman of the Seattle Mariners with a Batting Value of -30.82. Kotchman also had the worst wRAA in MLB and the AL at -18.5. He had the 3rd worst Batting Value in MLB across all positions. Second Basemen NL Second Base Actual Winner: Dan Uggla, Florida Marlins NL Second Base Player Value Winner: Dan Uggla, Florida Marlins  This one was also rewarded correctly, as Uggla led the NL and was 2nd in MLB with a Batting Value of 33.34. Rickie Weeks of the Milwaukee Brewers was the next closest, finishing 3rd in MLB and 2nd in the NL with a Batting Value of 30.16. Uggla was 100% a second baseman, while Weeks spent 99% of his time at second and was a DH 1% of the time. Uggla had a Batting Value Average of -.0516 vs a first quartile of -.1112, while Weeks had a Batting Value Average of -.0609 vs a first quartile of -.1109. Here are their AVG, OBP, SLG, OPS, and wOBA first quartile comparisons: Uggla: .287 vs .267, .369 vs .329, .508 vs .374, .877 vs .699, .382 vs .311 Weeks: .269 vs .267, .366 vs .329, .464 vs .375, .830 vs .699, .368 vs .311 Here are their traditional counting batting stats: Uggla: 674 PA, 105 1B, 31 2B, 0 3B, 33 HR, 105 RBI, 76 uBB, 2 IBB, 2 HBP, 0 SH, 5 SF, 149 SO, 9 GIDP Weeks: 754 PA, 110 1B, 32 2B, 4 3B, 29 HR, 83 RBI, 76 uBB, 0 IBB, 25 HBP, 0 SH, 2 SF, 184 SO, 5 GIDP Here are their comparisons relative to their first quartiles: Uggla: +.6 1B, +4.06 2B, -1.31 3B, +26.1 HR, +32.25 uBB, +71.98 SO, +1.75 IBB, -2.21 HBP, -1.51 SH, +2.04 SF, +.06 GIDP, -48.03 other Outs Weeks: -6.66 1B, +1.84 2B, +2.54 3B, +21.19 HR, +26.94 uBB, +97.53 SO, -.3 IBB, +20.3 HBP, -1.68 SH, -1.32 SF, -5.01 GIDP, -59.41 other Outs Uggla had an Rbat of 27, while Weeks had an Rbat of 22. Uggla had a wRAA of 32.7, the 2nd most in MLB and most in the NL. Weeks had a wRAA of 28.1, the 4th most in MLB and 3rd most in the NL. In between them was Kelly Johnson of the Dbacks with a wRAA of 30.8, who I had with a Batting Value of 28.34 (4th most in MLB, 3rd most in the NL). The worst offensive second baseman in the NL was Ryan Theriot of the Chicago Cubs and the Los Angeles Dodgers, with a Batting Value of -18.04. He played 96 games with the Cubs and 54 with the Dodgers. He had an Rbat of -11 and a wRAA of -17.7, the 2nd most in MLB and most in the NL. AL Second Base Actual Winner: Robinson Cano, New York Yankees AL Second Base Player Value Winner: Robinson Cano, New York Yankees  This one was right on the money, as Cano led all of MLB and the AL with a Batting Value of 35.99. His closest competitor was Dustin Pedroia of the Boston Red Sox, with a Batting Value of 14.53. Cano was about a 99% second baseman and 1% DH, while Pedroia was 100% a second baseman. Cano had a Batting Value Average of -.0489 vs a first quartile of -.1107, and Pedroia had a Batting Value Average of -.0597 vs a first quartile of -.1112. Here are their AVG, OBP, SLG, OPS, and wOBA first quartile comparisons: Cano: .319 vs .267, .381 vs .329, .534 vs .375, .914 vs .700, .391 vs .311 Pedroia: .288 vs .267, .367 vs .329, .493 vs .374, .860 vs .699, .373 vs .311 Here are their traditional counting batting stats: Cano: 696 PA, 127 1B, 41 2B, 3 3B, 29 HR, 109 RBI, 43 uBB, 14 IBB, 8 HBP, 0 SH, 5 SF, 77 SO, 19 GIDP Pedroia: 351 PA, 50 1B, 24 2B, 1 3B, 12 HR, 41 RBI, 36 uBB, 1 IBB, 3 HBP, 2 SH, 4 SF, 83 SO, 4 GIDP Here are their comparisons relative to their first quartiles: Cano: +19.45 1B, +13.14 2B, +1.65 3B, +21.7 HR, -2.39 uBB, -3.08 SO, +13.71 IBB, +3.67 HBP, -1.54 SH, +1.93 SF, +9.76 GIDP, +10.68 other Outs Pedroia: -4.37 1B, +9.97 2B, +.32 3B, +8.41 HR, +13.22, -2.11 SO, +.87 IBB, +1.81 HBP, +1.21 SH, +4.46 SF, +2.34 GIDP, +8.55 other Outs Cano had an Rbat of 33, while Pedroia had an Rbat of 10. Cano had a wRAA of 39, the most in MLB and in the AL. Pedroia had a wRAA of 14.7, the 2nd most in the AL. The worst offensive second baseman in the AL was Luis Valbuena of the Cleveland Indians, with a Batting Value of -17.9. He had an Rbat of -18 and a wRAA of -18.7, the worst in MLB and in the AL. Third Basemen NL Third Base Actual Winner: Ryan Zimmerman, Washington Nationals NL Third Base Player Value Winner: Ryan Zimmerman, Washington Nationals  This one was also awarded correctly, as Zimmerman led MLB and the NL with a Batting Value of 22.07. The next most in the NL was David Wright of the New York Mets, who had a Batting Value of 17.23. Both guys were about 99% third basemen and 1% DHs. Zimmerman had a Batting Value Average of -.0505 vs a first quartile of -.1068, while Wright had a Batting Value Average of -.0614 vs a first quartile of -.1069. Here are their AVG, OBP, SLG, OPS, and wOBA first quartile comparisons: Zimmerman: .307 vs .247, .388 vs .320, .510 vs .397, .899 vs .721, .390 vs .316 Wright: .283 vs .247, .354 vs .320, .503 vs .397, .856 vs .721, .366 vs .316 Here are their traditional counting batting stats: Zimmerman: 603 PA, 104 1B, 32 2B, 0 3B, 25 HR, 85 RBI, 63 uBB, 6 IBB, 4 HBP, 0 SH, 5 SF, 98 SO, 16 GIDP Wright: 670 PA, 98 1B, 36 2B, 3 3B, 29 HR, 103 RBI, 60 uBB, 9 IBB, 2 HBP, 0 SH, 12 SF, 161 SO, 12 GIDP Here are their comparisons relative to their first quartiles: Zimmerman: +19.78 1B, +5.52 2B, -1.09 3B, +12.14 HR, +30.99 uBB, +20.11 SO, +4.41 IBB, +2.49 HBP, +0 SH, +0 SF, +4.02 GIDP, +.15 other Outs Wright: +4.42 1B, +6.58 2B, +1.79 3B, +14.71 HR, +24.45 uBB, +74.49 SO, +7.23 IBB, +.33 HBP, +0 SH, +6.44 SF, -1.31 GIDP, -29.64 other Outs Zimmerman had an Rbat of 31, and Wright had an Rbat of 22. Zimmerman had a wRAA of 33.1, the 2nd most in MLB and most in the NL. Wright had a wRAA of 24.1, good for 4th most in MLB and 2nd most in the NL. The worse offensive third baseman in the NL was Pedro Feliz of the Houston Astros and St. Louis Cardinals, with a Batting Value of -36.14. In his final season, Feliz played 97 games with the Astros and 40 games with the Cardinals. He had an Rbat of -10 and a wRAA of -29.5, the worst in MLB and in the NL. His Batting Value was the 2nd worst in MLB across all positions. AL Third Base Actual Winner: Adrian Beltre, Boston Red Sox AL Third Base Player Value Winner: Adrian Beltre, Boston Red Sox  And yet another award given out correctly! Silver Sluggers are turning out pretty well. Beltre came 2nd in MLB and led the AL with a Batting Value of 20.78. Finishing just behind him was Evan Longoria of the Tampa Bay Rays with a Batting Value of 20.35. Both players were 100% third basemen, where the positional first quartile Batting Value Average was -.1071. Beltre had a Batting Value Average of -.0549 and Longoria had a Batting Value Average of -.0565. Here are their AVG, OBP, SLG, OPS, and wOBA first quartile comparisons: Beltre: .321 vs .247, .365 vs .320, .553 vs .396, .919 vs .720, .391 vs .316 Longoria: .294 vs .247, .372 vs .320, .507 vs .396, .879 vs .720, .375 vs .316 Here are their traditional counting batting stats: Beltre: 641 PA, 110 1B, 49 2B, 2 3B, 28 HR, 102 RBI, 30 uBB, 10 IBB, 5 HBP, 0 SH, 7 SF, 82 SO, 25 GIDP Longoria: 661 PA, 96 1B, 46 2B, 5 3B, 22 HR, 104 RBI, 60 uBB, 12 IBB, 5 HBP, 0 SH, 10 SF, 124 SO, 15 GIDP Here are their comparisons relative to their first quartiles: Beltre: +20.41 1B, +20.85 2B, +.84 3B, +14.37 HR, -3.86 uBB, -.57 SO, +8.32 IBB, +3.4 HBP, +0 SH, +1.67 SF, +12.24 GIDP, +27.17 other Outs Longoria: +3.61 1B, +16.98 2B, +3.81 3B, +7.95 HR, +25.08 uBB, +38.85 SO, +10.27 IBB, +3.35 HBP, +0 SH, +4.5 SF, +1.84 GIDP, -8.12 other Outs Beltre had an Rbat of 29, and Longoria had an Rbat of 30. Beltre had a wRAA of 35.8, the most in MLB and in the AL. Longoria had a wRAA of 28.8, the 3rd most in MLB and 2nd most in the AL. The worst offensive third baseman in the AL was Jose Lopez of Seattle Mariners, with a Batting Value of -38.26. In fact, Lopez had the worst Batting Value in MLB across all positions. You may recall from my last post that Lopez had the highest Fielding Value among AL third basemen, but his terrible batting was more than enough to make him a poor third baseman overall. Lopez had an Rbat of -22, and a wRAA of -25.6, the 3rd worst in MLB and 2nd worst in the AL. Brandon Wood of the Angels had the worst wRAA in the AL at -28.7, and I had his Batting Value at -28.37 for 3rd worst in MLB and 2nd worst in the AL. Shortstops NL Shortstop Actual Winner: Troy Tulowitzki, Colorado Rockies NL Shortstop Player Value Winner: Troy Tulowitzki, Colorado Rockies  This Silver Slugger was also given out correctly, as Tulo led MLB and the NL with a Batting Value of 39.75. Hanley Ramirez of the Florida Marlins finished 2nd in MLB and the NL with a Batting Value of 32.78. Both players were 100% shortstops, where the first quartile Batting Value Average was -.1261. Tulowtizki had a Batting Value Average of -.0405 and Ramirez had a Batting Value Average of -.0627. Here are their AVG, OBP, SLG, OPS, and wOBA first quartile comparisons: Tulowitzki: .315 vs .250, .381 vs .294, .568 vs .326, .949 vs .652, .406 vs .294 Ramirez: .300 vs .250, .378 vs .294, .475 vs .326, .853 vs .652, .369 vs .294 Here are their traditional counting batting stats: Tulowitzki: 529 PA, 86 1B, 32 2B, 3 3B, 27 HR, 95 RBI, 44 uBB, 4 IBB, 5 HBP, 1 SH, 5 SF, 78 SO, 17 GIDP Ramirez: 619 PA, 112 1B, 28 2B, 2 3B, 21 HR, 76 RBI, 52 uBB, 12 IBB, 7 HBP, 0 SH, 5 SF, 93 SO, 14 GIDP Here are their comparisons relative to their first quartiles: Tulowitzki: +.37 1B, +13.25 2B, +1.37 3B, +23.27 HR, +20.48 uBB, +14.62 SO, +3.14 IBB, +2.84 HBP, -1.48 SH, +2.86 SF, +10.49 GIDP, -23.57 other Outs Ramirez: +11.8 1B, +6.06 2B, +.1 3B, +16.63 HR, +24.47 uBB, +18.84 SO, +10.99 IBB, +4.47 HBP, -2.9 SH, +2.5 SF, +6.39 GIDP, -20.2 other Outs Tulowitzki had an Rbat of 24, and Hanley Ramirez had an Rbat of 20. Tulo had a wRAA of 36.1, the most in MLB and in the NL. Ramirez had a wRAA of 23.9, the 2nd most in MLB and in the NL. The worst offensive shortstop in the NL was Brendan Ryan of the St. Louis Cardinals, with a Batting Value of -15.71. Like Jose Lopez, Ryan was also an elite defender and terrible hitter, but fortunately unlike Lopez, Ryan's fielding at least outweighs his batting. Ryan had an Rbat of -26 and a wRAA of -25.6, the 3rd worst in MLB and worst in the NL. AL Shortstop Actual Winner: Alexei Ramirez, Chicago White Sox AL Shortstop Player Value Winner: Alexei Ramirez, Chicago White Sox  This makes for 7 awards in a row handed out correctly! Alexei Ramirez led the AL with a Batting Value of 8.87, but finished 6th in MLB overall. Among the other NL shortstops that were superior batters are Stephen Drew of the Dbacks, Rafael Furcal of the Dodgers, and Jose Reyes of the Mets. The next highest in the AL was technically Alex Gonzalez, but he had a near 50/50 split between the Blue Jays and the Braves in 2010. The next highest solely AL player was Marco Scutaro of the Boston Red Sox, with a Batting Value of 6.84. If you'll recall from my last post, interestingly enough Ramirez was also the best fielding shortstop in the AL, while Scutaro was the worst. Ramirez was 100% a shortstop, while Scutaro was 89% a shortstop and 11% a second baseman. Ramirez had a Batting Value Average of -.1015 vs a first quartile of -.1261, and Scutaro had a Batting Value Average of -.1042 vs a first quartile of -.1245. Here are their AVG, OBP, SLG, OPS, and wOBA first quartile comparisons: Ramirez: .282 vs .250, .313 vs .294, .431 vs .326, .744 vs .652, .324 vs .294 Scutaro: .275 vs .252, .333 vs .298, .388 vs .331, .721 vs .657, .321 vs .296 Here are their traditional counting batting stats: Ramirez: 626 PA, 116 1B, 29 2B, 2 3B, 18 HR, 70 RBI, 25 uBB, 2 IBB, 2 HBP, 7 SH, 5 SF, 82 SO, 12 GIDP Scutaro: 695 PA, 125 1B, 38 2B, 0 3B, 11 HR, 56 RBI, 52 uBB, 1 IBB, 3 HBP, 4 SH, 3 SF, 71 SO, 14 GIDP Here are their comparisons relative to their first quartiles: Ramirez: +14.67 1B, +6.82 2B, +.07 3B, +13.58 HR, -2.84 uBB, +7 SO, +.98 IBB, -.56 HBP, +4.07 SH, +2.47 SF, +4.3 GIDP, +29.48 other Outs Scutaro: +13.02 1B, +13.03 2B, -2.05 3B, +5.86 HR, +19.56 uBB, -11.85 SO, -.04 IBB, +0 HBP, +.93 SH, +.17 SF, +4.38 GIDP, +45.83 other Outs Ramirez had an Rbat of 0 and Scutaro had an Rbat of -5. Ramirez had a wRAA of 1.7, which is highest in the AL among mainly shortstops but just 10th most in MLB. Jed Lowrie of the A's comes out higher at 11.8, but he didn't spend at least 50% of his time at any one position so I have him down as a utility guy. Scutaro had a wRAA of 0.1. The worst offensive shortstop in the AL was Cesar Izturis of the Baltimore Orioles, with a Batting Value of -22.86. He had an Rbat of -30 and a wRAA of -29.7, the worst in MLB and in the AL. Outfielders NL Outfield Actual Winner #1: Carlos Gonzalez, Colorado Rockies NL Outfield Actual Winner #2: Matt Holliday, St. Louis Cardinals NL Outfield Actual Winner #3: Ryan Braun, Milwaukee Brewers NL Outfield Player Value Winner #1: Carlos Gonzalez, Colorado Rockies NL Outfield Player Value Winner #2: Matt Holliday, St. Louis Cardinals (Best LF) NL Outfield Player Value Winner #3: Colby Rasmus, St. Louis Cardinals (Best CF) NL Rightfield Player Value Winner: Jayson Werth, Philadelphia Phillies
Got 2 out of the 3 outfield Silver Sluggers correct. Cargo led the NL and finished 3rd in MLB among outfielders with a Batting Value of 40.02. Cardinals teammates Holliday and Rasmus finished 2nd and 3rd in the NL and 4th and 5th in MLB with Batting Values of 33.73 and 24.74, respectively. Braun had a Batting Value of 20.47, which was 4th in MLB and 2nd in the NL among left fielders. Werth had a Batting Value of 22.2, the 2nd most in MLB and most in the NL among right fielders. Here are their AVG, OBP, SLG, OPS, wOBA, and Batting Value Average first quartile comparisons: Gonzalez: .336 vs .257, .376 vs .329, .598 vs .390, .974 vs .726, .413 vs .323, -.0281 vs -.1016 Holliday: .312 vs .262, .390 vs .332, .532 vs .386, .922 vs .730, .397 vs .324, -.0423 vs -.0996 Rasmus: .276 vs .249, .361 vs .319, .498 vs .364, .859 vs .680, .369 vs .307, -.0577 vs -.1149 Braun: .304 vs .262, .365 vs .332, .501 vs .386, .866 vs .730, .378 vs .324, -.0624 vs -.0996 Werth: .296 vs .259, .388 vs .338, .532 vs .427, .921 vs .775, .396 vs .339, -.0402 vs -.0888 Here are their traditional counting batting stats: Gonzalez: 636 PA, 120 1B, 34 2B, 9 3B, 34 HR, 117 RBI, 32 uBB, 8 IBB, 2 HBP, 0 SH, 7 SF, 135 SO, 9 GIDP Holliday: 675 PA, 112 1B, 45 2B, 1 3B, 28 HR, 103 RBI, 59 uBB, 10 IBB, 8 HBP, 0 SH, 2 SF, 93 SO, 13 GIDP Rasmus: 534 PA, 74 1B, 28 2B, 3 3B, 23 HR, 66 RBI, 54 uBB, 9 IBB, 1 HBP, 2 SH, 4 SF, 148 SO, 5 GIDP Braun: 684 PA, 117 1B, 45 2B, 1 3B, 25 HR, 103 RBI, 55 uBB, 1 IBB, 6 HBP, 0 SH, 3 SF, 105 SO, 17 GIDP Werth: 652 PA, 89 1B, 46 2B, 2 3B, 27 HR, 85 RBI, 76 uBB, 6 IBB, 7 HBP, 0 SH, 9 SF, 147 SO, 11 GIDP Here are their comparisons relative to their first quartiles: Gonzalez: +30.79 1B, +8.67 2B, +6.48 3B, +24.07 HR, -9.63 uBB, +41.77 SO, +6.73 IBB, -.41 HBP, -.35 SH, +4.63 SF, +1.49 GIDP, -16.92 other Outs Holliday: +14.16 1B, +16.59 2B, -.78 3B, +19.07 HR, +15.71 uBB, -.46 SO, +8.92 IBB, +4.91 HBP, +0 SH, -.94 SF, +5.81 GIDP, +18.4 other Outs Rasmus: +1.3 1B, +10.01 2B, +.02 3B, +18.19 HR, +19.88 uBB, +69.12 SO, +8.14 IBB, -1.02 HBP, +1.2 SH, +2.41 SF, +.04 GIDP, -41.16 other Outs Braun: +17.86 1B, +16.21 2B, -.81 3B, +15.95 HR, +11.13 uBB, +10.29 SO, -.09 IBB, +2.87 HBP, +0 SH, +.02 SF, +9.71 GIDP, +19.6 other Outs Werth: -1.18 1B, +17.48 2B, -.55 3B, +9.67 HR, +30.7 uBB, +44.6 SO, +4.04 IBB, +5.24 HBP, -.13 SH, +6.55 SF, +.4 GIDP, -23.72 other Outs Gonzalez had an Rbat of 36 and a wRAA of 46.8, the 3rd most in MLB and most in the NL among outfielders. Holliday had an Rbat of 39 and a wRAA of 41.2, the 4th most in MLB and 2nd most in the NL. Rasmus had an Rbat of 20 and a wRAA of 20.4. Braun had an Rbat of 30 and a wRAA of 31.3, the 4th most in the NL. Werth had an Rbat of 34 and a wRAA of 39, the 3rd most in the NL. So the other advanced metrics treat outfielders more uniformly since they get compared to league averages across all positions. My Batting Value metric rewards Rasmus more by acknowledging that his level of offensive production was rare and unique among centerfielders. However, do recall that Rasmus had the 2nd worst Fielding Value in the NL among outfielders. The worst offensive outfielders in the NL were Jeff Francoeur of the New York Mets with a Batting Value of -21.89, Garrett Anderson of the Los Angeles Dodgers with a Batting Value of -17.25, and Carlos Lee of the Houston Astros with a Batting Value of -16.21. Francouer spent some time with the Rangers (15 games), but spent the vast majority of the year in the NL with the Mets (124 games). He had an Rbat of -13 and a wRAA of -10.6, the 5th worst in the NL. Anderson had an Rbat of -14 in his final season and a wRAA of -15, the 2nd worst in MLB and in the NL. Lee has the unique distinction of being among the 3 worst outfielders in the NL in terms of both Fielding Value and Batting Value. He had an Rbat of -9 and a wRAA of -5.9. Nyjer Morgan of the Washington Nationals had the worst wRAA in MLB and in the NL at -15.3, and I had his Batting Value at -11.66. AL Outfield Actual Winner #1: Josh Hamilton, Texas Rangers AL Outfield Actual Winner #2: Carl Crawford, Tampa Bay Rays AL Outfield Actual Winner #3: Jose Bautista, Toronto Blue Jays AL Outfield Player Value Winner #1: Josh Hamilton, Texas Rangers (Best LF) AL Outfield Player Value Winner #2: Jose Bautista, Toronto Blue Jays (Best RF) AL Outfield Player Value Winner #3: Carl Crawford, Tampa Bay Rays AL Centerfield Player Value Winner: Vernon Wells, Toronto Blue Jays
Hamilton led MLB and the AL outfielders with a Batting Value of 48.48. He also led MLB across all positions. Bautista finished 2nd in MLB and the AL among outfielders with a Batting Value of 40.29, good for 4th in MLB and 2nd in the AL across all positions. Crawford finished 3rd best in the AL among outfielders with a Batting Value of 21.10, so we have quite a disparity between the top 2 and the rest. Wells led all AL centerfielders with a Batting Value of 21.08, but was barely surpassed by Crawford among all outfield positions. That means we got all 3 of the AL outfielders right! Here are their AVG, OBP, SLG, OPS, wOBA, and Batting Value Average first quartile comparisons: Hamilton: .359 vs .259, .411 vs .331, .633 vs .384, 1.044 vs .724, .445 vs .322, -.0085 vs -.1016 Bautista: .260 vs .257, .378 vs .334, .617 vs .425, .995 vs .768, .422 vs .336, -.0160 vs -.0913 Crawford: .307 vs .262, .356 vs .333, .495 vs .387, .851 vs .731, .369 vs .324, -.0598 vs -.0993 Wells: .273 vs .250, .331 vs .320, .515 vs .365, .847 vs .683, .363 vs .308, -.0707 vs -.1141 Here are their traditional counting batting stats: Hamilton: 571 PA, 111 1B, 40 2B, 3 3B, 32 HR, 100 RBI, 38 uBB, 5 IBB, 5 HBP, 1 SH, 4 SF, 95 SO, 11 GIDP Bautista: 683 PA, 56 1B, 35 2B, 3 3B, 54 HR, 124 RBI, 98 uBB, 2 IBB, 10 HBP, 0 SH, 4 SF, 116 SO, 10 GIDP Crawford: 657 PA, 122 1B, 30 2B, 13 3B, 19 HR, 90 RBI, 43 uBB, 3 IBB, 3 HBP, 3 SH, 5 SF, 104 SO, 2 GIDP Wells: 646 PA, 83 1B, 44 2B, 3 3B, 31 HR, 88 RBI, 45 uBB, 5 IBB, 3 HBP, 0 SH, 3 SF, 84 SO, 18 GIDP Here are their comparisons relative to their first quartiles: Hamilton: +30.55 1B, +17.17 2B, +1.08 3B, +24.29 HR, +.24 uBB, +12.63 SO, +3.93 IBB, +2.57 HBP, +.76 SH, +1.66 SF, +4.97 GIDP, -12.3 other Outs Bautista: -38.65, +4.47 2B, +.94 3B, +35.62 HR, +52.94 uBB, +13.48 SO, -.15 IBB, +8.25 HBP, -.01 SH, +.44 SF, -2.27 GIDP, +24.86 other Outs Crawford: +26.94 1B, +2.32 2B, +11.27 3B, +10.15 HR, +.64 uBB, +12.69 SO, +1.92 IBB, +.01 HBP, +3 SH, +2.12 SF, -5.03 GIDP, +32.54 other Outs Wells: -4.83 1B, +22.1 2B, -.55 3B, +24.92 HR, +3.43 uBB, -11.77 SO, +3.92 IBB, +.56 HBP, -.95 SH, +1.05 SF, +11.94 GIDP, +56.49 other Outs Hamilton had an Rbat of 51 and a wRAA of 56.8, the most in MLB and the AL. Bautista also had an Rbat of 51 and a wRAA of 55.1, the 2nd most in MLB and the AL. Crawford had an Rbat of 28 and a wRAA of 25.2. Wells had an Rbat of 19 and a wRAA of 21.9. Shin-Soo Choo and Nick Swisher rated better than Crawford and Wells in terms of wRAA at 33.6 and 29.5, respectively. I had Choo still faring pretty well with a Batting Value of 13.43, but Swisher not as much at 6.46. The worst offensive outfielders in the AL were Juan Pierre of the Chicago White Sox with a Batting Value of -19.95, Trevor Crowe of the Cleveland Indians with a Batting Value of -18.50, and Ichiro Suzuki of the Seattle Mariners with a Batting Value of -15.38. Ichiro! What! But he batted .315! Sure, but his slugging, OPS, wOBA, and Batting Value Average are all worse than the first quartile. Ichiro gets a lot of hits, but the vast majority of them are singles, and he doesn't walk very often. His teammate Franklin Gutierrez had the worst wRAA in the AL at -15.43, and had a Batting Value of -10.17. Pierre had the 2nd worst wRAA in the AL at -11.1. Pitchers and Designated Hitters NL Pitcher Actual Winner: Yovani Gollardo, Milwaukee Brewers NL Pitcher Player Value Winner: Yovani Gollardo, Milwaukee Brewers  Nowadays the hitting ability of a pitcher no longer really matters, but in 2010 pitchers in the NL still hit and could provide value in that manner. Gallardo led all NL pitchers with a Batting Value of 9.07, and was properly identified as the best hitting pitcher in the league. The next best was Dan Haren of the Arizona Diamondbacks, who had a Batting Value of 7.90. Starters get more plate appearances so they have more opportunities to increase their Batting Value. The best hitting relief pitcher was Gustavo Chacin of the Houston Astros with a Batting Value of 1.29. Pitchers in the AL can still provide Batting Value when on the road against NL teams, but the amounts generally aren't consequential so I won't dive into those. No Silver Slugger award is given to AL pitchers. Here are their AVG, OBP, SLG, OPS, wOBA, and Batting Value Average first quartile comparisons: Gallardo: .254 vs .104, .329 vs .127, .508 vs .113, .837 vs .246, .631 vs .650, -.940 vs -1.162 Haren: .364 vs .104, .375 vs .127, .527 vs .113, .902 vs .246, .996 vs .650, -.993 vs -1.162 An .837 OPS for a pitcher is certainly something to marvel at, but granted that he did this in only 72 plate appearances. Shohei Ohtani had a .965 OPS in 2021 with 639 plate appearances. According to Stathead, Gallardo's season ranks as the 65th best pitcher season in terms of OPS among pitchers with at least 70 plate appearances. Haren's OPS was even better, but he had even fewer plate appearances with just 57. Here are their traditional counting batting stats: Gallardo: 72 PA, 8 1B, 4 2B, 0 3B, 4 HR, 10 RBI, 5 uBB, 0 IBB, 2 HBP, 2 SH, 0 SF, 17 SO, 0 GIDP Haren: 57 PA, 13 1B, 6 2B, 0 3B, 1 HR, 7 RBI, 1 uBB, 0 IBB, 0 HBP, 1 SH, 0 SF, 9 SO, 0 GIDP Gallardo had the most homers by a pitcher in MLB in 2010, and nobody else even had more than 1. Haren had the most doubles, but Gallardo was tied for 3rd. Given the smallness of their counting stats, I won't dive into how they compare above/below their first quartiles for the different stats. Both Gallardo and Haren had an Rbat of 3. Haren actually led with a wRAA of 3.3, with Gallardo in 2nd at 2.5. The worst offensive pitcher in the NL was Clayton Kershaw of the Los Angeles Dodgers, with a Batting Value of -7.32. Kershaw was the 6th best NL pitcher at pitching in 2010, but his poor batting actually puts him behind Gallardo in terms of overall value. Even in small quantities, every additional hit/walk/etc that a team can get is valuable. Kershaw had an Rbat of -13 and a wRAA of -15.4, also the worst in the NL. AL Designated Hitter Actual Winner: Vladimir Guerrero, Texas Rangers AL Designated Hitter Player Value Winner: Jim Thome, Minnesota Twins
This one hurt to see. Vladimir Guerrero is my favorite player and the reason my favorite number is 27. And on the surface he had a great penultimate season in his lone year with the Rangers, hitting 29 homers and batting .300. He won his 9th Silver Slugger and appeared in his 8th All-Star game, and finished 11th in MVP voting. But his Batting Value was just -3.40. Thome had a notably superior Batting Value of 20.04. As was the case for all seasons prior to 2022, there was no DH in the NL in 2010. Here are their AVG, OBP, SLG, OPS, wOBA, and Batting Value Average first quartile comparisons: Vlad: .300 vs .270, .345 vs .353, .496 vs .438, .841 vs .816, .363 vs .356, -.0719 vs -.0736 Thome: .283 vs .271, .412 va .355, .627 vs .438, 1.039 vs .820, .439 vs .358, -.0070 vs -.0719 We can see that where Vlad gains over Thome in batting average, he quickly gets outgained in terms of on-base percentage. My man liked to hit and would swing at anything thrown his way. Walking wasn't his forte, and neither was mine. Here are their traditional counting batting stats: Vlad: 643 PA, 121 1B, 27 2B, 1 3B, 29 HR, 115 RBI, 30 uBB, 5 IBB, 9 HBP, 0 SH, 6 SF, 60 SO, 19 GIDP Thome: 340 PA, 35 1B, 16 2B, 2 3B, 25 HR, 59 RBI, 56 uBB, 4 IBB, 2 HBP, 0 SH, 2 SF, 82 SO, 8 GIDP Here are their comparisons relative to their first quartiles: Vlad: +39.18 1B, -1.78 2B, -.16 3B, +9.5 HR, -25.59 uBB, -52.21 SO, +1.99 IBB, +6.93 HBP, +0 SH, +2.37 SF, +9.7 GIDP, +99.53 other Outs Thome: -7.71 1B, +.8 2B, +1.47 3B, +14.6 HR, +25.83 uBB, +21.86 SO, +2.34 IBB, +.88 HBP, +0 SH, +0 SF, +3.2 GIDP, -15.99 other Outs Like was the problem with Ichiro, Vlad didn't walk enough. He did have some power, but he also grounded into too many double plays. He also had a decent knack for getting plunked, something I can relate to in my high school playing days as well. Thome had an Rbat of 32 and a wRAA of 32, the highest among DHs. Vlad had an Rbat of 14 and a wRAA of 21.9, the 4th best among DHs. So the assertion that Thome was better than Vlad and was the best hitting DH isn't unique. The worst offensive designated hitter in the AL was Adam Lind of the Toronto Blue Jays, with a Batting Value of -23.64. He had an Rbat of -12 and a wRAA of -5.6, the 6th worst among DHs. Ken Griffey Jr. of the Seattle Mariners had the worst wRAA among DHs at -9.2, and I had his Batting Value at -12.86, the 5th worst. SILVER SLUGGER SUMMARY Now that we've gone through each position and each league, here's a quick summary of the players that should have won the Silver Slugger at each position, based on Batting Value: AL C - Joe Mauer (actual winner), Twins 1B - Miguel Cabrera (actual winner), Tigers 2B - Robinson Cano (actual winner), Yankees 3B - Adrian Beltre (actual winner), Red Sox SS - Alexei Ramirez (actual winner), White Sox OF - Josh Hamilton (actual winner), Rangers OF - Carl Crawford (actual winner), Rays OF - Jose Bautista (actual winner), Blue Jays DH - Jim Thome, Twins NL C - Geovany Soto, Cubs 1B - Joey Votto, Reds 2B - Dan Uggla (actual winner), Marlins 3B - Ryan Zimmerman (actual winner), Nationals SS - Troy Tulowitzki (actual winner), Rockies OF - Carlos Gonzalez (actual winner), Rockies OF - Matt Holliday (actual winner), Cardinals OF - Colby Rasmus, Cardinals P - Yovanni Gallardo (actual winner), Brewers The AL got 8 of their 9 right, and the NL got 6 of their 9 right. We were much better at giving the Silver Sluggers out correctly than we were the Gold Gloves! HANK AARON AWARD The Hank Aaron award is given to the best overall offensive player in the AL and the NL. It is decided between a mix of a fan vote and a panel of Hall of Famers, and was first created in 1999. You can view past winners here. Below are the winners in 2010 compared to which players should have won based on their Batting Value: NL Actual Winner: Joey Votto, Cincinnati Reds, First Base NL Player Value Winner: Joey Votto, Cincinnati Reds, First Base Somehow we correctly identified Votto as the best offensive player in the entire National League but failed to realize that he was the best offensive first baseman in the NL. Granted that the Silver Slugger and Hank Aaron Award don't have the same built-in layering that the Gold Glove and Platinum Glove do, but this result was still odd. AL Actual Winner: Jose Bautista, Toronto Blue Jays, Right Field AL Player Value Winner: Josh Hamilton, Texas Rangers, Left Field Hamilton would be voted the MVP in 2010, and it certainly wasn't for his fielding prowess, so it's odd that Bautista was declared the superior hitter. Sharing of the spoils, I suppose. BATTING VALUE BY POSITION Like I did for the Fielding Value post, I'll now show that Batting Value isn't particularly biased or skewed towards certain positions. Any guy at any position that leads his position in batting can be among the league leaders. A shortstop that gives you +10 home runs over the positional first quartile is just as valuable as a first baseman that does the same thing, even if the first baseman hit 40 homers and the shortstop only hit 20. Here are the boxplots of Batting Value by position:  Most positions have pretty similar spreads, with perhaps the exception of catchers. This is likely because they tend to get fewer plate appearances, as the first quartile values by position from earlier showed. Okay, those are the visuals. But what are the actual values? Here are some summary statistics of Batting Value by position:  Note that the pitcher values are the values of all pitchers, starters and relievers, in both leagues. In reality, I divide pitchers into 4 groups: AL SP, AL RP, NL SP, and NL RP. The values above are also among all players, not just starters. Thought would have it that since a team's Batting Value correlates well with its runs scored per game, then the teams that have players with the most Batting Value should be the ones that scored the most runs. These also may be the teams that win the most, since run differential per game correlates well with winning percentage (wins per game). Here are the boxplots of Batting Value by team in 2010:  Looks like the Reds had a higher median than most teams, and we know they were good in 2010. The Mariners appear to have a lower median than most teams, and they were bad in 2010. And here are summary statistics of Batting Value by team in 2010:  Sure enough, the Reds had the highest median Batting Value and went 91-71 and won their division, while the Mariners had the lowest median Batting Value and went 61-101 and came last in their division. Pirates, Orioles, Nationals, and Diamondbacks all had lower median Batting Values and all came last in their divisions. But this isn't perfect, as the Padres had a low median too and won their division. Yankees, Phillies, Braves, and Giants join the Reds as teams with higher medians and good records. The Rockies, however, had a higher median but were barely above .500. Let's cap it off by viewing the runs scored by team in 2010:  You'll notice a strong correlation between a team's median Batting Value and its runs scored. Reds, Phillies, Yankees, Rays all towards the top, and Mariners, Pirates, Orioles, Astros, and Nationals all towards the bottom.
So, in conclusion, why use Batting Value and thus Player Value?
Thank you all for reading and let me know your thoughts on the comments below. Also be sure to sign up for my newsletter using the link below to get updates for each post. We've done Fielding Value and Batting Value for 2010, so the last step in the 2010 example rollout of Player Value is Pitching Value and total Player Value. In the next post I plan to go over which players should have won the MVP, Cy Young, Reliever of the Year, and Rookie of the Year in each league. I'll also list out some 1st team and 2nd team honors. Statting Lineup Newsletter Signup Form: If you'd like to receive email updates for each new post that I make, sign up for the Statting Lineup newsletter using the link below: https://weebly.us18.list-manage.com/subscribe?u=ab653f474b2ced9091eb248b1&id=3a60f3b85f An Application of My New Player Value Metric on the 2010 MLB Season: Fielding Value and Gold Gloves9/5/2022 I have recently unveiled my new metric for assessing player value, which you can read about here. I also made some quick changes to the metric, which you can read about in the addendum here. The goal of this metric is to act like WAR, but be more understandable and transparent. For the time being I'm resorting to just calling it 'Player Value', but am open to name change recommendations. As a quick summary of the metric, each player gets credited and docked for the run-value of each event they achieve, from hitting a home run to striking out. These values are applied on a 'per opportunity' basis, such as per plate appearance or per inning. These are then compared to a player's positional first quartile value. If you hit fewer HR per PA than your position's first quartile, that means you are in the bottom 25% of home run hitters at your position, for example. We multiply the differences by a player's total # of opportunities to credit players that are able to stay healthy and play more. In this post I will apply the Fielding Value portion of my Player Value metric to players in the 2010 season to determine who should have won the Gold Glove at each position in each league. I'll also decide who should have won the Platinum Glove based on Fielding Value, if the award had existed back then. Then I'll look at how Fielding Value varies by position to show that it is not biased towards or against any particular position. Any player that is an elite defender at their position has the chance to add the same amount of value. This is because of the inherent defensive expectations of each position. I don't reward 'more difficult' positions to play like catcher, shortstop, or center field because it is expected that guys that play those positions are good at defense. Each additional out a player makes is basically worth the same, regardless of your position. Your shortstop is likely a better defender than your third baseman, yes. But if you have the best defensive third baseman, that's tremendously valuable; you're getting extra outs from that position that other teams aren't. If your shortstop is pretty average compared to ones on other teams, that's not as valuable. We could move the shortstop to third and he would fare better defensively, but likely will fare worse offensively. A player can either uphold the standards of his position or not. I will end by looking at each team's aggregate Fielding Value to show that it does a good job of explaining the runs that a team allows. Here's a look at the defensive expectations (first quartile values) by position in 2010:  Catchers and first basemen clearly have higher fielding percentages, make more putouts, and have higher ranges (make more outs per game). Third basemen and shortstops make more assists and more errors. Outfielders get far less defensive chances. It is because of these positional differences that we must compare on a position basis. Even applying the run value of the events leaves things skewed, as we can see in the 'FieldVA' column above that different positions have very different Field Value Average expectations. I chose this season because as a kid from Cincinnati, 2010 was the first good season in my Reds fandom. We made the playoffs for the first time in my life (first berth since 1995) and Joey Votto won the MVP. I thought it would be cool to see if Votto's MVP was merited and if my Player Value metric can explain the success of the Reds (and other teams) that season. Three Reds players won Gold Gloves in 2010 as well. I am eventually going to step through the different awards and look at who actually won them in 2010 compared to who should have won them, according to Player Value. Again in this post I'll just examine the Gold Gloves and Platinum Gloves, but in later posts I'll look at Silver Sluggers, Rookies of the Year, MVPs, Hank Aarons, Relievers of the Year, and Cy Youngs. I can't do hypothetical All-Stars since I don't have the data for specifically the first half of the season only, but I will also determine some First Team and Second Team honors in later posts. Here's a quick reminder of the run value weights for the relevant defensive events: Putout by a non catcher or first baseman: .33 runs Unassisted Putout by a first baseman: .33 runs Non-strikeout Putout by a catcher: .33 runs Assisted Putout by a first baseman: .2*.33 = .066 runs Strikeout Putout by a catcher: .33*.33 = .1089 runs Assist: .8*.33 = .264 runs Error: -.68 runs Double Play: .10 runs Passed Ball: -.26 runs Stolen Base allowed by catcher: -.15 runs Caught Stealing by catcher: .39 runs Note that I don't claim ultimate precision for my run value weights, so these have been rounded to 2 decimal places from the values shown in the Player Value explanation posts. GOLD GLOVES View the 2010 AL Gold Glove winners here. View the 2010 NL Gold Glove winners here. Read how the Gold Gloves are decided and the requirements here. The awards are given out based on a combo of MLB coaches voting and the SABR Defensive Index, which itself is a mix of several different defensive measures. Catchers NL Catcher Actual Winner: Yadier Molina, St. Louis Cardinals NL Catcher Player Value Winner: Miguel Olivo, Colorado Rockies
Olivo led all catchers in MLB in 2010 with a Fielding Value of 20.06. Molina finished 4th overall in MLB, and was the 3rd highest in the NL, with a Fielding Value of 16.02. Olivo had a Fielding Value Average of .3817, while Molina had a Fielding Value Average of .3913. The first quartile value for catchers is .2600. The disparity here is because the rate version of Fielding Value does not take the catcher and first base adjustments into consideration, nor does it account for comparing to a player's positional first quartile. Olivo played all 111 of his games at catcher, so he was 100% a catcher. Molina played 135 games at catcher and 7 at first base, so he was only a 95.07% catcher. Thus their positional first quartile values were slightly different, since I weight each player's quartiles based on their proportion of time played at each position. Olivo played 935 innings and Yadier played 1,145 innings. In the eyes of fielding percentage, it makes sense why Molina won. Yadi had a .9950 fielding percentage, above his positional first quartile of .9911. Olivo had a .9900 fielding percentage, actually below his positional first quartile of .9910. It is in terms of range factor that Olivo comes out on top. His range factor per game (RFG) of 7.95 and range factor per 9 innings (RF9) of 8.50 are both well above the catcher first quartile of 6.66 (sorry, folks) and 7.35. Molina's values are 6.91 vs 6.75 and 7.71 vs 7.43. So on a rate basis Molina made fewer errors than Olivo, but Olivo was making more outs than Molina. As for throwing runners out, the catcher first quartile was a 22.77% caught stealing rate. Olivo was well above this at 42.31%, but Molina was even better at 48.53%. However, Olivo was confronted with having to throw runners out more frequently; runners tried to steal on him 78 times, but on Yadi just 68 times. The rate basis matters, but so too does how often you threw guys out at that rate. Throwing out 90% of 1,000 runners is better than throwing out 95% of 100 runners. Those are the more traditional catcher fielding metrics; how about the metrics that Fielding Value actually considers? Olivo made .878 putouts per inning, .066 assists per inning, .01 errors per inning, .01 double plays per inning, allowed .011 passed balls per inning, and had .083 runners attempt to steal on him per inning. Molina's values are .788 PO/Inn, .069 A/Inn, .004 E/Inn, .007 DP/Inn, .011 PB/Inn, and .059 CSopps/Inn. So sure, Molina on a rate basis was throwing more guys out and making fewer errors. But on a per opportunity basis, Olivo was making more outs and having to try to throw more guys out, which he still did at a high rate. Recall that we adjust catchers putouts that are via strikeouts. We assume this is the case for 93% of their putouts, and we give them credit for .33 of the value for these strikeout putouts. The non-strikeout putouts (the other 7%) get the full regular value of a putout. The final values come out that Olivo threw out 15.24 more runners than his positional first quartile, allowed 6.43 fewer runners to steal on him, allowed 6.36 more passed balls, made 5.01 more double plays, recorded 4.59 more errors, had 19.25 more assists, had 92.31 more strikeout putouts, and had 6.95 more non-strikeout putouts. Molina threw out 18.28 more runners, allowed 7.63 less steals, allowed 2.77 more passed balls, made 2.67 more double plays, recorded .31 fewer errors, had 25.73 more assists, had 8.63 more strikeout putouts, .65 more non-strikeout putouts, and .43 more assisted putouts and .05 more unassisted putouts for his time at first base. As an example calculation for Olivo, that would be: 15.24*.39 - 6.43*-.15 + 6.36*-.26 + 5.01*.10 + 4.59*-.68 + 19.25*.8*.33 + 92.31*.33*.33 + 6.95*.33 = 20.07. This is slightly off due to rounding. Nick Hundley had the most putouts above the catcher first quartile in the NL, but Olivo was still near the top while Yadi was near the middle. Yadi did have the most assists, but Olivo was also towards the top. Yadi also had the most caught stealings, but Olivo was 2nd. Olivo was towards the top for double plays, Yadi wasn't. Yadi was on the lower end of errors, while Olivo was on the higher end. In considering all of these with their run value weights, it's Miguel Olivo that comes out on top. Baseball Reference WAR had Molina at an Rfield of 20 in 2010, with Olivo at 11. FanGraphs had Molina with 26 Defensive Runs Saved (DRS) and 26.4 framing runs. Molina had the highest DRS among NL catchers in 2010. They had Olivo at 10 DRS and -3.4 framing runs. So those metrics tend to prefer Molina as the Gold Glove system did. I'll again highlight that Molina was not graded poorly by Fielding Value; he was the 3rd best defensive catcher in the NL. Shoutout to Jonathan Lucroy of the Milwaukee Brewers, who finished 2nd in the NL with a Fielding Value of 18.24. The advanced metrics liked him more; just 4 Rfield, but 22 DRS and 28.3 framing (highest in NL in 2010). The worst defensive catcher in the NL was Ryan Doumit of the Pittsburgh Pirates, who had a Fielding Value of -18.25. The advanced metrics give him an Rfield of -11, -15 DRS (worst in NL), and -20.6 framing (worst in NL). Overall compared to the other advanced defensive metrics, I believe my Fielding Value has tracked well. AL Catcher Actual Winner: Joe Mauer, Minnesota Twins AL Catcher Player Value Winner: Jose Molina, Toronto Blue Jays
So Yadi doesn't get his Gold Glove, but his brother Jose does. Jose Molina led all AL catchers and was 3rd in MLB overall with a Fielding Value of 16.24, just above his brother Yadier. Their brother Bengie also fared pretty well, with a Fielding Value of 9.56. The Molinas could field! Joe Mauer, on the other hand, had a Fielding Value of just -6.30, one of the worst in the AL and MLB overall. Molina's Fielding Value Average was .4199, and Mauer's was just .2427. The first quartile value for catchers is .2600. I'll note that Jose Molina technically wouldn't qualify for the Gold Glove under its minimum playing requirements, as he only played in 56 games. However, the Fielding Value metric does take innings played into consideration; Molina was so defensively great during those 56 games that he was more than able to make up for the 100+ games that he didn't appear in. If we want to be super technical and live and die by the Gold Glove's requirements, then the highest qualifying AL catcher would be Gerald Laird of the Detroit Tigers, who had a Fielding Value of 7.65. Qualifications aside, Bengie Molina would be the 2nd highest AL catcher; he split that season with the Giants and the Rangers, so his 57 games in the AL also wouldn't have been enough. Jose appeared in 56 games at catcher and 1 game as the DH, so he was 98% a catcher. Mauer played in 112 games at catcher and 23 games at DH, so he was 83% a catcher. Note that since DHs don't field, they won't alter the fielding side of our positional first quartiles. Solely defensively speaking, both Jose and Joe were 100% catchers. Jose played about 445 innings, and Mauer played about 952 innings. Both Joe Mauer and Jose Molina had a .996 fielding percentage compared to the positional first quartile of .991. Jose had an RFG of 8.11 and an RF9 of 9.19. Joe's values were 6.52 and 6.90, both below the first quartile values of 6.66 (sorry again, folks) and 7.35. Joe threw out 26.39% of runners, compared to the first quartile mark of 22.77%, but Jose was much better at 44.12%. Given the disparity in innings played, we'll focus on their per inning values. Molina had .938 PO/Inn, .083 A/Inn, .004 E/Inn, .007 DP/Inn, .011 PB/Inn, and .076 CSopps/Inn. Mauer had .731 PO/Inn, .036 A/Inn, .003 E/Inn, .003 DP/Inn, .004 PB/Inn, and also .076 CSopps/Inn. So Mauer is making fewer errors and allowing less passed balls, which certainly are good things, but these don't make up for the superior ability of Molina to make outs overall. Overall compared to the level of a first quartile catcher, Molina gave you 16.67 more assists, .1 less errors, 1.1 more double plays, 3.27 more passed balls, 3.42 fewer stolen bases, 7.26 more caught stealings, 68.59 more strikeout putouts, and 5.16 more non-strikeout putouts. Mauer gave you 6.51 fewer assists, 1.49 less errors, 1.06 less double plays, .3 more passed balls, 5.52 more stolen bases, 2.6 more caught stealings, 35.91 less strikeout putouts, and 2.7 less non-strikeout putouts. Jose Molina had an Rfield of 4, a DRS of 11, and 22.8 framing, the highest in the AL in 2010. Joe Mauer had an Rfield of 3, a DRS of 3, and 5.5 framing. These advanced metrics agree with me that Molina was the better fielder than Mauer. The AL catcher with the highest DRS was Matt Wieters of the Orioles, with 15. My metric didn't like Wieters as much, giving him -1.46 Fielding Value. The worst defensive catcher in the AL was Jorge Posada of the New York Yankees, with a Fielding Value of -7.63. Posada had an Rfield of -14. His DRS of -30 and framing of -23.3 were worst in the AL and MLB overall. First Basemen NL First Base Actual Winner: Albert Pujols, St.Louis Cardinals NL First Base Player Value Winner: Albert Pujols, St.Louis Cardinals  Not much to debate here, we got this one right! Albert had a Fielding Value of 39.50, the highest among first basemen in the NL and MLB, and the highest of any player at any position in 2010. This sounds uncharacteristic of Pujols, but he truly was a great fielder this season. He had a Fielding Value Average of .3946, compared the first basemen quartile of .3393. Pujols' closest competitor was Aubrey Huff of the San Francisco Giants, who had a Fielding Value of 19.92, the 3rd highest among MLB first basemen. But since the actual award winner aligns with who Fielding Value prefers, I won't drag this out and compare Pujols to Huff at length. I will note that Huff only played first 56% of the time, spending 26% of his time in left field and 19% of his time in right field. Albert played about 1,381 innings in 157 games all at first base, making him 100% a first basemen. His .998 fielding percentage was above the first quartile of .9923. His RFG of 10.29 and RF9 of 10.53 were above the first quartiles of 8.56 and 9.11. His efforts led to 168.3 more assisted putouts, 18.7 more unassisted putouts, 71.52 more assists, .27 less errors, and 31.51 more double plays than the first quartile first basemen. Pujols had an Rfield of 8, a DRS of 6, and an Ultimate Zone Rating (UZR) of 1.8. Those last two values ranked 8th and 16th in MLB. Ike Davis of the New York Mets had the highest DRS in the NL at 13, and the highest UZR in the NL at 10.4. His Fielding Value is 13.49, good for 3rd best in the NL. The worst defensive first baseman in the NL was Gaby Sanchez of the Florida Marlins, with a Fielding Value of -11.12. Sanchez had an Rfield of -10, a DRS of -10, and an UZR of 0.7. His DRS was 6th worst in the NL and MLB. Prince Fielder of the Milwaukee Brewers had the worst DRS in the NL and MLB, with -17. He was the 2nd worst in the NL and 3rd worst in MLB with a Fielding Value of -4.64. Ryan Howard of the Philadelphia Phillies had the worst UZR in the NL at -12.4, with a mediocre Fielding Value of 2.50. AL First Base Actual Winner: Mark Teixeira, New York Yankees AL First Base Player Value Winner: Michael Cuddyer, Minnesota Twins
Cuddyer was 2nd best among MLB first basemen overall and the highest in the AL with a Fielding Value of 21.89. Teixeira was somewhat middle of the pack with a Fielding Value of 7.18, about 8th best in the AL. Cuddyer had a Fielding Value Average of .2287 (compared to his quartile of .2083) and Teixeira had a Fielding Value Average of .3429, compared to the first base quartile of .3393. It can be argued that Cuddyer shouldn't be crowned because he only played 50.3% of his 167 game appearances at first base, or even that his values are somewhat skewed by his fielding diversity, as he played in right field about 40% of the time and at third base another 8% of the time. If that's your stance, then feel free to consider Lyle Overbay of the Toronto Blue Jays as your true 'should have' first base winner. He had a Fielding Value of 16.53 for the 4th most in MLB and was 100% a first basemen. Teixeira was a first baseman 94% of the time and a DH the other 6%, so that won't effect his fielding results any. Cuddyer had a .994 fielding percentage compared to his quartile of .9853. Teixeira had a .998 fielding percentage compared to his quartile of .9923. Cuddyer's RFG is 5.70 vs 5.28 and his RF9 is 6.18 vs 5.65, while Teixeira's RFG is 8.77 vs 8.56 and his RF9 is 9.11 vs 9.11. Cuddyer played 4,160 innings in the field, while Teixeira 3,875. Since both players have pretty different first quartile comparisons, I won't dive into their per inning values. In aggregate compared to their first quartiles, Cuddyer got you 54.47 more putouts while he wasn't a first baseman, 49.62 more assisted putouts as a first baseman, 5.51 more unassisted putouts as a first baseman, 3.68 less assists, 1.76 more errors, and 9.95 more double plays. Teixeira got you 34.14 more assisted putouts, 3.79 more unassisted putouts, .03 more assists, 1 less error, and 29.89 more double plays. Teixeira had an Rfield of 6, a DRS of 6 (4th highest in AL), and an UZR of -1.6. Cuddyer had an Rfield of -20, a DRS of -8, and an UZR of -6.7. So these metrics disagree pretty strongly with Fielding Value on Cuddyer; in fact, his DRS and UZR were worst in the AL among first basemen. Daric Barton of the Oakland Athletics had the highest DRS in the AL at 19, and the highest UZR in the AL at 11.8. Fielding Value liked Barton pretty well, scoring him at 12.13 for the 4th highest in the AL. The worst defensive first baseman in the AL was Mike Napoli of the Los Angeles Angels of Anaheim, with a Fielding Value of -6.96. His Rfield was -6, his DRS was 0, and his UZR was 0.7. Paul Konerko of the Chicago White Sox had the worst DRS in the AL at -12, and the worst UZR in the AL and MLB at -14. I actually had Konerko faring pretty well with a Fielding Value of 9.72. Second Basemen NL Second Base Actual Winner: Brandon Phillips, Cincinnati Reds NL Second Base Player Value Winner: Clint Barmes, Colorado Rockies
As a Reds fan it hurt to see BP not come out on top, but he still did pretty well. Barmes led the NL and was 3rd in MLB with a Fielding Value of 20.67. Phillips was 4th in the NL with a Fielding Value of 15.91. Clint had a Fielding Value Average of .1854 against his quartile of .1616, while BP had a Fielding Value Average of .1819 against the second base quartile of .1700. Clint spent about 65% of his time at second and about 35% of his time at shortstop. BP was 100% a second basemen. Clint played about 995 innings, and BP played 1,311 innings. Clint's fielding percentage comparisons are .982 vs .9751, while BP's are .996 vs .9803. Clint's RFG and RF9 comparison are 4.06 vs 4.13 and 4.99 vs 4.47, whereas Brandon's are 4.61 vs 4.29 and 4.81 vs 4.66. The traditional stats clearly favor Brandon, so it's no shocker that he won. After comparing their per inning values to their quartile's per inning values and then multiplying by their innings played, we see that Barmes would have gotten you 23.76 more putouts, 45.59 more assists, 3.10 more errors, and 28.96 more double plays. Phillips would have gotten you 7.36 more putouts, 38.69 more assists, 3.4 less errors, and 9.56 more double plays. Phillips gets you less errors, but Barmes gets you more outs. Barmes basically only appeared worse on a rate basis because of the time he spent playing shortstop. Barmes had an Rfield of 13, but FanGraphs calculates their metrics differently for guys at each position. As a second baseman, he had a DRS of 3 and an UZR of -.9, which are pretty unimpressive. But as a shortstop, he had a DRS of 8 and an UZR of 4.5. Phillips had an Rfield of 10, a DRS of 11, and an UZR of 8.2. So Fielding Value and Rfield at least agree on these players. Chase Utley had the highest DRS in the NL at 17 and the highest UZR in the NL and MLB at 10.4. Utley's Fielding Value was 18.27, good for 3rd best in the NL. The worst defensive second baseman in the NL was Adam Kennedy of the Washington Nationals, with a Fielding Value of -14.01. His Rfield was 0, his DRS was -1 and his UZR was 2. Skip Schumaker had the worst DRS in the NL at -16 and the UZR in the NL at -14.4. Fielding Value disagrees very strongly, scoring him at 20.36 for the 2nd best in the NL and 3rd best in MLB. Schumaker's fielding percentage is below the first quartile, but his range factors are well above the first quartiles. AL Second Base Actual Winner: Robinson Cano, New York Yankees AL Second Base Player Value Winner: Robinson Cano, New York Yankees  Hey, our second case of complete agreement! Cano led the AL and all of MLB second basemen with a Fielding Value of 28.81. This was good for the 5th highest across all positions in both leagues. His Fielding Value Average was .1898, compared to the second base first quartile of .1700. Cano appeared in 158 games at second and in 2 games as a DH, making him about 99% a second baseman and just 1% a DH. He played in about 1,393 innings. He boasted a .996 fielding percentage compared to the first quartile of .9803, with a 4.89 vs 4.29 RFG comparison and a 4.99 vs 4.66 RF9 comparison. In total Cano got you 50.18 more putouts, 27.81 more assists, 3.8 less errors, and 23.19 more double plays. It is no surprise that he won the Gold Glove. Cano had an Rfield of 16, a DRS of 18 (highest in the AL and MLB), and a UZR of -.5. The highest UZR in the AL was Orlando Hudson of the Minnesota Twins at 8.7. Hudson's Fielding Value was 26.63, the 2nd highest in the AL and MLB. The worse defensive second baseman in the AL was Chone Figgins of the Seattle Mariners, with a Fielding Value of -12.85. He had an Rfield of -10, a DRS of -7, and an UZR of -11.1 (worst in the AL). The worst DRS in the AL was Mike Aviles of the Kansas City Royals at -8, who actually had a decent Fielding Value of 10.2 Third Basemen NL Third Base Actual Winner: Scott Rolen, Cincinnati Reds NL Third Base Player Value Winner: Placido Polanco, Philladelphi Phillies
Alas it appears that I've done another Reds player dirty. Polanco led the NL and MLB with a Fielding Value of 22.02. Rolen still fared well and finished 2nd in the NL with a Fielding Value of 16.67. Polanco's Fielding Value Average was .1139 vs a first quartile of .0916 and Rolen's was .1026 vs .0839. Rolen was 100% a third baseman, while Polanco played third about 91% of the time and second the other 9% of the time. Polanco played 1,157 innings and Rolen played 1,074 innings. Polanco had a fielding percentage of .988 compared to his first quartile of .9545, a RFG of 2.95 vs 2.50, and an RF9 of 3.1 vs 2.68. Rolen had comparisons of .977 vs .952 for fielding percentage, 2.63 vs 2.33 for RFG, and 2.87 vs 2.48 for RF9. Compared to their first quartiles, Polanco would have gotten you 12.52 more putouts, 50.27 more assists, 4.98 less errors, and 12.28 more double plays. Rolen would have gotten you 12.72 more putouts, 40.13 more assists, 1.65 less errors, and 7.61 more double plays. Polanco had an Rfield of 11, a DRS of 7, and an UZR of 11.4 (third highest in NL). Rolen had an Rfield of 10, a DRS of 10, and an UZR of 10 (fourth highest in NL). Chase Headley had the highest DRS in the NL at 16, and the highest UZR in the NL at 16.5. Fielding Value doesn't think much of him, rating him at -2.53. The worst defensive third baseman in the NL was Jorge Cantu of the Florida Marlins (primarily, for 97 games) and the Texas Rangers (for 30 games), with a Fielding Value of -29.49. Cantu also was actually the worst fielder across all positions and both leagues in 2010. He had an Rfield of -13 with the Marlins and -2 with the Rangers. He had a DRS of -13 and an UZR of -9.2, both third worst in the NL. Aramis Ramirez of the Chicago Cubs had the worst DRS in the NL at -15, and had the third worst Fielding Value in the NL at -12.76. David Wright of the New York Mets had the worst UZR in the NL at -11, but was favorably seen by Fielding Value with a rating of 13.11, the third best in the NL. If we want to be strict and only focus on players that played entirely in the NL in 2010, then Chris Johnson of the Houston Astros was the worst with a Fielding Value of -17.67. AL Third Base Actual Winner: Evan Longoria, Tamba Bay Rays AL Third Base Player Value Winner: Jose Lopez, Seattle Mariners
Lopez led the AL and was 2nd in MLB with a Fielding Value of 21.81. Longoria was still viewed favorably, finishing 5th in the AL with a Fielding Value of 15.13. Lopez had a Fielding Value Average of .1056 and Longoria had a Fielding Value Average of .0962. Both guys were 100% third basemen, where the first quartile Fielding Value Average was .0839. Lopez played about 1,253 innings and Longoria played about 1,331 innings. Lopez's fielding percentage was .960 and Longoria's was .966, both compared to the third base first quartile of .952. Lopez's RFG and RF9 were 3.02 and 3.08 while Longoria's were 2.67 and 2.73, with the first quartile values being 2.33 and 2.48. Lopez would have gotten you 25.03 more putouts, 66.72 more assists, 6.75 more errors, and 5.22 more double plays. Longoria would have gotten you 39.92 more putouts, 4.83 more assists, 2.05 more erros, and 20.74 more double plays. Lopez had an Rfield of 10, a DRS of 11 (4th best in AL) and an UZR of 8.7 (also 4th best in AL). Longoria had an Rfield of 20, a DRS of 17 (2nd best in the AL and MLB), and an UZR of 12.1 (2nd best in the AL and 4th best in MLB). The highest DRS in the AL was Adrian Beltre of the Boston Red Sox with 20, who had a Fielding Value of 15.38 (4th best in AL). The highest UZR in the AL was Kevin Kouzmanoff of the Oakland Athletics with 15.3, who had a Fielding Value of 10.16. The worst defensive third baseman in the AL was Wilson Betemit of the Kansas City Royals, with a Fielding Value of -11.95. I'll note again that Jorge Cantu was worse and spent part of the season in the AL with the Rangers, but most of the year he was in the NL with the Marlins. Betemit had an Rfield of -15, a DRS of -13 (worst in the AL, 5th worst in MLB), and an UZR of -10.1 (worst in the AL, 2nd worst in MLB). Shortstops NL Shortstop Actual Winner: Troy Tulowitzki, Colorado Rockies NL Shortstop Player Value Winner: Troy Tulowitzki, Colorado Rockies  Another point of total agreement! Tulo led the NL and all of MLB at SS with a Fielding Value of 35.48. This was good for the 2nd most across all positions and both leagues, behind only Pujols. His Fielding Value Average was .1889 compared to the positional first quartile of .1475. Tulowitzki played in 1,065 innings and was 100% a shortstop in his 122 games. He had a .984 fielding percentage vs the shortstop first quartile of .9658, a RFG of 4.91 vs 3.86, and an RF9 of 5.06 vs 4.16. Tulo would have given you 42.83 more putouts, 62.70 more assists, 1.43 less errors, and 38.23 more double plays. Tulowitzki had an Rfield of 19, a DRS of 16 (2nd/3rd highest in NL), and an UZR of 6.6 (4th highest in NL). The highest DRS in MLB was Alex Gonzalez, who split time that season between the Toronto Blue Jays (AL, 85 games) and the Atlanta Braves (NL, 72 games). Gonzalez had a DRS of 26, and Fielding Value rates him at 11.31. The highest DRS by a solely NL player was Brendan Ryan of the St. Louis Cardinals at 24, who had a Fielding Value of 28.89 (2nd highest in the NL, 3rd highest in MLB). Ryan also had the highest UZR in the NL and MLB at 13.3. The worst defensive shortstop in the NL was Edgar Renteria of the San Francisco Giants, with a Fielding Value of -7.02. This was 5th worst in MLB at short overall. His Rfield was -2, his DRS was -2, and his UZR was 1.8. Hanley Ramirez of the Florida Marlins had the worst DRS in the NL at -17 and the worst UZR in the NL at -9.5. His Fielding Value was -6.86, 2nd worst in the NL. AL Shortstop Actual Winner: Derek Jeter, New York Yankees AL Shortstop Player Value Winner: Alexei Ramirez, Chicago White Sox
Ah, the classic 'Jeter was an overrated fielder' discussion' Maybe at least one of his 5 career Gold Gloves will be deserving, but that's not the case for this year. Ramirez led the AL and was 2nd in MLB at SS with a Fielding Value of 30.13. Jeter had a Fielding Value of -9.73, 3rd worst in the AL and MLB! Both these guys were 100% shortstops, where the first quartile Fielding Value Average was .1475. Ramirez had a Fielding Value Average of .1773, and Jeter's was .1425. Ramirez had the 3rd highest Fielding Value across all positions and leagues, behind Pujols and Tulowitzki. Jeter played about 1,304 innings and Ramirez played about 1,377. The shortstop first quartile fielding percentage was .9658, Jeter's was .989, and Ramirez's was .974. But in terms of RFG and RF9, the first quartile values were 3.86 and 4.16, Ramirez had values of 4.79 and 4.89, and Jeter had values of 3.62 and 3.78. Ramirez would have gotten you 31.61 more putouts, 78.51 more assists, 5.22 more errors, and 25.28 more double plays. Jeter would have gotten you 23.86 less putouts, 33.2 less assists, 7.99 less errors, and 14.72 more double plays. Jeter was great at making the routine plays (avoiding errors) but not so much at making plays (having good range). Ramirez had an Rfield of 20, a DRS of 20 (highest in the AL, 3rd most in MLB), and an UZR of 10.5 (highest in AL, 2nd most in MLB). Jeter had an Rfield of -9, a DRS of -5, and an UZR of -4.4. The aforementioned Alex Gonzalez would have been the closest in terms of DRS and UZR. Cliff Pennington of the Oakland Athletics had the next highest Fielding Value in the AL at 24.28. The worst defensive shortstop in the AL was Marco Scutaro of the Boston Red Sox, with a Fielding Value of -21.54. His Rfield was 0, his DRS was -2, and his UZR was -4. Yuniesky Betancourt had the worst DRS and UZR in the AL and in MLB at -23 and -11.5, respectively. Fielding Value disagrees very strongly, rating him at 15.84, the 3rd or 4th most in the AL depending on how you view Gonzalez. Just looking at his baseline stats of fielding percentage, RFG, and RF9, and comparing them to the first quartile, Betancourt is well above the quartile in each, so I'm inclined to believe Fielding Value has him right. Outfielders NL Outfield Actual Winner #1: Michael Bourn, Houston Astros NL Outfield Actual Winner #2: Carlos Gonzalez, Colorado Rockies NL Outfield Actual Winner #3: Shane Victorino, Philadelphia Phillies NL Outfield Player Value Winner #1: Jay Bruce, Cincinnati Reds (Best RF) NL Outfield Player Value Winner #2: Angel Pagan, New York Mets (Best CF) NL Outfield Player Value Winner #3: Andres Torres, San Francisco Giants NL Leftfield Player Value Winner: Gerardo Parra, Arizona Diamondbacks
The outfield Gold Gloves are a little weird in that they aren't position specific. They don't go to the best defensive LF/CF/RF, but rather to the 3 best outfielders overall, which normally results in all centerfielders. I find this to be unfair to the quality corner outfielders. Each position has its own offensive and defensive expectations; a right fielder that can exceed those expectations by a greater amount than a center fielder should be rewarded. Sure, the center fielder is probably the better defender, but he's also more easily replaced by any other center fielder; the right fielder would have unique fielding talent. Thus, I don't compare all outfielders to some overall outfielder first quartile, because then we'd just get a bunch of centerfielders being the best fielders and a bunch of corner outfielders being the best hitters. Rather, I compare each outfield position to its own positional first quartile, and then aggregate the comparisons across all outfield positions. So I don't reward the 3 Gold Gloves to the best LF, best CF, and best RF. That's because the 2nd best CF may still have a greater difference above the first quartile than say the best LF, for example. That all said, Jay Bruce led all right fielders and outfielders in the NL and MLB with a Fielding Value of 27.58. Hey, I've given the Reds a Gold Glove after taking 2 away! Angel Pagan led all center fielders in the NL with a Fielding Value of 18.48. Andres Torres was 2nd among NL center fielders with a Fielding Value of 16.33. Gerardo Parra was the best defensive left fielder in the NL with a Fielding Value of 16.03, but he doesn't get a Gold Glove. Michael Bourn had a Fielding Value of 10.89, Carlos Gonzalez had a Fielding Value of -4.42, and Shane Victorino had a Fielding Value of 6. So the NL was 0 for 3 on getting the Gold Gloves right, according to Fielding Value. 'Cargo' was a pretty diverse outfielder, spending about 39% of his time in LF, 36% in CF, and 25% in RF. Victorino and Bourn were 100% center fielders, and Bruce was 100% a right fielder. Pagan was diverse too, with a 18%/61%/21% split between LF/CF/RF, and so too was Torres, with a 23%/51%/26% split. Gerardo Parra had a 64%/6%/30% split. Now let's fire out some fielding percentage, RFG, and RF9 comparisons to first quartiles, for each player, in that order: Bruce .992 vs .9835, 2.40 vs 1.85, and 2.63 vs 2.02 Pagan .987 vs .9848, 2.45 vs 2.13, and 2.71 vs 2.29 Torres .997 vs .9845, 1.96 vs 2.06, and 2.58 vs 2.23 Bourn .992 vs .986, 2.66 vs 2.38, and 2.78 vs 2.54 Victorino .995 vs .986, 2.59 vs 2.38, and 2.38 vs 2.65 Gonzalez .996 vs .9838, 1.66 vs 1.94, and 1.96 vs 2.11 And now let's fire out some putouts, assists, errors, and double plays above/below the first quartiles, for each player, in that order: Bruce +83.95 PO, +1.82 A, +0.89 E, +0 DP Pagan +56.65 PO, +6.37 A, +3.04 E, +1.78 DP Torres +44.56 PO, +3.58 A, -0.74 E, +1.76 DP Bourn +30.44 PO, +5.35 A, +1.12 E, +2 DP Victorino +10.44 PO, +8.18 A, +0 E, +4 DP Gonzalez -18.56 PO, +4.05 A, -0.83 E, +0.75 DP And lastly, let's fire out some Rfield, DRS, and UZR values for each player, in that order: Bruce 17 Rfield, 16 DRS, 19.6 UZR Pagan 21 Rfield, 19 DRS, 16.1 UZR Torres 17 Rfield, 14 DRS, 21.7 UZR (highest in the NL) Bourn 30 Rfield, 28 DRS (highest in the NL), 19.8 UZR Victorino 1 Rfield, 1 DRS, 1.3 UZR Gonzalez 2 Rfield, 1 DRS, -1.5 UZR The worst defensive outfielders in the NL were Carlos Lee of the Houston Astros with a Fielding Value of -19, Colby Rasmus of the St. Louis Cardinals with a Fielding Value of -17.57, and Matt Kemp of the Los Angeles Dodgers with a Fielding Value of -15.56. Here are their Rfield, DRS, and UZR values: Lee -17 Rfield, -16 DRS, -17.7 UZR (2nd worst in the NL) Rasmus -6 Rfield, -5 DRS, -6 UZR Kemp -37 Rfield, -33 DRS (worst in the NL and MLB), -25.8 UZR (worst in the NL and MLB) AL Outfield Actual Winner #1: Ichiro Suzuki, Seattle Mariners AL Outfield Actual Winner #2: Franklin Gutierrez, Seattle Mariners AL Outfield Actual Winner #3: Carl Crawford, Tampa Bay Rays AL Outfield Player Value Winner #1: Carl Crawford, Tampa Bay Rays (Best LF) AL Outfield Player Value Winner #2: Franklin Gutierrez, Seattle Mariners (Best CF) AL Outfield Player Value Winner #3: Adam Jones, Baltimore Orioles AL Rightfield Player Value Winner: Nelson Cruz, Texas Rangers
The AL fared better, getting 2 out of the 3 Gold Gloves correct according to Fielding Value. Crawford led all left fielders in the AL and MLB and led all outfielders in the AL with a Fielding Value of 23.28. Gutierrez led all center fielders in the AL and MLB with a Fielding Value of 20.99. Adam Jones was 2nd among AL center fielders with a Fielding Value of 20.54. Nelson Cruz doesn't get a Gold Glove, but he did lead the AL among right fielders with a Fielding Value 17.75. Ichiro gets his 10th and last career Gold Glove stripped, falling behind Cruz to finish 2nd in the AL among right fielders with a Fielding Value of 15.37. Crawford was a 98% LF and 2% DH. Gutierrez was a 97% CF and 3% DH. Jones was 100% a CF. Cruz was a 13% LF, 85% RF, and 3% DH. Ichiro was a 99% RF and a 1% DH. Here are their fielding percentage, RFG, and RF9 comparisons: Crawford .994 vs .9823, 2.13 vs 1.61, 2.24 vs 1.76 Gutierrez 1.000 vs .986, 2.84 vs 2.38, 2.92 vs 2.54 Jones .984 vs .986, 2.91 vs 2.38, 3.01 vs 2.54 Ichiro .989 vs .9835, 2.26 vs 1.85, 2.30 vs 2.02 Cruz .981 vs .9832, 2.34 vs 1.81, 2.56 vs 1.99 I went ahead and included Cruz since having a now-prominent DH rating higher than the legendary Ichiro is interesting, and since the AL got 2 players right already we have less other players to compare to. Here are their above/below first quartile putouts, assists, errors, and double plays comparisons: Crawford +69.33 PO, +2.66 A, +0.44 E, +0 DP Gutierrez +60.13 PO, -0.85 A, -2.02 E, +0 DP Jones +63.32 PO, +9.11 A, +4.95 E, +6 DP Ichiro +49.02 PO, +0.90 A, +1.51 E, -0.18 DP Cruz +61.46 PO, -0.73 A, +3.50 E, +0.36 DP Here are their values for Rfield, DRS, and UZR: Crawford 8 Rfield, 8 DRS, 17.9 UZR Gutierrez 0 Rfield, -2 DRS, 5.9 UZR Jones -8 Rfield, -6 DRS, -3.8 UZR Ichiro -1 Rfield, -1 DRS, 14.1 UZR Crus 3 Rfield, 1 DRS, 10.1 UZR Not much agreement with Fielding Value here, it seems. Brett Gardner had the highest DRS in the AL and MLB at 33, and the highest UZR in the AL and MLB at 24.8. Fielding Value rates him at 13.13. The worst defensive outfielders in the AL were Carlos Quentin of the Chicago White Sox with a Fielding Value of -7.85, Grady Sizemore of the Cleveland Indians with a Fielding Value of -4.01, and Michael Brantley of the Cleveland Indians with a Fielding Value of -3.22. I'll note that Willie Bloomquist rated at -5.14 and played 72 games in the AL that season with the Royals, and 11 games in the NL with the Reds. There were a good number of inferior NL outfielders that weren't mentioned previously that fared worse than these worst AL outfielders. Here are our 3 worst AL outfielders Rfield, DRS, and UZR values: Quentin -24 Rfield, -23 DRS (worst in the AL), -25.2 UZR (worst in the AL) Sizemore -3 Rfield, -3 DRS, -1 UZR Brantley -15 Rfield, -13 DRS, -9 UZR Pitchers NL Pitcher Actual Winner: Bronson Arroyo, Cincinnati Reds NL Pitcher Player Value Winner: R.A. Dickey, New York Mets
Golly, I've done it again! Yet another Red stripped of a Gold Glove. Dickey led all pitchers in the NL and MLB with a Fielding Value of 10.89. Arroyo still fared pretty well with a Fielding Value of 5.83. If we wanted to reward the best defensive NL reliever, that would go to Evan Meek of the Pittsburgh Pirates with a Fielding Value of 7.89. Dickey was a 96% SP and 4% RP, while Arroyo was 100% a SP. Dickey was in the field for about 174 innings, and Arroyo was in the field for about 216 innings. Dickey had a Fielding Value Average of .1174 compared to a first quartile of .0499, while Arroyo's was .0773 vs .0503. Here are their fielding percentage, RFG, and RF9 first quartile comparisons: Dickey 1.000 vs .9384, 2.26 vs 1.01, 3.15 vs 1.53 Arroyo 1.000 vs .9388, 1.48 vs 1.05, 2.04 vs 1.54 Here are their putouts, assists, errors, and double plays above/below their first quartiles: Dickey +10.06 PO, +24.49 A, -0.73 E, +3.16 DP Arroyo +9.31 PO, +6.58 A, -0.93 E, +3.92 DP Pitcher's don't have UZR incorporated into their FanGraphs WAR, and their Baseball Reference Rfields are always set to 0. Both Dickey and Arroyo had DRS values of 8. Evan Meek had a DRS of 2. Jake Westbrook had a DRS of 12 and played 12 games with the Cardinals, but spent most of the season (21 games) with the Indians in the AL. Jon Garland of the San Diego Padres led the NL with a DRS of 9. Westbrook's Fielding Value while in the NL was 6.95, and Garland's was 8 (4th highest). The worst defensive pitcher in the NL was Travis Wood of the Cincinnati Reds with a Fielding Value of -3.35. He had a DRS of 1. The worst defensive reliever in the NL was Ryota Igarashi of the New York Mets with a Fielding Value of -1.4, who also had a DRS of 1. Tim Lincecum of the San Francisco Giants had the worst DRS in the NL at -6, and had a Fielding Value of -2.85 (3rd worst in NL). AL Pitcher Actual Winner: Mark Buehrle, Chicago White Sox AL Pitcher Player Value Winner: Fausto Carmona/Roberto Hernandez, Cleveland Indians
The Pitcher Formerly Known As Fausto Carmona, and since revealed to be named Roberto Hernandez, led the AL with a Fielding Value of 9.60. Buehrle fared pretty well too with a Fielding Value of 6.66 (thrice in one post, yeesh). Both these guys were 100% starters. They also both pitched about 210 innings. Hernandez had a Fielding Value Average of .0921, and Buehrle's was .0803. The first quartile for AL starters was .0434. The best defensive AL reliever was Jamey Wright of the Cleveland Indians and Seattle Mariners, who had a Fielding Value of 4.34. Here are the fielding percentage, RFG, and RF9 comparisons: Buehrle 1.0000 vs .9383, 1.52 vs 0.87, 2.14 vs 1.29 Hernandez .9680 vs .9383, 1.85 vs 0.87, 2.61 vs 1.29 Here are the putouts, assists, errors, and double plays above/below comparisons: Buehrle -4.38 PO, 29.02 A, -0.22 E, 2.99 DP Hernandez 13.62 PO, 22.02 A, 1.78 E, 4.99 DP Buehrle led the AL and MLB with a DRS of 12, tied with the aforementioned Jake Westbrook. Westbrook's Fielding Value while in the AL was only 2.26, however. Hernandez had a DRS of 2. Jamey Wright had a DRS of 0. The worst defensive pitcher in the AL was Colby Lewis of the Texas Rangers, with a Fielding Value of -4.47. He had a DRS of -5. Jeremy Bonderman of the Detroit Tigers had the worst DRS in the AL and MLB at -8, but his Fielding Value wasn't nearly as bad at -0.87. GOLD GLOVE SUMMARY Now that we've gone through each position and each league, here's a quick summary of the players that should have won the Gold Glove at each position, based on Fielding Value: AL C - Jose Molina, Blue Jays 1B - Michael Cuddyer, Twins 2B - Robinson Cano (actual winner), Yankees 3B - Jose Lopez, Mariners SS - Alexei Ramirez, White Sox OF - Franklin Gutierrez (actual winner), Mariners OF - Carl Crawford (actual winner), Rays OF - Adam Jones, Orioles P - Fausto Carmona/Roberto Hernandez, Indians NL C - Miguel Olivo, Rockies 1B - Albert Pujols (actual winner), Cardinals 2B - Clint Barmes, Rockies 3B - Placido Polanco, Phillies SS - Troy Tulowitzki (actual winner), Rockies OF - Jay Bruce, Reds OF - Angel Pagan, Mets OF - Andres Torres, Giants P - R.A. Dickey, Mets The AL got 3 of their 9 right, and the NL got 2 of their 9 right. The Mariners led the AL with 2 winners and the Rockies led the NL with 3 winners. PLATINUM GLOVES The Platinum Glove is supposed to be awarded to the best defensive player in each league. You can view past winners here. Only players that also won a Gold Glove are eligible, and the winner is determined via a fan vote. Since the award began in 2011, we don't have an actual player to compare to for the 2010 season. NL Player Value Winner: Albert Pujols, St. Louis Cardinals, First Base AL Player Value Winner: Alexei Ramirez, Chicago White Sox, Shortstop As previously mentioned, Pujols led all positions in the MLB with a Fielding Value of 39.50. Alexei Ramirez led all positions in the AL with a Fielding Value of 30.13. Michael Bourn had the highest DRS in the NL among all positions at 28 and the highest UZR in the NL among all positions at 19.8, and as previously mentioned had a Fielding Value of 10.89. Brett Gardner had the highest DRS in the AL among all positions at 25 and the highest UZR in the AL among all positions at 25.8, and as previously mentioned had a Fielding Value of 13.13. I find my metric to be more positionally diverse, as a first baseman and a shortstop won. The advanced metrics seem to be more biased (at least on the sample size of the 2010 season), with the top 2 players both being outfielders. FIELDING VALUE BY POSITION Maybe you've seen the results and think that the metric is flawed since Albert Pujols rated the highest. Surely a first baseman can't be the best defender in the MLB! Well, think again. As explained at the beginning, it's how you compare to everyone else at your position that makes you valuable. To be valuable is to be uniquely good, not good in comparisons that don't matter. If a player has grown up playing baseball and has been groomed into being a shortstop it does not matter AT ALL if he is a better defender than his team's first baseman. It does not matter AT ALL that shortstop is generally a more difficult position to defend. All that matters is that the player is a shortstop and that therefore there are expectations of his defensive ability. There is a pool of available MLB shortstops across the league, and all we care about is how our shortstop is doing compared to everyone else. If I have the worst defensive shortstop in the league and he can't make up for it with his bat, he's got to go. If I have the best defensive first baseman in the league and he can adequately hit, I'll keep him around. The shortstop to first base comparison is of no consequence to my decision; if I swapped the players, my first baseman would probably be the greatest hitting shortstop the world has known and the worst defensive shortstop in history, while my shortstop would be a very poor hitting first baseman and likely not a great defensive one either given the uniqueness of the position. I hope I got my point across and I really can't emphasize this enough; relative to position is all that matters. Let's check out some boxplots of Fielding Value, by position:  If anything, center fielders and shortstops have more spread and thus more potential to set themselves apart. But for the most part, players at each position have a similar opportunity to be among the best defenders or among the worst defenders at their position. Let's view some summary statistics of Fielding Value, by position:  Note that these values are among all players, not just starters. Guys that don't play much or that are truly about first quartile quality are going to be closer to 0. Guys that play often and are among the bottom 25% are going to have larger negative values. Guys that play often and are not among the bottom 25% are likely to have positive values. So there isn't a universal bad/decent/good scale that we can use for Fielding Value, but players with Fielding Values less than their position's FirstQuart value above are poor defenders, players with Fielding Values around their position's Median value above are average/typical defenders, and players with Fielding Values greater than their position's ThirdQuart value above are good defenders. If your Fielding Value is close to your position's Max value above, you're in elite, Gold Glove territory. If your Fielding Value is close to your position's Min value above... hopefully you can hit or are considering a position or career change. FIELDING VALUE BY TEAM How did Fielding Value do in explaining which teams were the best defensively in 2010? Let's take a look at boxplots of Fielding Value by team:  Looks like the Tiger were pretty good at fielding, despite having no Gold Glove winners. The Mariners look pretty good, as do the Reds, the Orioles, and the Twins. Some teams have a few outstanding players but maybe not as good as medians, while other teams have higher medians but no superstars. Let's take a look at the summary statistics of Fielding Value by team in 2010: 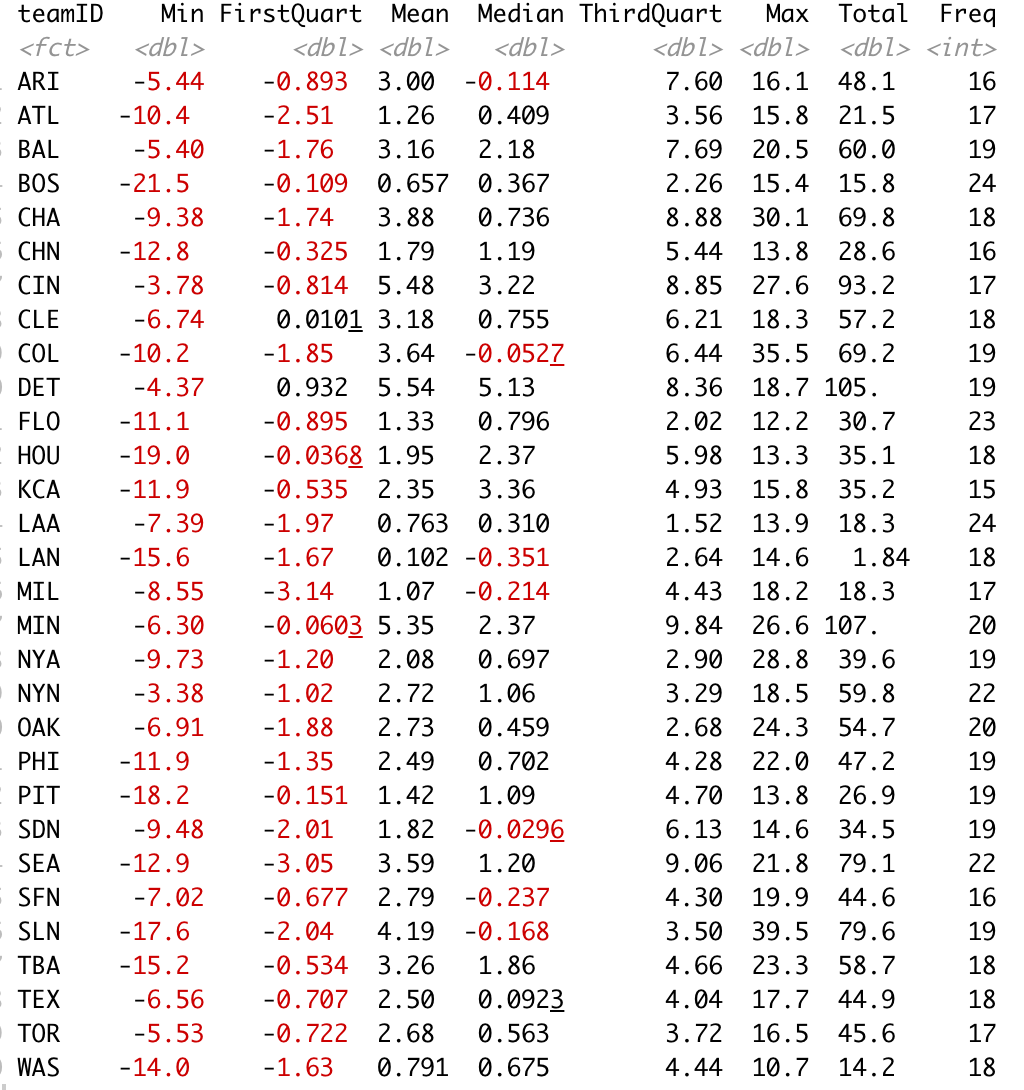 A lot to take in, but we get some useful pieces of info, and some not. The Reds have a high average and total, and were good in 2010, going 91-71 and winning their division. The Twins have a high average and total, and were also good in 2010, going 94-68 and winning their division. But the Tigers have a high average and total and finished .500 and 3rd in their division. The Rangers and Giants don't look too impressive, but they both went to the World Series. The Nationals and Pirates have low totals and both finished last in their divisions. The Mariners have a low average and finished last in their division. So we can make some conclusions, but nothing too definitive. Of course, fielding is only one piece of the equation. Maybe once we add in batting, pitching, and baserunning, we'll get a clearer picture. I'll also note that the totals above are only for players that played their entire seasons with 1 team. Guys that switched teams got thrown out. Here's a plot of runs allowed by team in 2010:  Of course, some of runs allowed are due to pitching, not fielding, but we get a little context here as well. Reds had a high total Fielding Value and are on the lower end of runs allowed. Pirates had a low total Fielding Value and are on the higher end of runs allowed. But Braves and Padres had low total Fielding Values and also low runs allowed, meaning they likely had stellar pitching.
Thank you for reading and I hope you've found this first application of Fielding Value interesting. I plan to do a similar thing (but in much less detail) for the other years. First, however, I will continue the application of Player Value on the 2010 season. Next up will be using Batting Value to determine the 2010 Silver Sluggers, and then I'll use Total Player Value to determine our MVPs, RoYs, and 1st team/2nd team honors, as well as Pitching Value to determine our Cy Youngs and Relievers of the Year. As always, let me know your thoughts in the comments below. Now I normally like to share my Excel files and R code, but if I did that then you'd get a sneak peak into our leaders in other areas. For now you'll have to wait, but I'll share everything once I've completed the run through of the 2010 season. Statting Lineup Newsletter Signup Form: If you'd like to receive email updates for each new post that I make, sign up for the Statting Lineup newsletter using the link below: https://weebly.us18.list-manage.com/subscribe?u=ab653f474b2ced9091eb248b1&id=3a60f3b85f In my last post I introduced my Player Value metric, which seeks to be a simplified version of WAR. The jist is that we determine the run-value of each of the different events in baseball (like hitting a home run, catching a pop fly, and so forth) and then reward or dock players for each time they record those events. We then compare players to their position's first quartile values. This addendum serves to address 3 changes to Player Value since the original post. Like WAR, I intend to continuously update this metric to make it the best that it can be. Unlike WAR, I will always apply the same version of the metric to all players across time. I won't measure defense one way for Honus Wagner and another way for Andrelton Simmons. The first update was pointed out to me after I shared my metric on the r/Sabermetrics sub-Reddit. My previous "Run Driving In Value" was flawed because I was rewarding batters for the entire value of the runs that they drove in. Realistically, those players already had probabilities of scoring. Driving them in should only reward batters for the increase in probability. For example, previously I determined that there are .4057 RBI per double hit, which served as the Run Driving In Value. I was saying that in that respect, a double was worth .4057 runs. However, the probability that say a man on 2nd with 0 outs will score is already 62.11%. If you hit a double and drove the runner in, you shouldn't get credit for the entire run. Rather, you should only be rewarded for the 1-.6211 = 37.89% additional probability. To this end, I have removed the Run Driving In Value from the metric weights and concentrated it all into the Baserunner Effecting Value. I calculate the probability increase of going from 3rd to home on a single the same exact way that I previously calculated the increase of going from 2nd to 3rd on a single. The only change is that I'm not intentionally ignoring the scoring scenarios like I was before, since I'm no longer relying on the Run Driving In portion to cover it. The second update was one improvement that I noted I could make immediately at the bottom of the last post. I previously assumed that all events that put you on the same base gave you the same probability of scoring. This is to say, I assumed that a single and an intentional walk gave you the same probability of scoring, since you end up at first base for both. However, the frequencies with which these events occur leave themselves to be differently conducive at scoring runs. For singles, 24.63% of them occur with nobody on and 0 outs, resulting in you being on first with nobody else on and still 0 outs. This situation gives you a 42.64% shot at scoring. For intentional walks, 29.32% of them occur with a man on 2nd and 2 outs. This puts you at 1st with 2 outs and a man on 2nd after you've been intentionally walked, giving you a probability of scoring of just 11.91%. Clearly, intentional walks take place more commonly in situations where scoring is less likely. The same is true for our other events; base-out state frequencies play a role in our events' probabilities of scoring. Because of this, I have adjusted the Run Scoring Value for all of the events. The Run Scoring Value is now the weighted average probability of scoring of each scenario. You can see a calculation example with singles below: 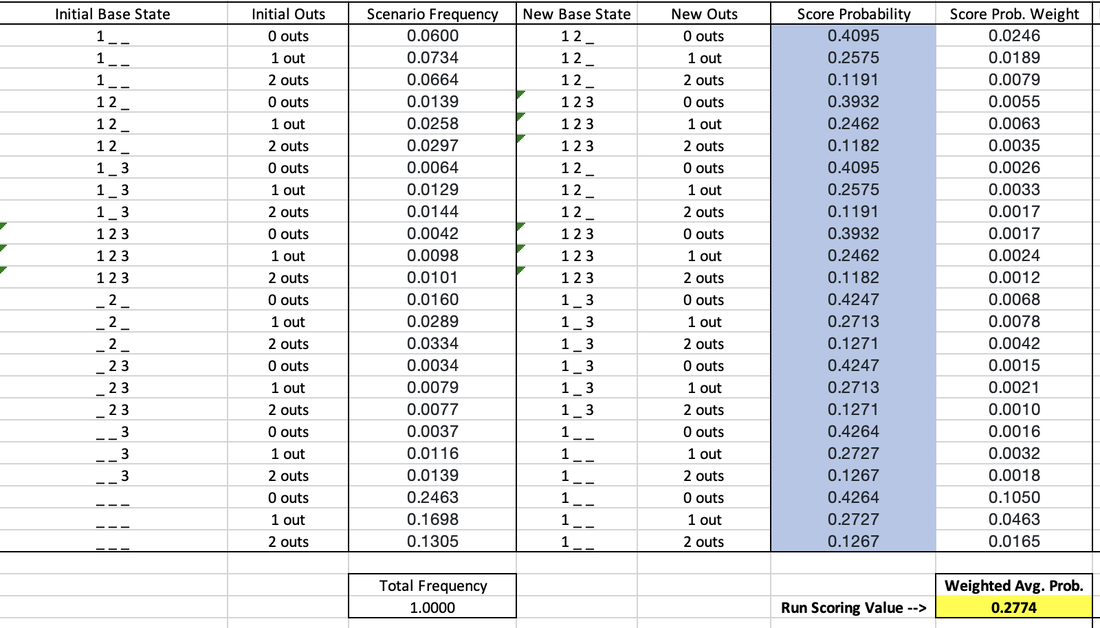 I already mentioned the nobody on, nobody out example above. For another example, about 6% of singles take place with a man on 1st out and 0 outs. When the single is hit, we assume all baserunners will advance as many bases as the batter does (in this case, one). That makes the new situation men on 1st and 2nd with still 0 outs. For the guy on first, this gives him a 40.95% chance of scoring, which is multiplied by the likelihood that scenario occurs (6%) to get the weight of .0246. Adding these up across all possible scenarios, we get the weighted average probability of scoring after hitting a single of 27.74%. The same process was applied to all events. Since I changed the probability of scoring for each event, this also impacted the Future Batters Effecting Value for each event, but the calculation for that piece remained the exact same. The new baseline probability of scoring when you walk up to the plate is 11.24%, and the new Future Batters Effecting Value for outs is -.1080. So I've updated the Run Scoring Value for each event, which impacted the baseline probability of scoring. Thus each event has a new Run Scoring Value Over Baseline. I essentially merged the Run Driving In Value with the Baserunners Effecting Value, and changed the method by which I calculated the Run Driving In Value piece. Lastly, the change in the baseline probability of scoring also impacted the Future Batters Effecting Value for the different events. The third update that I did was also thanks to the r/Sabermetrics sub-Reddit. I was previously weighting the value of an error as the difference between a "non-HR hit" and an "other Out". Realistically, it is unlikely that an error would result in a batter reaching 3rd base solely due to the error. An error will likely put a guy on 1st, and maybe on 2nd if an outfielder drops a flyball or something. To account for this, I calculated a "1B or 2B hit" value that is the weighted average value of a single and double. I now calculate the error as the difference between a "1B or 2B hit" and an "other out". This makes the new value of an error -.6797. You can see the result of these 3 updates in the new run-value weights for each event below: 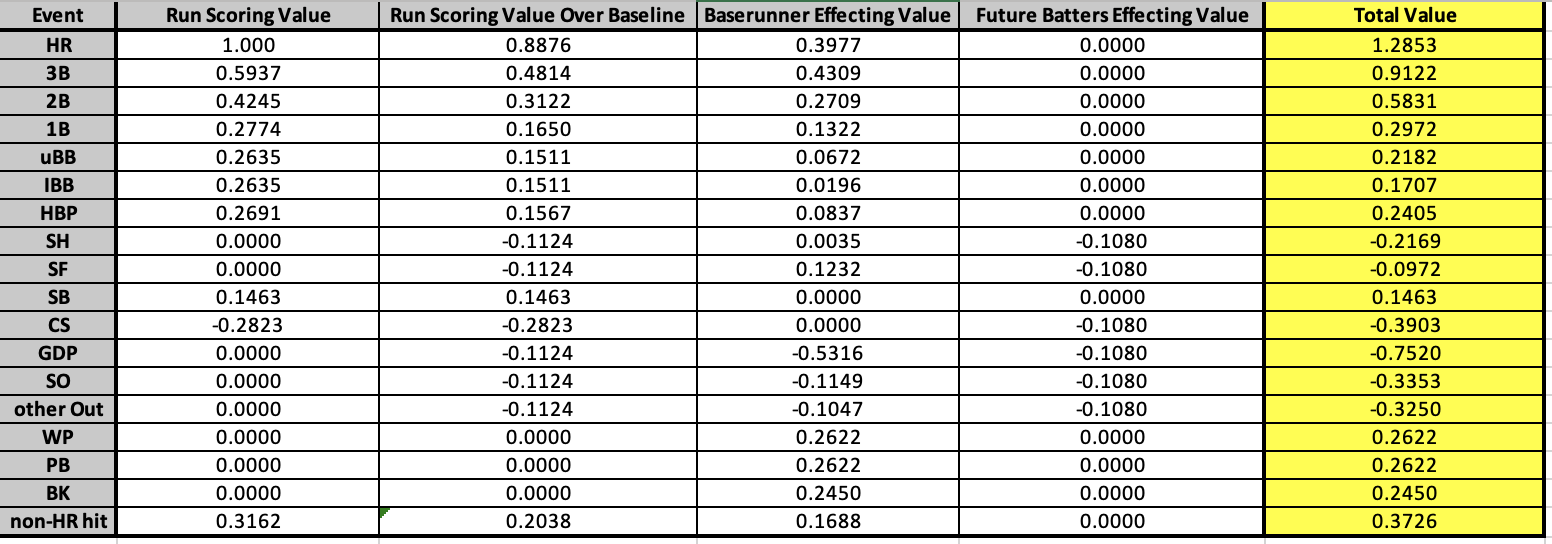 Some events like wild pitches, balks, and passed balls were unaffected by these updates. Most events were changed slightly, but not drastically. The event that had its value change the most was the sac fly, from .6274 to -.0972. This is because I was previously rewarding the batter an entire run for driving the guy on 3rd in. However, the baserunner on 3rd has already done the bulk of the work for that run. Moreover, since there are only 0 outs or 1 out, the guy on 3rd already has a high probability of scoring, even for "being on third base" standards. Bringing him in via sac fly only marginally increases the probability, which gets outnumbered by the detrimental value of the additional out on any remaining baserunners or future batters. The overall effect of these updates is a more accurate measure that intuitively makes more sense. However, there is also an effect on the its ability to describe runs scored and runs allowed per game. Batting Value Average previously had a correlation with runs scored per game of .9341, with an R^2 of .8726. After these updates, it now has a correlation with runs scored per game of .9463 and an R^2 of .8956. So, we improved! When we previously added Baserunning Value Average into the mix, we got an adjusted R^2 of .9071 when running a multiple linear regression to predict runs scored per game. After the updates, we now have an adjusted R^2 of .9238. Again, on the offensive side we see improvement with these updates. Pitching Value Average previously had a correlation with runs allowed per game of -.9217, with an R^2 of .8495. After these updates, it now has a correlation with runs allowed per game of -.9199 and an R^2 of .8462. So, we got a little worse on the pitching side. When we previously added Fielding Value Average into the mix, we got an adjusted R^2 of .8757 when running a multiple linear regression to predict runs allowed per game. After the updates, we now have an adjusted R^2 of .861. Thus overall on the defensive side we lost some performance with these updates. Offensively, we went from describing 90.71% of runs scored per game to 92.38%, a gain of 1.67%. Defensively, we went from describing 87.57% of runs allowed per game to 86.1%, a loss of 1.47%. Thus overall, we increased the descriptive ability of the Player Value metric by 0.2%. This increase is pretty marginal on the measurement side, but again remember that correlation isn't everything; OPS isn't better than wOBA. Having a process that intuitively and mathematically makes more sense is more important, and that is what was really improved through these updates. Below is an updated comparison of my metric's weights with those of other metrics:  Thank you for reading this addendum to Player Value. I look forward to applying this to players in the 2010 season and sharing the results! As always, let me know any thoughts you may have in the comments below. See below for updated versions of the files that I shared in the initial Player Value post:
Statting Lineup Newsletter Signup Form:
If you'd like to receive email updates for each new post that I make, sign up for the Statting Lineup newsletter using the link below: https://weebly.us18.list-manage.com/subscribe?u=ab653f474b2ced9091eb248b1&id=3a60f3b85f |
Statting Lineup Newsletter Signup Form:
|
|||||||||||||||||||||||||||||||||||||||||||||||||||||||||||||||||||||||||||||||||||||||||||||||||||||||||||||||||||||||||||||||||||||||||||||||||||||||||||||||||||||||||||||||||||||||||||||||||||||||||||||||||||||||||||||||||||||||||||||||||||||||||||||||||||||||||||||||||||||||||||||||||||||||||||||||||||||||||||||||||||||||||||||||||||||